

Are trends in billing for high-intensity emergency care explained by changes in services provided in the emergency department? An observational study among US Medicare beneficiaries
- PMID: 29382680
- PMCID: PMC5829666
- DOI: 10.1136/bmjopen-2017-019357
Are trends in billing for high-intensity emergency care explained by changes in services provided in the emergency department? An observational study among US Medicare beneficiaries
Abstract
Objective: There has been concern that an increase in billing for high-intensity emergency care is due to changes in coding practices facilitated by electronic health records. We sought to characterise the trends in billing for high-intensity emergency care among Medicare beneficiaries and to examine the degree to which trends in high-intensity billing are explained by changes in patient characteristics and services provided in the emergency department (ED).
Design, setting and participants: Observational study using traditional Medicare claims to identify ED visits at non-federal acute care hospitals for elderly beneficiaries in 2006, 2009 and 2012.
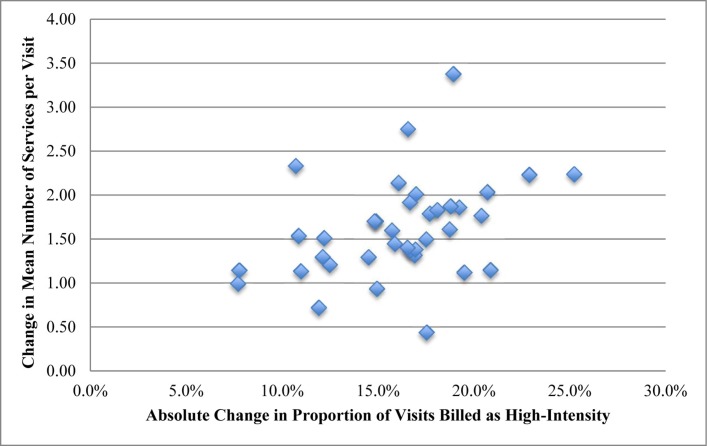
Outcomes measures: Billing intensity was defined by emergency physician evaluation and management (E&M) codes. We tested for overall trends in high-intensity billing (E&M codes 99285, 99291 and 99292) and in services provided over time using linear regression models, adjusting for patient characteristics. Additionally, we tested for time trends in rates of admission to the hospital and to the intensive care unit (ICU). Next, we classified outpatient visits into 39 diagnosis categories and analysed the change in proportion of high-intensity visits versus the change in number of services. Finally, we quantified the extent to which trends in high-intensity billing are explained by changes in patient demographics and services provided in the ED using multivariable modelling.
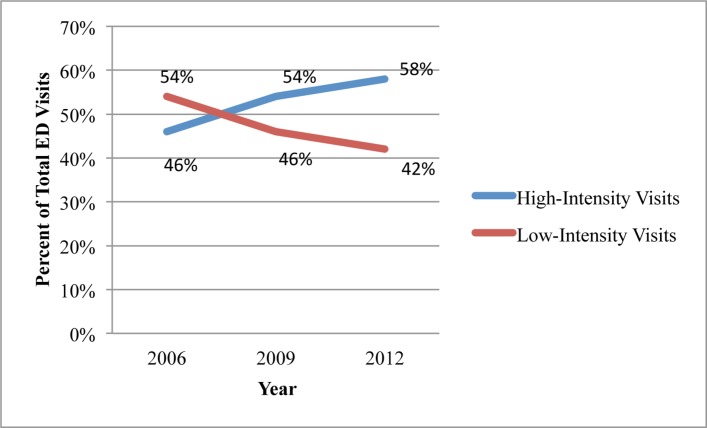
Results: High-intensity visits grew from 45.8% of 671 103 visits in 2006 to 57.8% of 629 010 visits in 2012 (2.0% absolute increase per year; 95% CI 1.97% to 2.03%) as did the mean number of services provided for admitted (1.28 to 1.41; +0.02 increase in procedures per year; 95% CI 0.018 to 0.021) and discharged ED patients (7.1 to 8.6; +0.25 increase in services per year; 95% CI 0.245 to 0.255). There was a reduction in hospital admission rate from 40.1% to 35.9% (-0.68% per year; 95% CI -0.71% to -0.65%; P<0.001), while the ICU rate of admission rose from 11.7% to 12.3% (+0.11% per year; 95% CI 0.09% to 0.12%; P<0.001). When we stratified by diagnosis category, there was a moderate correlation between change in visits billed as high intensity and the change in mean number of services provided per visit (r=0.38; 95% CI 0.07 to 0.63). Trends in patient characteristics and services provided accounted moderately for the trend in practice intensity for outpatient visits (pseudo R2 of 0.47) but very little for inpatient visits (0.051) and visits overall (0.148).
Conclusions: Increases in services provided in the ED moderately account for the trends in billing for high-intensity emergency care for outpatient visits.
Keywords: health policy; quality in health care.
© Article author(s) (or their employer(s) unless otherwise stated in the text of the article) 2018. All rights reserved. No commercial use is permitted unless otherwise expressly granted.
Conflict of interest statement
Competing interests: None declared.
Figures
References
-
- Brill S. Bitter pill: why medical bills are killing us: Time, 2013.
-
- Boyd D. The potential impact of alternative health care spending scenarios on future and local government budgets: Brookings Institute, 2014.
Publication types
MeSH terms
LinkOut - more resources
Full Text Sources
Other Literature Sources
Medical