. 2018 Mar;176(3):2251-2276.
doi: 10.1104/pp.17.01448. Epub 2018 Jan 30.

Plant Temperature Acclimation and Growth Rely on Cytosolic Ribosome Biogenesis Factor Homologs

Affiliations

Plant Temperature Acclimation and Growth Rely on Cytosolic Ribosome Biogenesis Factor Homologs

Olga Beine-Golovchuk et al. Plant Physiol. 2018 Mar.

Abstract

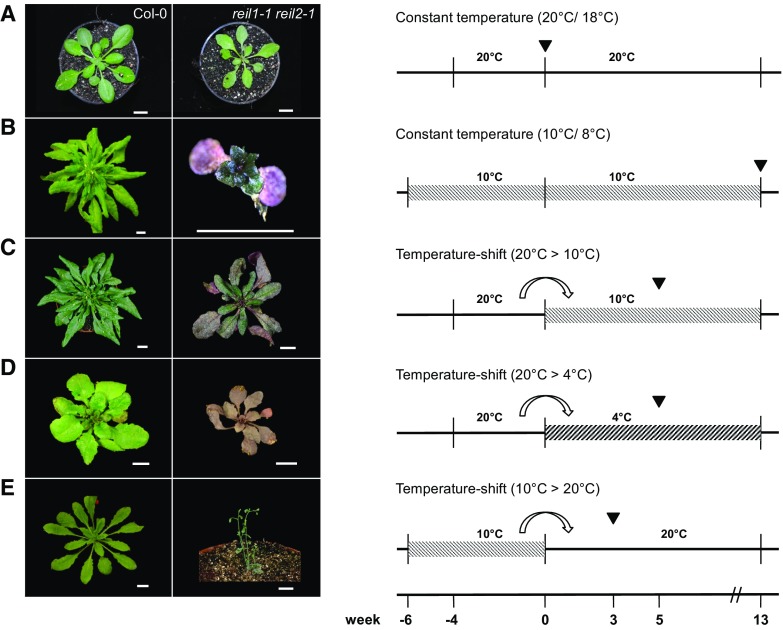
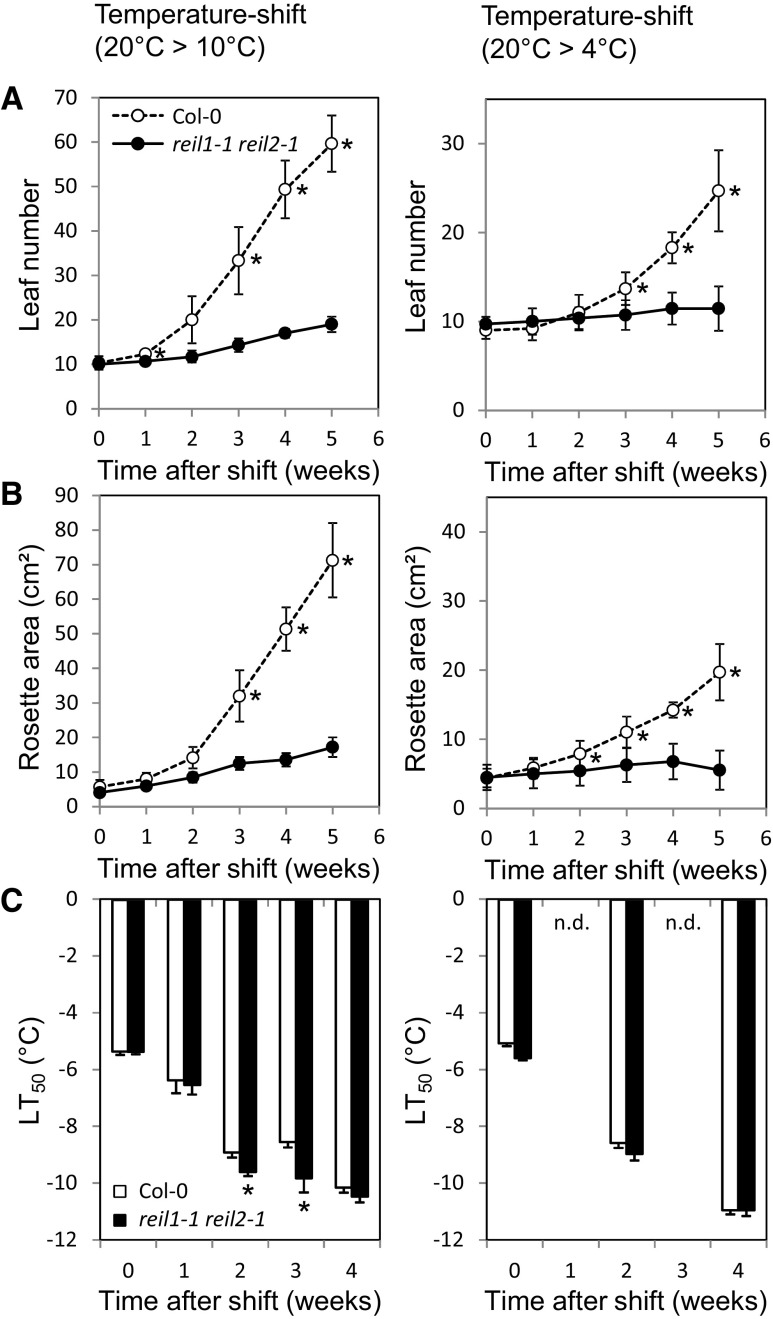
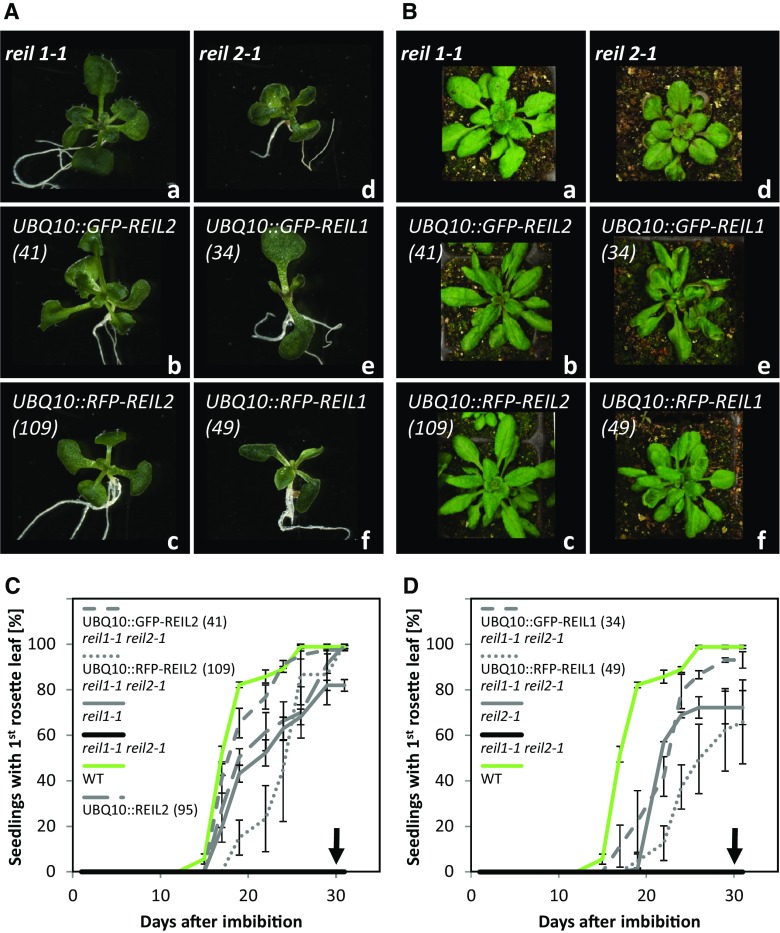
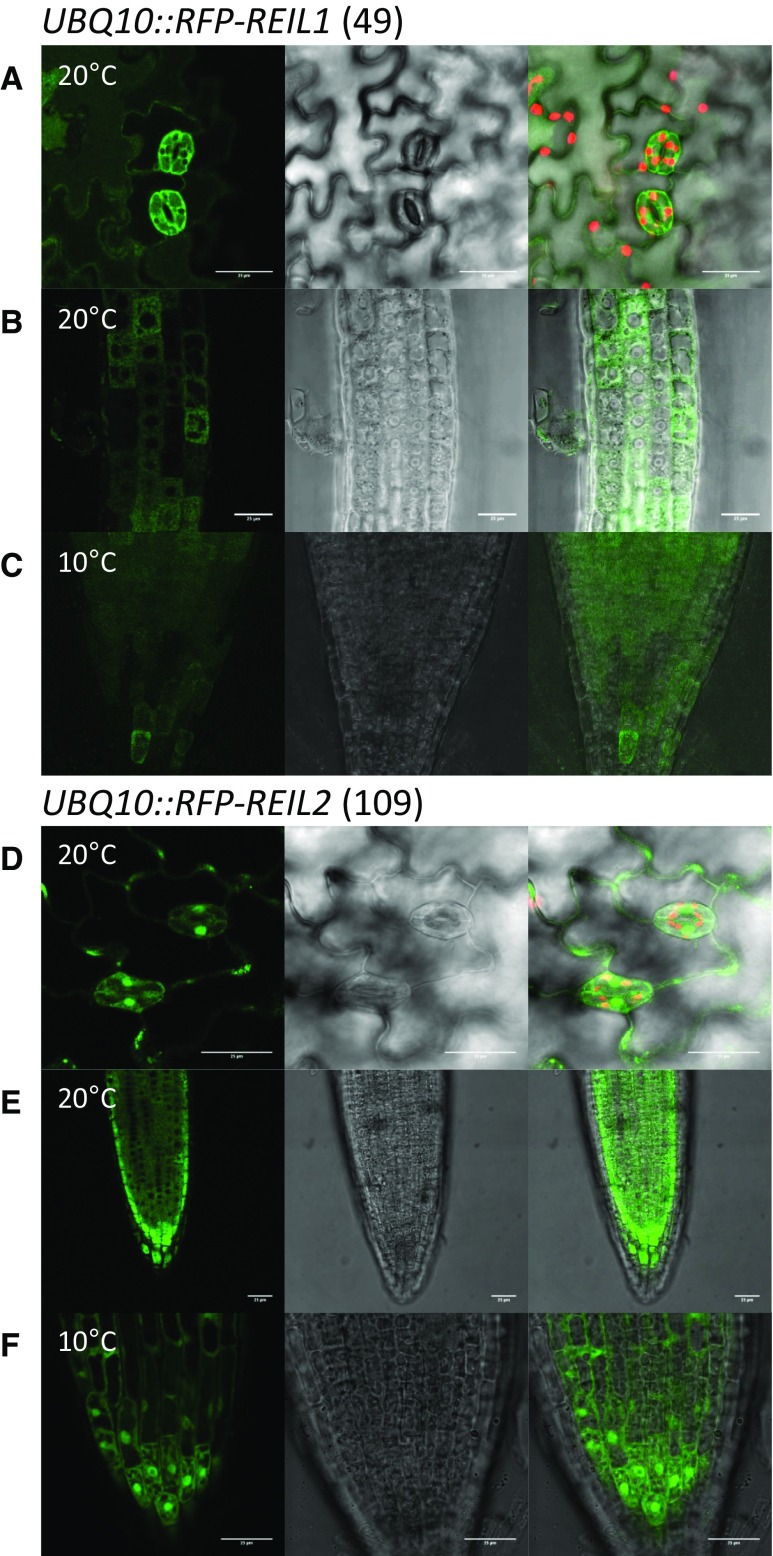
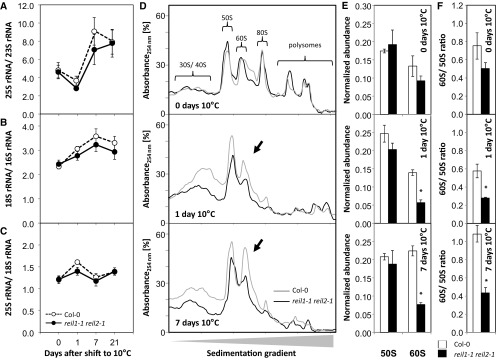
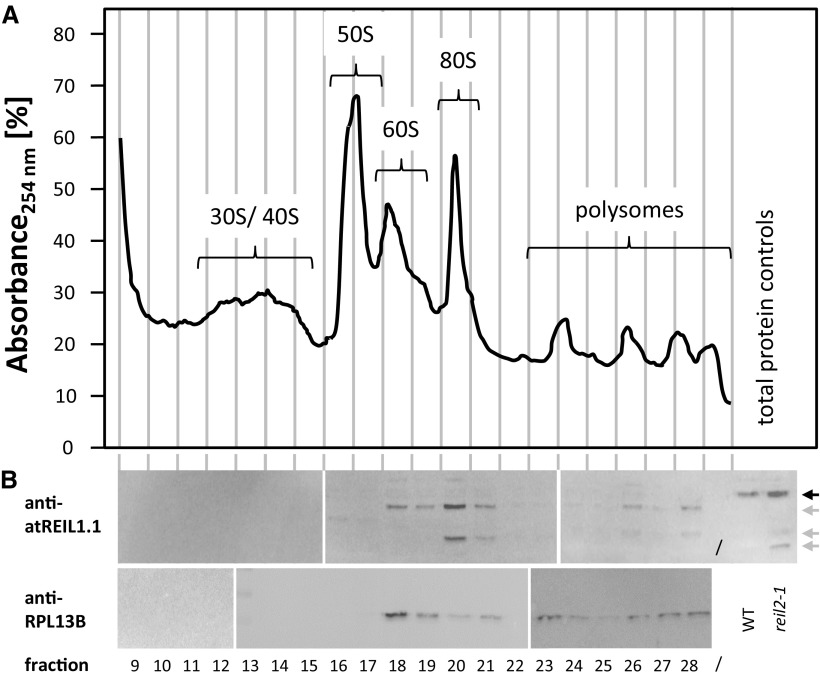
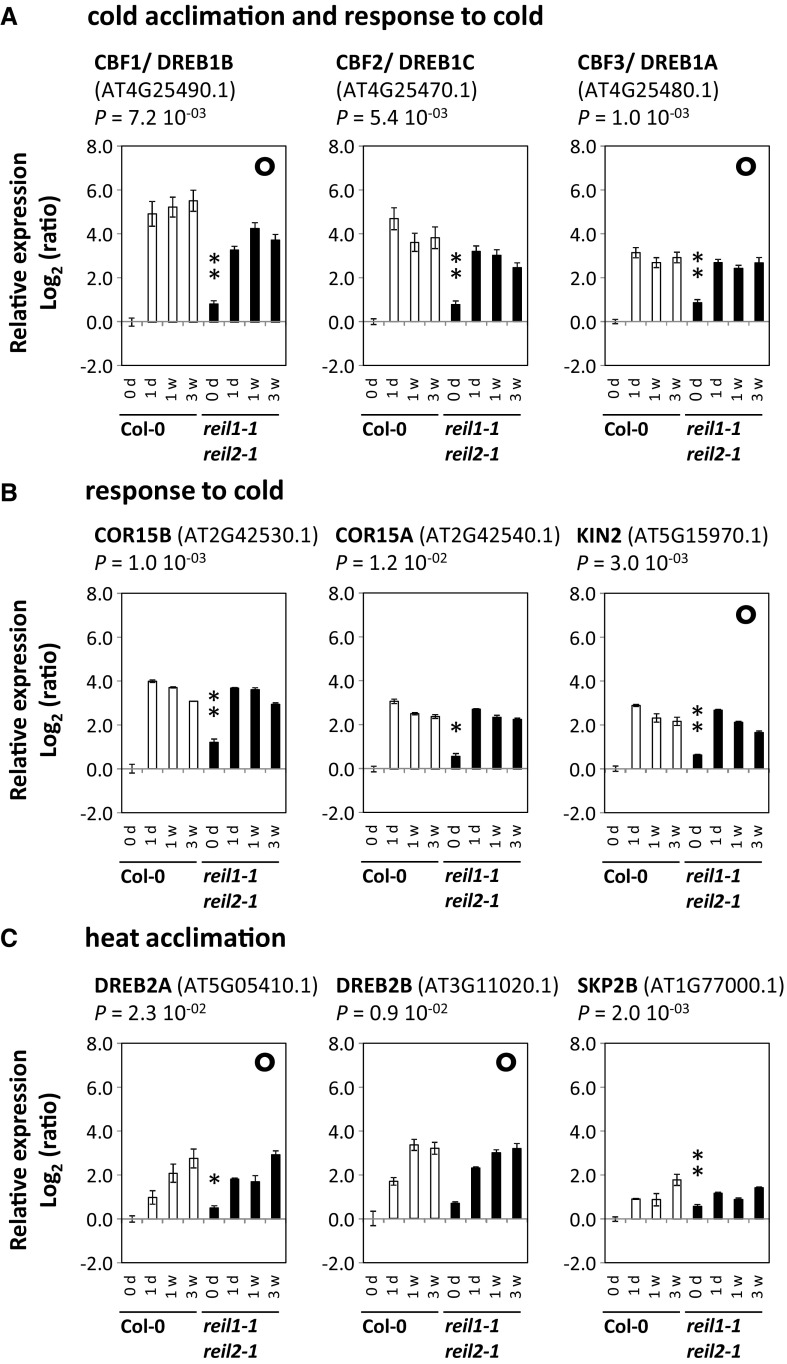
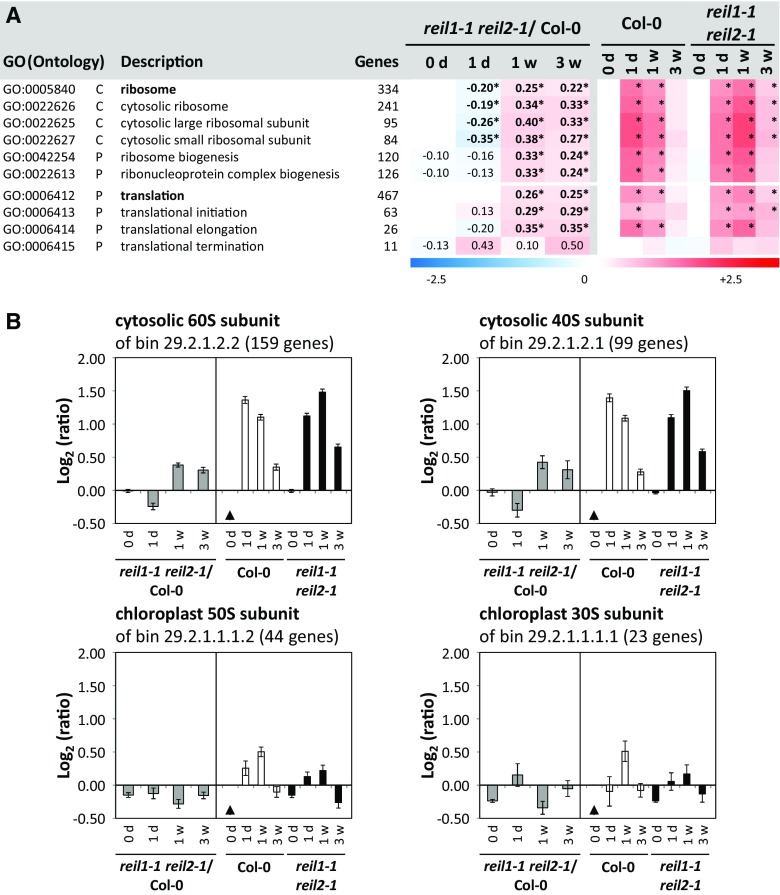
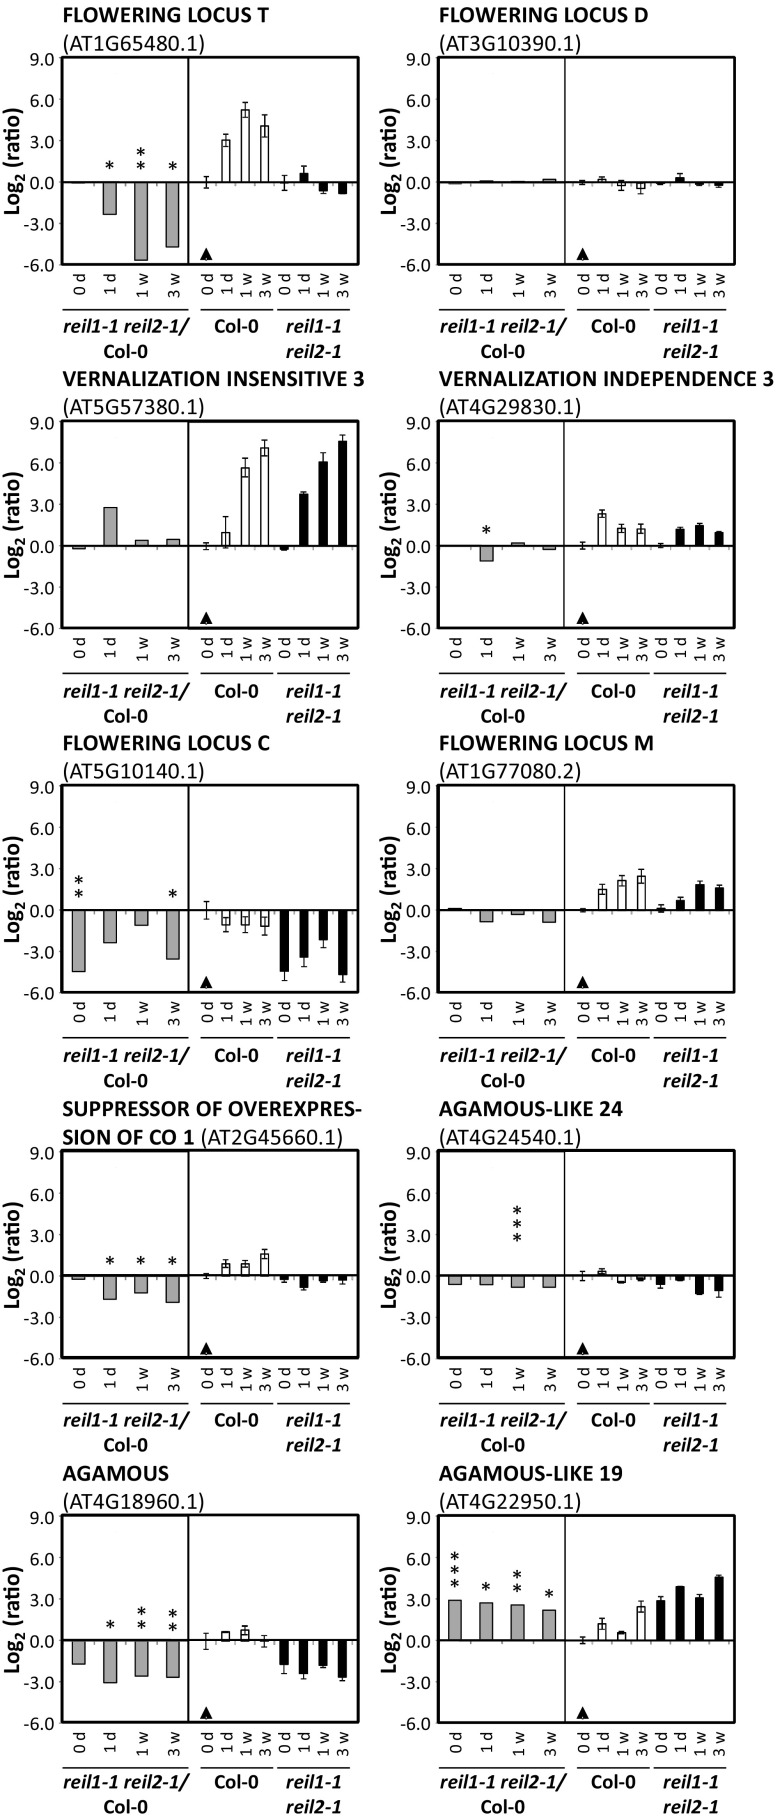
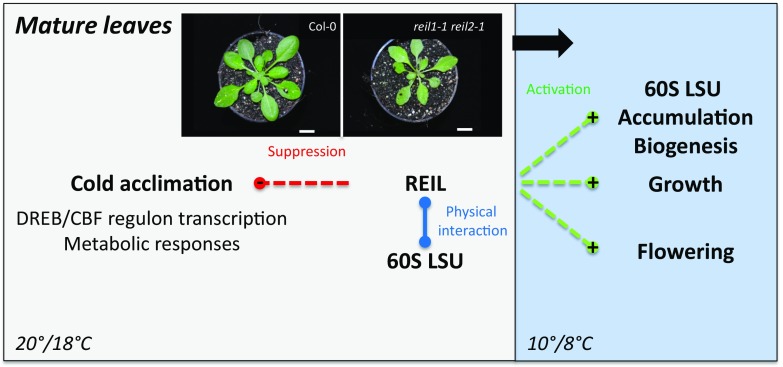
Arabidopsis (Arabidopsis thaliana) REI1-LIKE (REIL) proteins, REIL1 and REIL2, are homologs of a yeast ribosome biogenesis factor that participates in late cytoplasmic 60S ribosomal subunit maturation. Here, we report that the inhibited growth of the reil1-1 reil2-1 mutant at 10°C can be rescued by the expression of amino-terminal FLUORESCENT PROTEIN (FP)-REIL fusions driven by the UBIQUITIN10 promoter, allowing the analysis of REIL function in planta. Arabidopsis REIL1 appears to be functionally conserved, based on the cytosolic localization of FP-REIL1 and the interaction of native REIL1 with the 60S subunit in wild-type plants. In contrast to its yeast homologs, REIL1 also was present in translating ribosome fractions. Systems analysis revealed that wild-type Arabidopsis remodels the cytosolic translation machinery when grown at 10°C by accumulating cytosolic ribosome subunits and inducing the expression of cytosolic ribosomal RNA, ribosomal genes, ribosome biogenesis factors, and translation initiation or elongation factors. In the reil1-1 reil2-1 mutant, all processes associated with inhibited growth were delayed, although the plants maintained cellular integrity or acquired freezing tolerance. REIL proteins also were implicated in plant-specific processes: nonacclimated reil1-1 reil2-1 exhibited cold-acclimation responses, including activation of the DREB/CBF regulon. In addition, acclimated reil1-1 reil2-1 plants failed to activate FLOWERING LOCUS T expression in mature leaves. Therefore, in the wild type, REIL function may contribute to temperature perception by suppressing premature cold responses during growth at nonstressful temperatures. In conclusion, we suggest that Arabidopsis REIL proteins influence cold-induced plant ribosome remodeling and enhance the accumulation of cytosolic ribosome subunits after cold shift either by de novo synthesis or by recycling them from the translating ribosome fraction.


Figures

Figure 1.
Figure 1.
Developmental phenotypes of the reil1-1 reil2-1 mutant under standard and suboptimal temperature regimes. reil1-1 reil2-1 and Arabidopsis Col-0 wild-type plants were compared under constant temperature and temperature-shift regimes. A, Constant standard temperature conditions at 20°C/18°C (day/night). Mutant and wild-type plants reached vegetative developmental stage ∼1.10 (Boyes et al., 2001) approximately 4 weeks after transfer to soil. Note that the mutant had a mild pointed-leaves phenotype (Van Lijsebettens et al., 1994; Horiguchi et al., 2012). B, Constant low-temperature conditions at 10°C/8°C (day/night). Mutant plants survived at least 13 weeks after germination and transfer to soil but remained extremely dwarfed, with final rosette diameters less than 1 cm and only five to seven visible leaves. C, Temperature shift from the 20°C to the 10°C regime. In contrast to the acclimating wild type, growth and development of the mutant were arrested. Mutant plants survived at least 13 weeks at low temperatures. D, Temperature shift from the 20°C to a 4°C/4°C (day/night) regime. Mutant plants and the wild type were growth arrested. Mutant survival was not tested. E, Inverse temperature shift from the 10°C to the 20°C regime. In contrast to the deacclimated wild type, mutant plants entered a rapid flowering program reminiscent of stress-induced early flowering (Xu et al., 2014). Temperature shifts in C and D were performed at developmental stage ∼1.10 of wild-type and mutant plants at the stages shown in A at week 0. Note that plant age is given by week prior to or post developmental stage ∼1.10. Plants were germinated under sterile conditions (Schmidt et al., 2013) and transferred to soil at stage 1.02-1.03 (i.e. at −6 weeks [10°C] or −4 weeks [20°C]). The inverse temperature shift from 10°C to 20°C (E) was performed when the wild type reached stage ∼1.10 at 10°C. Cocultivated mutant plants had stage 1.02-1.03. Arrowheads within the experimental schemes indicate the time at which representative photographs of n ≥ 10 plants per experiment were taken. Bars = 1 cm.
Figure 2.
Figure 2.
Morphometric and electrolyte leakage assays of reil1-1 reil2-1 at low temperatures. reil1-1 reil2-1 and Arabidopsis Col-0 wild-type plants were compared after the shift from 20°C to either 10°C (left) or 4°C (right). A, Leaf number. Mutant and wild-type plants differed significantly after 2 weeks at either 10°C or 4°C (*, P < 0.05; means ± sd of n = 3–10 plants). B, Rosette area. Mutant and wild-type plants differed significantly after 2 weeks at either 10°C or 4°C (*, P < 0.05; means ± sd of n = 3–10 plants). C, Electrolyte leakage assay for the quantitative assessment of freezing tolerance (LT50, temperature of 50% normalized electrolyte leakage). The mutant did not show increased electrolyte leakage compared with Col-0 (*, P < 0.05; means ± se of n = 4–8 pools of leaves; n.d., not determined). Experimental designs were according to schemes C and D in Figure 1. Mutant and wild-type plants were shifted at developmental stage ∼1.10 (Boyes et al., 2001). Week-0 plants were cultivated at 20°C and assayed immediately before the temperature shift. Significance was tested using the heteroscedastic Student’s t test.
Figure 3.
Figure 3.
Constitutive expression of GFP-REIL and RFP-REIL fusion proteins under the control of the UBQ10 promoter in reil1-1 reil2-1 restores single mutant morphology and development. Seedling development and vegetative rosette morphology of representative reil1-1 reil2-1 transformation events using the constructs UBQ10::GFP-REIL2 (b), UBQ10::RFP-REIL2 (c), UBQ10::GFP-REIL1 (e), and UBQ10::RFP-REIL1 (f) were compared with reil1-1 (a) and reil2-1 (d) plants. A, Seedlings after in vitro germination and cultivation at 10°C. Representative photographs of n ≥ 10 in vitro-grown plants per genotype were taken 30 d after imbibition (see C and D). B, Rosette plants after in vitro germination at 10°C and constant-temperature cultivation on soil at 10°C/8°C (day/night) according to cultivation scheme B in Figure 1. Representative photographs of n ≥ 10 plants per genotype were taken 6 to 7 weeks after transfer to soil. Racks of 6-cm-square pots were used. C, Appearance of the first juvenile rosette leaves after the introduction of REIL2 fusion proteins into reil1-1 reil2-1 (means ± sd of n = 4–5 plates per genotype; each plate had ∼80 seeds). D, Appearance of the first juvenile rosette leaves after the introduction of REIL1 fusion proteins into reil1-1 reil2-1 (means ± sd of n = 4–5 plates per genotype; each plate had ∼80 seeds). Leaf appearance was scored using the 10°C in vitro germination and cultivation assay described by Schmidt et al. (2013). The analysis included the reil1-1 reil2-1 mutant that is strongly delayed for the appearance and development of rosette leaves. Arrows indicate the absence of the first rosette leaf (compare with Fig. 1B), Arabidopsis Col-0 wild type (WT), and a nonfusion protein control, namely UBQ10::REIL2, transformed into reil1-1 reil2-1 (see C). The introduction of REIL1 restored reil2-1 morphology, and the introduction of REIL2 restored reil1-1 morphology. Note that reil1-1 morphology is virtually indistinguishable from that of the wild type (Schmidt et al., 2013).
Figure 4.
Figure 4.
Subcellular fluorescence localization of RFP-REIL fusion proteins. The UBQ10::RFP-REIL1 (49) and UBQ10::RFP-REIL2 (109) transformation events of reil1-1 reil2-1 that restored respective single mutant phenotypes (see Fig. 3) were analyzed using seedlings 7 to 10 d after germination at standard temperature (20°C) and after 1 d or more in the cold (10°C). A, Cotyledon epidermis of UBQ10::RFP-REIL1 (49) after in vitro germination and cultivation at 20°C. B, Root tip meristem to transition zone of UBQ10::RFP-REIL1 (49) after in vitro germination and cultivation at 20°C. C, Root tip of UBQ10::RFP-REIL1 (49) after in vitro germination at 20°C and cold shift. D, Cotyledon epidermis of UBQ10::RFP-REIL2 (109) after in vitro germination and cultivation at 20°C. E, Root tip of UBQ10::RFP-REIL2 (109) after in vitro germination and cultivation at 20°C. F, Root tip of UBQ10::RFP-REIL2 (109) after in vitro germination at 20°C and cold shift. Representative analyses include (left to right) false-color image of RFP fluorescence (green), Nomarski differential interference contrast image, and overlay including false-color image of chlorophyll autofluorescence (red). All images are projection stacks of multiple confocal sections. Note the absence of RFP-REIL1 fluorescent signal from vacuolar, chloroplast, and nuclear lumen (A–C). Bars = 25 µm.
Figure 5.
Figure 5.
Relative abundance of rRNAs within total RNA preparations and of 60S and 50S large ribosomal subunits from total ribosome preparations before and after the shift to 10°C. Complete reil1-1 reil2-1 rosettes were compared with wild-type (Col-0) rosettes in the nonacclimated state (i.e. at 0 d) and at 1, 7, and 21 d after transfer to the cold according to cultivation scheme C in Figure 1. A, Ratio of the cytosolic 25S large subunit rRNA relative to chloroplast 23S rRNA (P = 0.001). B, Ratio of the cytosolic small subunit 18S rRNA relative to chloroplast 16S rRNA (P = 0.003). C, Ratio of the cytosolic 25S large subunit rRNA and cytosolic 18S small subunit rRNA. For A to C, data are means ± se (n = 3–4 preparations from independent pools of mature rosette leaves). D, Representative sedimentation profiles of total ribosome preparations from ∼100 mg fresh weight of rosettes sampled at days 0, 1, and 7 of acclimation to 10°C. The sedimentation analysis was optimized for the separation of the 50S to 60S fractions. Indicated fractions were monitored by blank gradient subtracted absorbance (A254). Fraction identity was verified by rRNA analysis (Supplemental Fig. S3). E, Analysis of ribosome sedimentation profiles shown in D by calculating the normalized A254 abundance of the 60S and 50S fractions relative to the sum of all observed fractions (means ± se of n = 3 preparations from independent pools of mature rosette leaves). F, Ratio of the 60S fraction relative to the 50S fraction calculated from the data sets of E and F (means ± se of n = 3 preparations from independent pools of mature rosette leaves). The experimental design was according to scheme C in Figure 1. Mutant and wild-type plants were shifted at developmental stage ∼1.10. Nonacclimated rosettes were cultivated at 20°C and assayed immediately before the temperature shift. Peak areas of rRNA were determined from total RNA extracts by microfluidic electrophoresis. 23S rRNA was determined by the sum of two naturally occurring postmaturation cleavage products. For A to C, significance (P) of the time effect was tested by two-way ANOVA. For E and F, asterisks indicate significant changes of the mutant compared with the wild type (P < 0.05, heteroscedastic Student’s t test).
Figure 6.
Figure 6.
Western-blot analysis of Col-0 ribosome fractions. Ribosome protein fractions from the Col-0 wild type were compared with total protein preparations from Col-0 (WT) and reil2.1. All preparations were from rosette plants of stage ∼1.10 that were cultivated at 20°/18°C (day/night). A, Absorbance profile of the Suc density sedimentation gradient analysis at wavelength λ = 254 (A254) after blank gradient subtraction. Vertical lines indicate the approximate positions of the collected protein fractions. B, Western-blot analyses of the indicated fractions using anti-atREIL1.1 (top) and anti-RPL13B (bottom) antibodies. Note that anti-atREIL1.1 was directed against a variable region at the REIL1 C terminus. This antibody detects REIL1 in total protein extracts (black arrow) and cleavage products (gray arrows) in protein preparations after Suc density gradient centrifugation. Cleavage products also are detectable at low abundance in total protein from the reil2.1 mutant. The western-blot analysis was performed by three parallel-processed blots of fractions from the sedimentation gradient shown in A. The anti-RPL13B analyses were of an independent sedimentation gradient. Splice sites of blots are indicated by white bars.
Figure 7.
Figure 7.
Relative changes of leaf primary metabolites in the nonacclimated and the 10°C cold-acclimating reil1-1 reil2-1 mutant compared with the Col-0 wild type. A, Heat map of relative changes compared with nonacclimated Col-0 (*). Mean ratios were log2 transformed and color coded according to the scale at top (n = 6). Metabolites presented in C are indicated (x). Metabolites were arranged by hierarchical clustering using Euclidian distance and complete linkage. B, Principal component analysis of the data set shown in A. Col-0 in the nonacclimated state is indicated by an asterisk within the 0.00-h circle to the left. The gray arrow indicates the progressing metabolic changes of Col-0 in the course of cold acclimation. The black arrow indicates nonacclimated reil1-1 reil2-1. Time after the cold shift is coded by circle size. The 4-d annotation indicates the time point of reil1-1 reil2-1 divergence from the wild type. C, Comparative time course of selected metabolite pools normalized to nonacclimated Col-0 indicated by an asterisk within the 0.00-h circle to the left (means ± se; n = 6). Plants were precultivated at 20°C and shifted to 10°C conditions at developmental stage ∼1.10 according to scheme C in Figure 1. Samples were harvested immediately before (0.00 h) and following the cold shift. Cold shift and sampling time points at full days (d) or weeks (w), except samplings at 0.25 to 8 h, were at 6 h (±5 min) after dawn of a 14-h/10-h day/night cycle. Two independent experiments with three replicate samples each per time point were performed. Samples were pools of mature leaves from at least two plants. Metabolism was profiled by multitargeted gas chromatography-mass spectrometry (GC-MS)-based technology. Metabolites with significant changes compared with the wild type, changes in the course of cold acclimation, and significant interactions of both effects were selected by two-way ANOVA (P < 0.001; Supplemental Table S1).
Figure 8.
Figure 8.
Functional enrichment analysis of stress- and stimuli-related differential gene expression in reil1-1 reil2-1 at standard cultivation temperature compared with cold-acclimating Col-0 and reil1-1 reil2-1 at 1 d (1d), 1 week (1w), or 3 weeks (3w) after the shift to 10°C. Differential gene expression was determined relative to nonacclimated Col-0 at standard cultivation temperature. Z-scores, P values, and mean log2 fold changes (log2-FCs) of genes belonging to 1,940 GO terms were calculated (Du et al., 2010; Supplemental Table S4). A, Heat map of mean log2-FC of the top 10 significantly enriched 135 GO terms that represented responses to stimuli or abiotic and biotic stresses. Ranking was according to top positive or negative z-score values with mean log2-FC > +0.1 or < −0.1. GO terms are listed with ontology, description, and number of constituting genes. Boldface in the GO description indicates shared enrichment of the nonacclimated mutant (0 d) with the acclimating Col-0 at 1 d, 1 week, or 3 weeks. Two general stimuli- and stress-response GOs as well as the temperature, cold, heat response, water, drought, and osmotic stress-related GOs were added for comparison. All top-scoring GO terms were biological processes (P). B, Mean log2-FC of GO terms from the nonacclimated mutant (0 d) and acclimating Col-0 at 1 d, 1 week, and 3 weeks (from left to right). All 135 acclimation- and response-related GO terms were included. The inset data show the Pearson’s correlation coefficient (r2) and the slope of a linear regression (s). The arrows indicate GO:0009631, cold acclimation.
Figure 9.
Figure 9.
Differential expression of genes that were up-regulated in nonacclimated reil1-1 reil2-1 and changed significantly in 10°C cold-acclimating Col-0. A, DEGs (P < 0.01) in nonacclimated reil1-1 reil2-1 that belonged to GO term GO:0009631, cold acclimation. Note that these three genes also were part of GO:0009409, response to cold. B, Additional DEGs (P < 0.01 or P < 0.05) that belonged to GO term GO:0009409, response to cold. C, Selected genes that belonged to GO:0010286, heat acclimation. Note that DREB2A and DREB2B were increased slightly in the nonacclimated mutant and also part of the long-term Col-0 response to a 10°C shift (see Fig. 8). SKP2B was the only gene of GO:0010286, heat acclimation, that was significantly up-regulated at P < 0.01 in nonacclimated reil1-1 reil2-1. Relative expression values are log2-FCs (ratios) compared with nonacclimated Col-0 (means ± se). Headers show Arabidopsis gene names and gene codes in parentheses. Significance values of heteroscedastic Student’s t tests comparing nonacclimated mutant and nonacclimated Col-0 are indicated (*, 0.01 < P ≤ 0.05 and **, P ≤ 0.01). Circles in the top right corner of some graphs indicate that the respective genes also were part of the water limitation GO terms, GO:0009414 and GO:0009415.
Figure 10.
Figure 10.
Functional enrichment analysis of ribosome- and translation-related gene expression in reil1-1 reil2-1 compared with Col-0 in the nonacclimated state and after the shift to 10°C. A, Heat map of mean log2-FCs from structural ribosome- and translation-related GO terms and selected more specified subterms. reil1-1 reil2-1/Col-0 columns represent mean log2-FCs > +0.1 or < −0.1 of mutant expression ratios compared with Col-0 in the nonacclimated state (0 d) and at the time points after the shift to 10°C, 1 d (1d), 1 week (1w), and 3 weeks (3w). Log2-FCs with significant positive or negative enrichment (i.e. z-score values > 2.5) are indicated by asterisks. Columns reil1-1 reil2-1 and Col-0 at 0d, 1d, 1w, and 3w represent mean log2-FC of expression ratios relative to nonacclimated Col-0. Information was extracted from mean log2-FCs, z-scores, and P values of a differential gene expression enrichment analysis covering genes belonging to 1,940 GO terms (Du et al., 2010; Supplemental Table S4). B, Mean log2-FC (±se) of cytosolic and chloroplast structural genes as defined by MapMan/PageMan functional bin annotations (Thimm et al., 2004; Usadel et al., 2006). Gray bars in each left subgraph are expression ratios of reil1-1 reil2-1/Col-0 at each given time point. Black and white bars in the right subgraphs represent the ratios relative to nonacclimated Col-0 (black triangles).
Figure 11.
Figure 11.
Selected differentially expressed flowering-related genes of nonacclimated (0 d) and 10°C cold-acclimating reil1-1 reil2-1 at 1 d (1d), 1 week (1w), or 3 weeks (3w) after the shift to 10°C. Relative expression values are mean log2-FC (±se). Gray bars in each left subgraph are expression ratios of reil1-1 reil2-1/Col-0 at the given time points. Black and white bars in the right subgraph represent the ratios relative to nonacclimated Col-0 (black triangles). *, 0.01 < P ≤ 0.05; **, 0.001 < P ≤ 0.01; and ***, P ≤ 0.001, by heteroscedastic Student’s t tests.
Figure 12.
Figure 12.
Functional interaction model that summarizes our insights into the role of REIL proteins in mature leaves before (20°/18°C, day/night) and after the shift to low-temperature conditions (10°/8°C). Bars = 1 cm.

Similar articles

Cited by

References

    1. Ascenzi R, Gantt JS (1999) Molecular genetic analysis of the drought-inducible linker histone variant in Arabidopsis thaliana. Plant Mol Biol 41: 159–169 - PubMed
    1. Barakat A, Szick-Miranda K, Chang IF, Guyot R, Blanc G, Cooke R, Delseny M, Bailey-Serres J (2001) The organization of cytoplasmic ribosomal protein genes in the Arabidopsis genome. Plant Physiol 127: 398–415 - PMC - PubMed
    1. Basu U, Si K, Warner JR, Maitra U (2001) The Saccharomyces cerevisiae TIF6 gene encoding translation initiation factor 6 is required for 60S ribosomal subunit biogenesis. Mol Cell Biol 21: 1453–1462 - PMC - PubMed
    1. Bent AF. (2000) Arabidopsis in planta transformation: uses, mechanisms, and prospects for transformation of other species. Plant Physiol 124: 1540–1547 - PMC - PubMed
    1. Boyes DC, Zayed AM, Ascenzi R, McCaskill AJ, Hoffman NE, Davis KR, Görlach J (2001) Growth stage-based phenotypic analysis of Arabidopsis: a model for high throughput functional genomics in plants. Plant Cell 13: 1499–1510 - PMC - PubMed

Publication types

MeSH terms