. 2018 Apr 15;78(8):2096-2114.
doi: 10.1158/0008-5472.CAN-17-2870. Epub 2018 Jan 30.

Discovery of Potent and Selective MRCK Inhibitors with Therapeutic Effect on Skin Cancer

Affiliations

Discovery of Potent and Selective MRCK Inhibitors with Therapeutic Effect on Skin Cancer

Mathieu Unbekandt et al. Cancer Res. .

Abstract

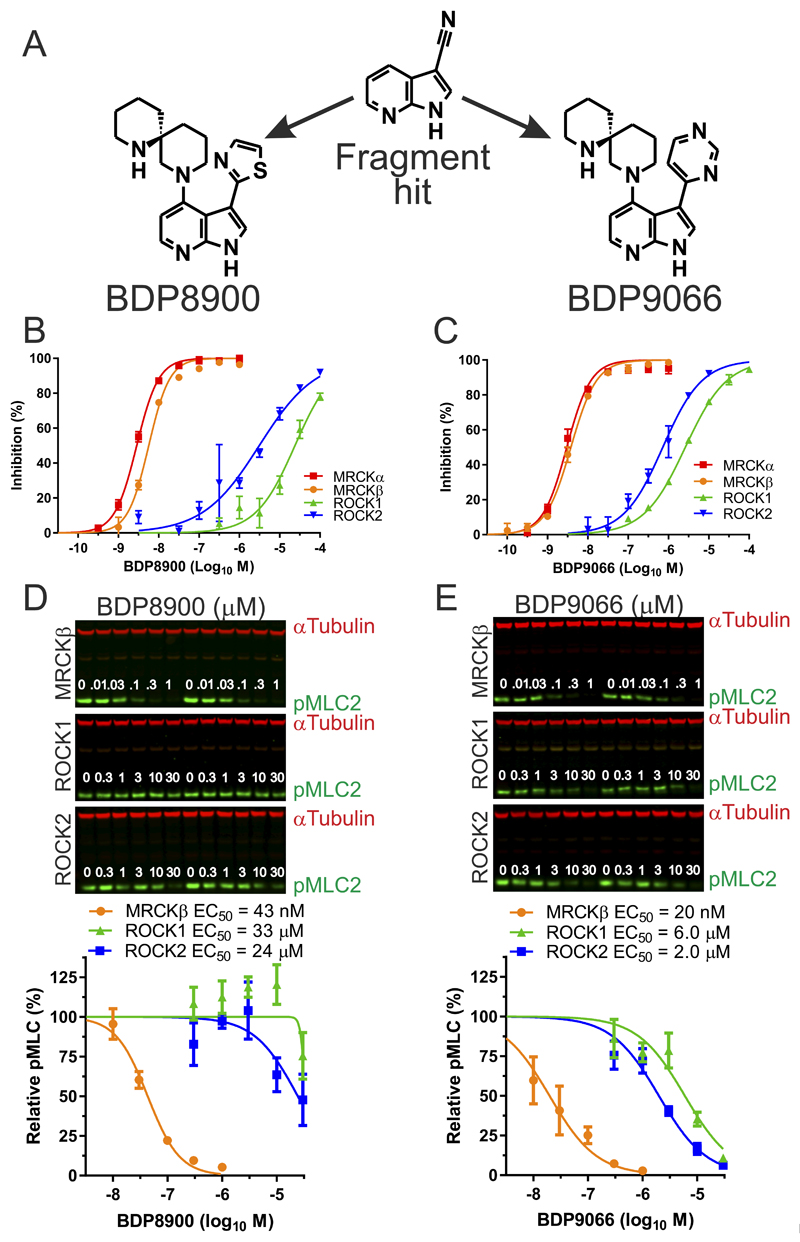
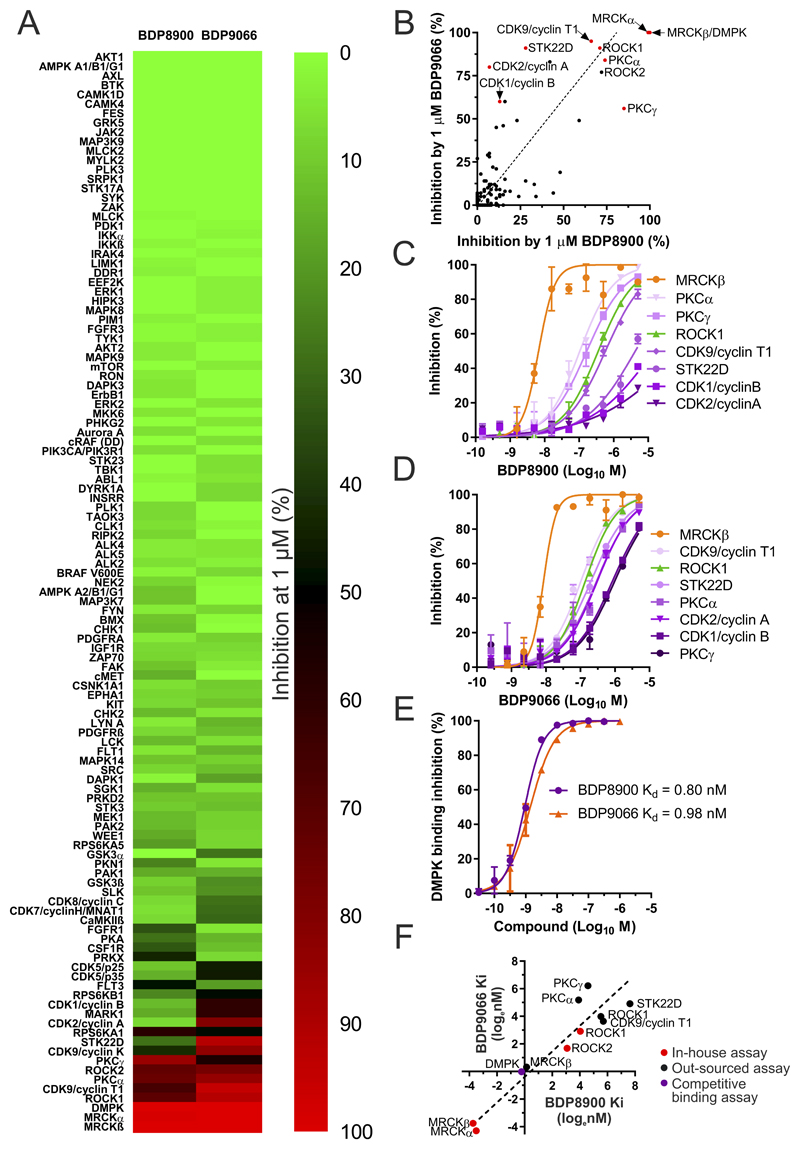
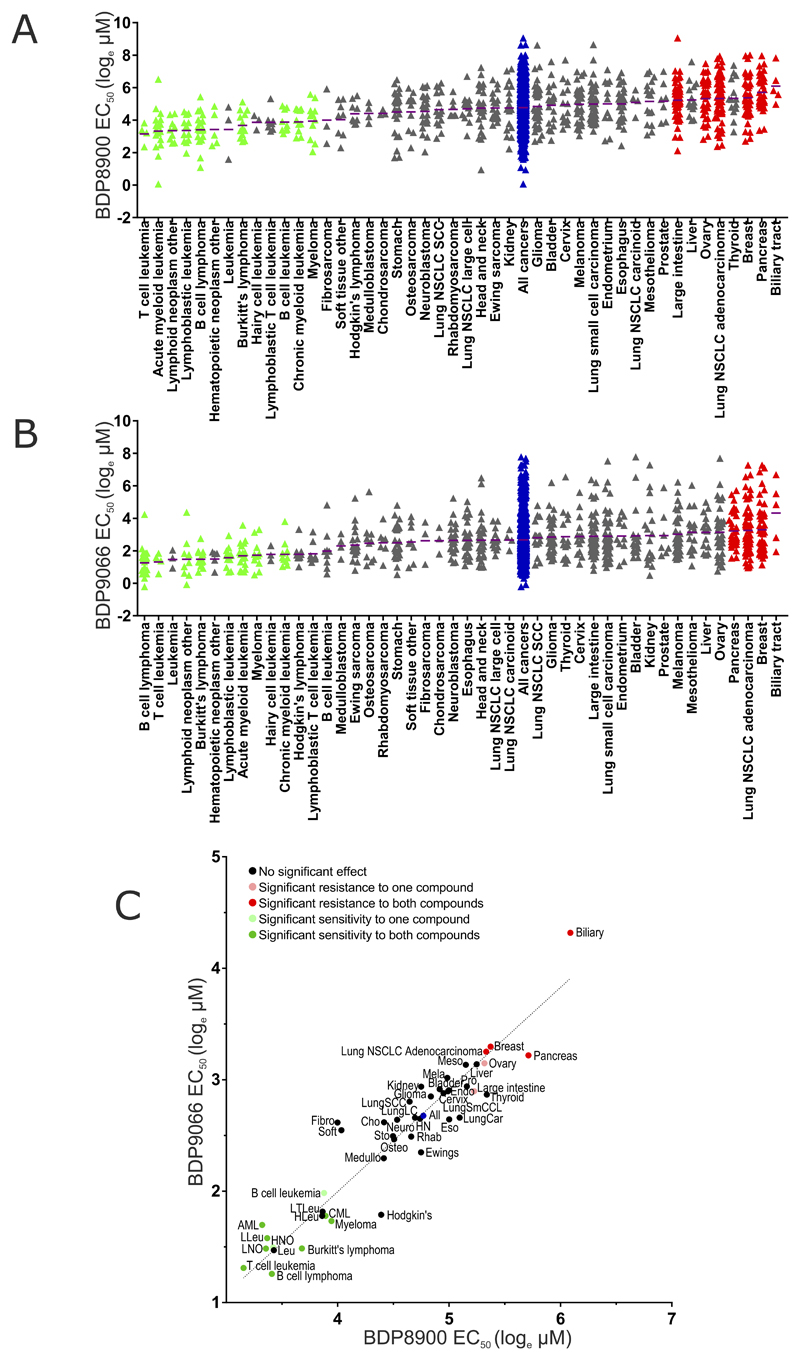
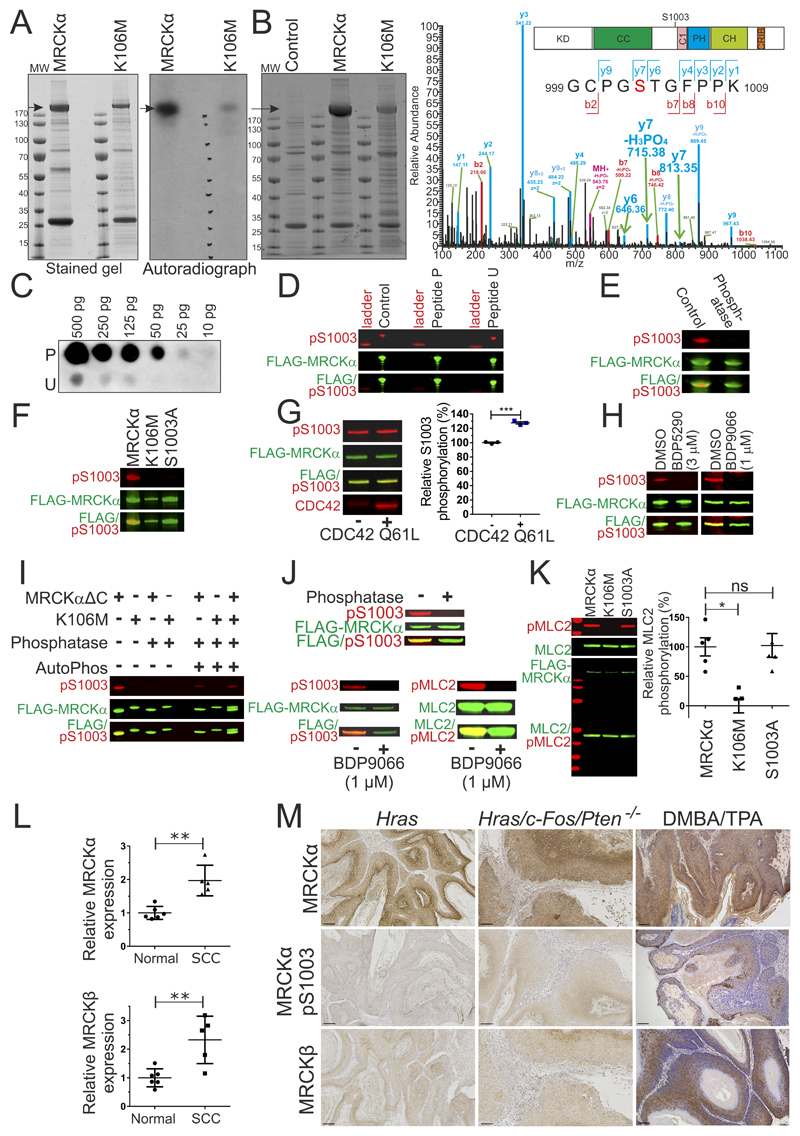
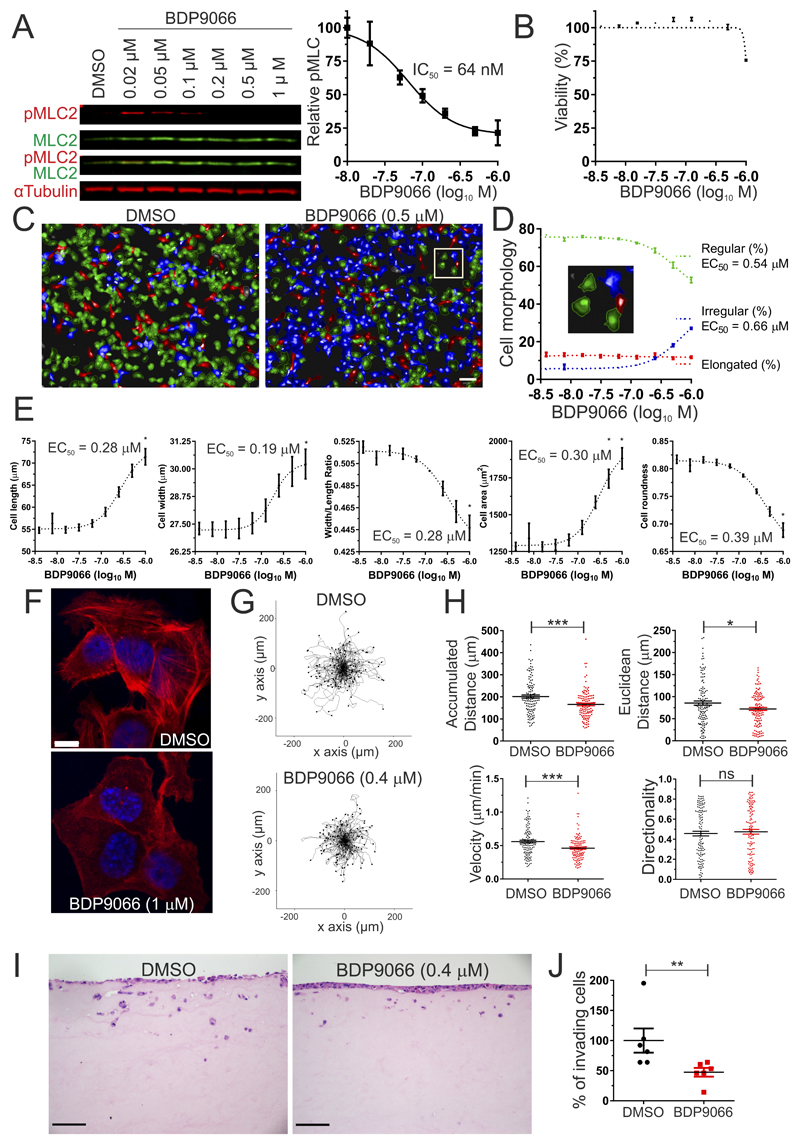
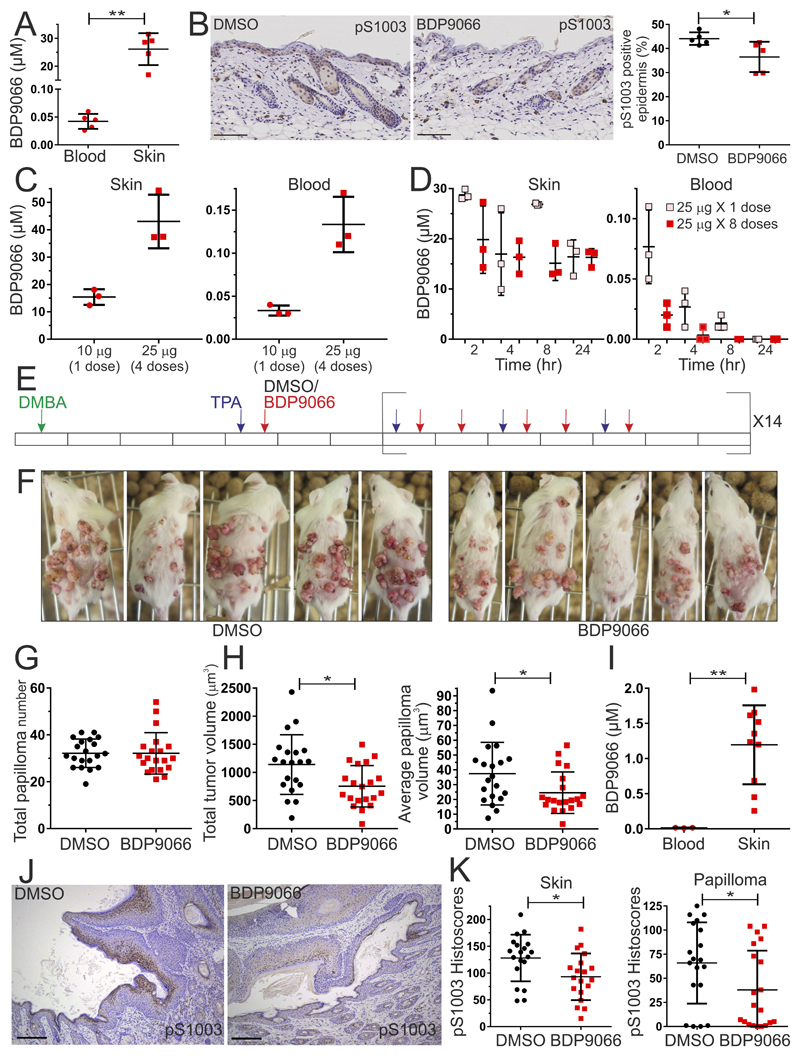
The myotonic dystrophy-related Cdc42-binding kinases MRCKα and MRCKβ contribute to the regulation of actin-myosin cytoskeleton organization and dynamics, acting in concert with the Rho-associated coiled-coil kinases ROCK1 and ROCK2. The absence of highly potent and selective MRCK inhibitors has resulted in relatively little knowledge of the potential roles of these kinases in cancer. Here, we report the discovery of the azaindole compounds BDP8900 and BDP9066 as potent and selective MRCK inhibitors that reduce substrate phosphorylation, leading to morphologic changes in cancer cells along with inhibition of their motility and invasive character. In over 750 human cancer cell lines tested, BDP8900 and BDP9066 displayed consistent antiproliferative effects with greatest activity in hematologic cancer cells. Mass spectrometry identified MRCKα S1003 as an autophosphorylation site, enabling development of a phosphorylation-sensitive antibody tool to report on MRCKα status in tumor specimens. In a two-stage chemical carcinogenesis model of murine squamous cell carcinoma, topical treatments reduced MRCKα S1003 autophosphorylation and skin papilloma outgrowth. In parallel work, we validated a phospho-selective antibody with the capability to monitor drug pharmacodynamics. Taken together, our findings establish an important oncogenic role for MRCK in cancer, and they offer an initial preclinical proof of concept for MRCK inhibition as a valid therapeutic strategy.Significance: The development of selective small-molecule inhibitors of the Cdc42-binding MRCK kinases reveals their essential roles in cancer cell viability, migration, and invasive character. Cancer Res; 78(8); 2096-114. ©2018 AACR.


Conflict of interest statement

Competing interests

No potential conflicts of interest were disclosed by the authors.

Figures

Figure 1
Figure 1. Inhibition of MRCK activity in vitro and in cells by BDP8900 and BDP9066.
(A) Structures of 7-azaindole-3-carbonitrile hit fragment, BD8900 and BDP9066. (B) BDP8900 dose-response curves for inhibition of MRCKα, MRCKβ, ROCK1 and ROCK2 kinase activity in vitro at 1 µM ATP. (C) BDP9066 dose-response curves for inhibition of MRCKα, MRCKβ, ROCK1 and ROCK2 kinase activity in vitro at 1 µM ATP. Results shown are mean ± SD of duplicate independent replicates. (D) Cells expressing doxycycline-induced MRCKβ, ROCK1 or ROCK2 kinase domains were treated with BDP8900 at indicated concentrations for 60 minutes prior to lysis and quantitative western blotting. Inhibition of MLC2 phosphorylation by BDP8900 for each induced kinase domain. Results shown are mean ± SEM of 3-4 independent replicates. (E) Cells expressing doxycycline-induced MRCKβ, ROCK1 or ROCK2 kinase domains were treated with BDP9066 at indicated concentrations for 60 minutes prior to lysis and quantitative western blotting. Inhibition of MLC2 phosphorylation by BDP8900 for each induced kinase domain. Results shown are mean ± SEM of 3-4 independent replicates.
Figure 2
Figure 2. Detailed selectivity profiles for BDP8900 and BDP9066.
(A) Percentage kinase inhibition by 1 µM BDP8900 and BDP9066 were ranked and displayed by heat map. (B) Plot of inhibition by BDP8900 and BDP9066, kinases selected for detailed dose-response analysis indicated with red dot. ROCK1 was selected to additionally represent ROCK2 (black dot). Dotted line represents Deming regression (slope deviation from zero, p<0.0001). (C) BDP8900 dose-response curves for inhibition of indicated kinases in vitro. Results shown are mean ± SD of duplicate independent replicates. (D) BDP9066 dose-response curves for inhibition of indicated kinases in vitro. Results shown are mean ± SD of duplicate independent replicates. (E) BDP8900 and BDP9066 dose-response curves for competitive inhibition of tracer binding to DMPK in vitro, with calculated Kd values. Results shown are mean ± SD of duplicate independent replicates. (F) Natural log Ki or Kd (nM) values of BDP8099 and BDP9066 determined using in-house optimized assay conditions (red dots), by outsourced assays (black dots) or competition binding assay (purple dot). Dashed line represents Deming regression (slope deviation from zero, p<0.0001).
Figure 3
Figure 3. Structure of MRCKβ in complex with BDP8900 and BDP9066.
(A) BDP8900 or (B) BDP9066 bound to the MRCKβ ATP-binding site in stereo views. Protein residues (grey) are labelled with the single-letter amino acid code and residue number, selected water molecules are indicated by red spheres. Ligands are shown in purple with σA-weighted |Fo|-|Fc|,ϕc electron density maps calculated prior to the initial inclusion of the ligand in refinement contoured at 3.0σ (dark blue). Potential hydrogen bonds are highlighted by dotted black lines. (C) Detailed view of the BDP9066 spiro moiety. The ligand is shown in cyan with a semitransparent surface. (D) Comparison of the binding modes of BDP9066 (cyan) and BDP5290 (blue, PDB ID 4UAL). Protein residues, pocket waters and potential hydrogen bonds are shown as before and colored to match the ligand.
Figure 4
Figure 4. Evaluation of cancer cell line sensitivities to MRCK inhibitors.
(A) Cancer cell lines (n = 757), divided into 45 cancer types, were treated with 7 concentrations of a half-log dilution series of BDP8900 (top concentration = 10 μM). After 72 hours, cell density was measured, EC50 values calculated and MANOVA performed to identify cancer types significantly (p<0.05) sensitive (green triangles) or resistant (red triangles) to BDP8900 relative to all cancers (blue triangles) considered together. Purple lines indicate mean EC50 for each cancer type. (B) Sensitivity or resistance to BDP9066 was determined as described above. Cancer types significantly (p<0.05) sensitive (red triangles) or resistant (red triangles) from all cancers (blue triangles) are indicated. (Abbreviations: NSCLC, Non-small cell lung cancer; SCC, Squamous cell carcinoma). (C) Mean EC50 values for each cancer type to BDP8900 and BDP9066 were plotted, dark green dots indicate cancer types significantly sensitive to both inhibitors, light green dots indicate significant sensitivity to one inhibitor, dark red dots indicate significant resistance to both inhibitors, pink dots indicate significant resistance to one inhibitor (all p<0.05), relative to all cancers (bleu dot). Deming regression indicates that the there is a significant (p<0.0001) relationship between the responses of cancer types to both drugs. (Abbreviations for sensitive cancer types: AML, Acute myeloid leukemia; CML, Chronic myeloid leukemia; HNO, Hematopoietic neoplasm other; LLeu, Lymphoblastic leukemia; LNO, Lymphoid neoplasm other).
Figure 5
Figure 5. MRCKα S1003 autophosphorylation as a biomarker of activity.
(A) Stained SDS-PAGE gel (left) of FLAG immunoprecipitated FLAG-MRCKα and FLAG-MRCKα K106M after in vitro 32P incorporation assay. Arrow indicates MRCKα. Gel autoradiograph (right) shows 32P labelling of MRCKα. MW = molecular weight. (B). Stained SDS-PAGE gel (left) of FLAG-immunoprecipitates from control HEK293 cells, or cells transfected with pEF-FLAG-MRCKα or pEF-FLAG-MRCKα K106M. Arrow indicates MRCKα. MW = molecular weight. Higher energy collision dissociation (HCD) MS/MS fragmentation spectra (right) of MRCKα tryptic peptide 999-1009 containing S1003 (red lettering) in MRCKα or MRCKα K106M (phosphorylation inferred from y7, y7-H3PO4 and y6 signals indicated with green arrows). See Supplemental Table 8 for theoretical y and b fragmentation ion series masses. Diagram of MRCKα protein domains (inset) illustrating location of S1003. (KD = kinase domain, CC = Coiled-coiled domain, C1 = C1 diacylglycerol binding domain, PH = Pleckstrin homology domain, CH = Citron Homology domain, CRIB = Cdc42/Rac interactive binding motif). (C). Dot blot of MRCKα peptides (10 to 500 pg) containing phosphorylated S1003 (peptide P) or unphosphorylated S1003 (peptide U), stained with pS1003 antibody (D). Western blots of FLAG-immunoprecipitated FLAG-MRCKα stained with untreated pS1003 antibody, or pS1003 antibody pre-incubated with phosphorylated S1003 peptide P or unphosphorylated peptide U (E). Western blots of FLAG-immunoprecipitated FLAG-MRCKα, incubated in phosphatase buffer without (control) or with lambda phosphatase (phosphatase) (F). Western blot of FLAG-immunoprecipitated FLAG-MRCKα, FLAG-MRCKα K106M or FLAG-MRCKα S1003A. (G). Western blot (left) of FLAG-immunoprecipitated FLAG-MRCKα incubated in kinase buffer in the absence or presence of recombinant CDC42 Q61L protein. Relative S1003 phosphorylation revealed that CDC42 significantly increased autophosphorylation. Results shown are means ± SEM from 3 experiments. Student’s t-test (*** = p<0.001). (H). Western blots of HEK293 cells expressing FLAG-MRCKα treated with DMSO, 3 µM BDP5290 or 1 µM BDP9066 (I). Western blots of FLAG immunoprecipitated FLAG-MRCKαΔC or FLAG-MRCKα K106M untreated or treated with lambda phosphatase, or treated with lambda phosphatase and then incubated in kinase buffer to allow autophosphorylation (AutoPhos). (J) Western blots of FLAG-immunoprecipitated FLAG-MRCKα, untreated or treated with lambda phosphatase (upper panel). Incubation with kinase buffer resulted in autophosphorylation (pS1003; lower left panel) and recombinant MLC2 substrate phosphorylation (pMLC2; lower right panel) (K). Western blots of FLAG-immunoprecipitated FLAG-MRCKα, FLAG-MRCKα K106M or FLAG-MRCKα S1003A incubated in vitro with recombinant MLC2 in a kinase buffer (left). Relative MLC2 phosphorylation by each kinase revealed that K106M significantly reduced activity, while S1003A was not different from wild-type. Results shown are means ± SEM from 5 independent experiments. One way Kruskal-Wallis ANOVA followed by post-hoc Dunn’s multiple comparison (* = p<0.05). (L) Relative MRCKα (upper) and MRCKβ (lower) expression was significantly higher in cutaneous SCC relative to normal human skin determined by microarray analysis (45). Results shown are means ± SD from 6 normal skin and 5 SCC patients. Two-tailed Mann-Whitney test of significance (** = p<0.01). (M) Immunohistochemistry of MRCKα, MRCKα pS1003 or MRCKβ in benign papillomas from mice expressing oncogenic Hras in epidermal keratinocytes, or in well-differentiated squamous cell carcinomas resulting from Hras/c-Fos/Pten-/- genetic modifications or DMBA/TPA chemical carcinogenesis. Scale bars = 100 µm.
Figure 6
Figure 6. BDP9066 affects MLC2 phosphorylation, morphology, migration and invasion of human SCC12 squamous cell carcinoma.
(A) Western blots (left) showing dose dependent inhibition (right) of MLC2 phosphorylation by BDP9066 in SCC12 cells. Results shown are means ± SEM from 3 independent replicates. (B). SCC12 viability as a function of BDP9066 concentration after 24 hours treatment. Results shown are means ± SEM from 3 independent replicates. (C). High content analysis of SCC12 morphology following treatment with DMSO vehicle or 0.5 µM BDP9066 for 2 hours. Multiparametric analysis was used to define regular (green), elongated (red) and irregular (blue) SCC12 cell morphologies. Scale bar represents 100 µm. (D) Percentages of each SCC12 cell shape as functions of BDP9066 concentration after 2 hours treatment. Results shown are means ± SEM from 3 independent replicates. (E) Individual SCC12 cell morphology parameters (cell length, cell width, width/length ratio, cell area, cell roundness) as functions of BDP9066 concentration after 2 hours treatment. Results shown are means ± SEM from 3 independent replicates. (F). Representative images of phalloidin-stained filamentous actin structures in SCC12 cells treated with DMSO or 1 μM BDP9066 for ~18 hours. Scale bar = 10 µm. (G). Tracks of SCC12 cell migration (120 cells) treated with DMSO (left) or 0.4 μM BDP9066 (right) over 6 hours. Each line represents the path of a single cell from the origin, with final position indicated by a dot. (H). Accumulated distance, Euclidean distance, velocity and directionality of SCC12 cells treated with DMSO or 0.4 μM BDP9066 for each tracked cell over 6 hours. Results shown are means ± SEM from 120 individual cells. Two tailed unpaired t-tests were used to determine significance (* = p<0.05, *** = p<0.001). (I). Representative images of organotypic invasion by SCC12 cells cultured with medium supplemented with DMSO (left) or 0.4 μM BDP9066 (right). Scale bars represent 100 µm. (J). Percentage of invading SCC12 cells in organotypic invasion assays following treatment with DMSO or 0.4 μM BDP9066. Results shown are means ± SEM from 6 independent replicates. Two-tailed Mann-Whitney test of significance (** = p<0.01).
Figure 7
Figure 7. In vivo application of BDP9066 in a DMBA/TPA mouse model of SCC.
(A) Topical application of 4 X 25 µg BDP9066 over 2 days to dorsal skin led to measurable drug levels in the skin that were significantly higher than in blood. Results shown are means ± SD from 5 independent mice, each indicated by a data point. Two-tailed Mann-Whitney test of significance (** = p<0.01). (B) Representative MRCKα pS1003 immunohistochemical staining of mouse skin sections (left) topically treated with DMSO or 4 X 25 µg BDP9066 over 2 days. Scale bars represent 100 µm. Topical administration of BDP9066 (red dots) led to significant reduction in positive epidermal staining for MRCKα pS1003 (right). Results shown are means ± SD from 5 independent mice per condition, each indicated by a data point. Two-tailed Mann-Whitney test of significance (* = p<0.05). (C). Skin (left) or blood (right) BDP9066 concentrations following topical administration of a single 10 µg dose or 4 X 25 µg doses of BDP9066 over 2 days. Results shown are means ± SD from 3 independent mice per condition, each indicated by a data point. (D) Skin (left) or blood (right) BDP9066 concentrations following topical administration of a single 25 µg dose (pink dots) or 8 X 25 µg doses of BDP9066 (red dots; 4 days on, 2 days off, 4 days on) at indicated times after final administration. Results shown are means ± SD from 3 independent mice per condition, each indicated by a data point. (E) Timeline of DMBA (green arrow), TPA (purple arrow), DMSO (black arrow) or BDP9066 (red arrow) administration, with each day represented by a rectangle. (F) Representative images of cagemate DMBA/TPA treated mice with topical application of DMSO or BDP9066 as indicated. (G) Total endpoint papilloma numbers per mouse. Results shown are means ± SD from 20 independent mice per condition, each indicated by a data point. (H) Total tumor volume (left) and average papilloma volume (right) per mouse. Results shown are means ± SD from 20 independent mice per condition, each indicated by a data point. Two tailed unpaired t-tests were used to determine significance (* = p<0.05). (I) Blood and skin BDP9066 concentrations at endpoint. Results shown are means ± SD from 3 independent mice for blood and 10 mice for skin, each indicated by a data point. Two-tailed Mann-Whitney test of significance (** = p<0.001). (J) Representative MRCKα pS1003 staining of DMBA/TPA skin sections treated topically with DMSO or BDP9066. Scale bars represent 100 µm. (K). Cytoplasmic histoscores of MRCKα pS1003 staining of DMBA/TPA treated skin (left) or papilloma (right) sections that had been administered DMSO (black dots) or BDP9066 (red dots). Results shown are means ± SD from 19 independent mice per condition, each indicated by a data point. Two tailed unpaired t-tests were used to determine significance (* = p<0.05).

Similar articles

Cited by

References

    1. Hall A. The cytoskeleton and cancer. Cancer Metastasis Rev. 2009;28:5–14. - PubMed
    1. Mardilovich K, Olson MF, Baugh M. Targeting Rho GTPase signaling for cancer therapy. Future Oncol. 2012;8:165–77. - PubMed
    1. Heissler SM, Sellers JR. Various Themes of Myosin Regulation. J Mol Biol. 2016;428:1927–46. - PMC - PubMed
    1. Julian L, Olson MF. Rho-associated coiled-coil containing kinases (ROCK) Small GTPases. 2014;5:e29846. - PMC - PubMed
    1. Olson MF. Rho GTPases, their post-translational modifications, disease-associated mutations and pharmacological inhibitors. Small GTPases. 2016 doi: 10.1080/21541248.2016.1218407. - DOI - PMC - PubMed

Publication types

MeSH terms