. 2018 Apr 15;78(8):2127-2139.
doi: 10.1158/0008-5472.CAN-17-2649. Epub 2018 Jan 30.

Spatial Heterogeneity and Evolutionary Dynamics Modulate Time to Recurrence in Continuous and Adaptive Cancer Therapies

Affiliations

Spatial Heterogeneity and Evolutionary Dynamics Modulate Time to Recurrence in Continuous and Adaptive Cancer Therapies

Jill A Gallaher et al. Cancer Res. .

Abstract

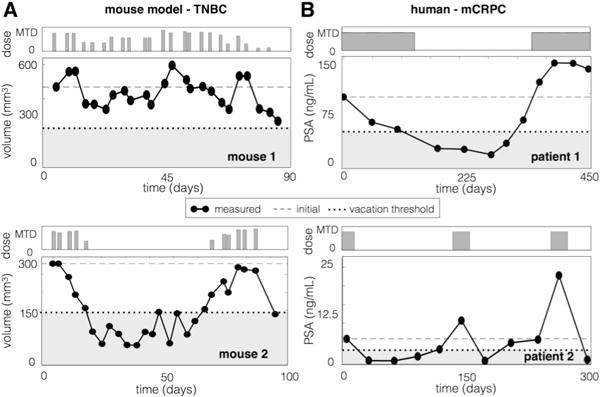
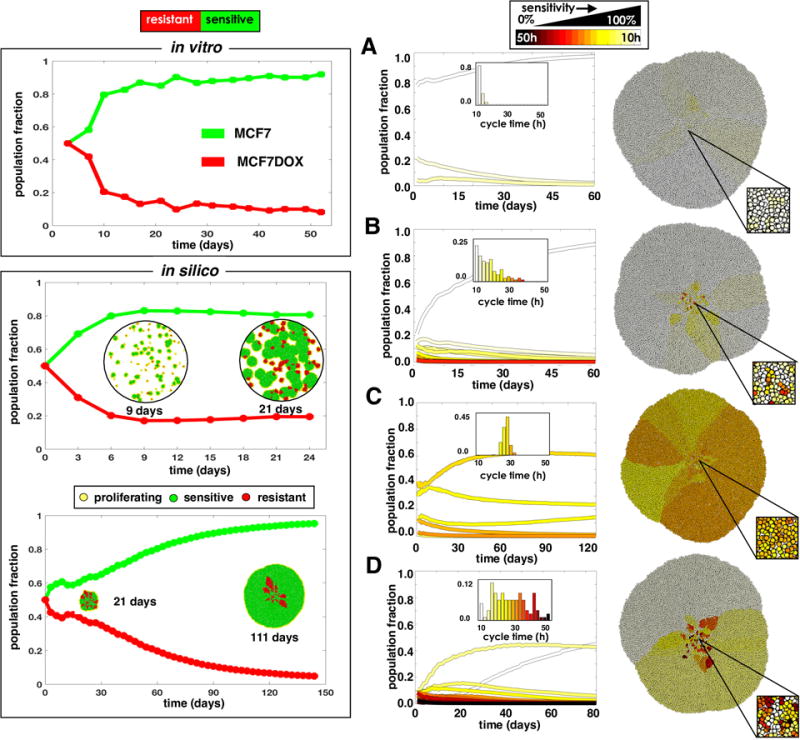
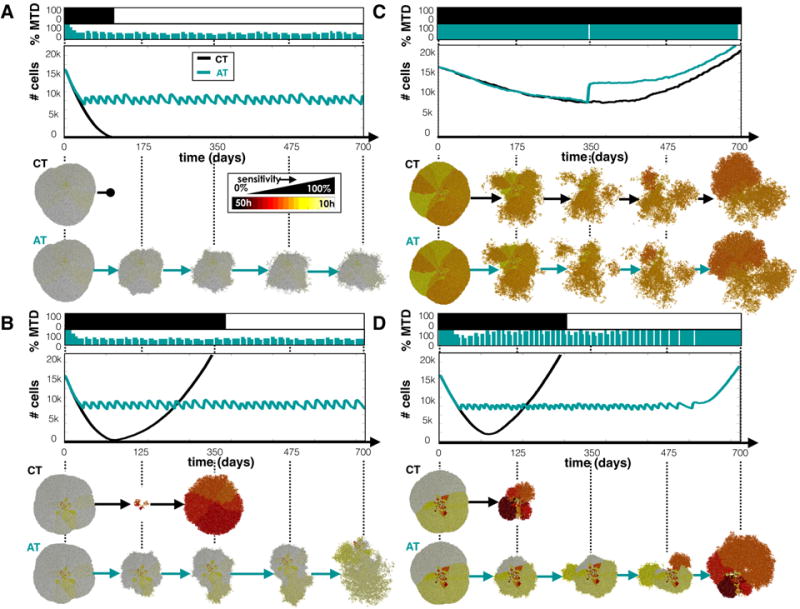
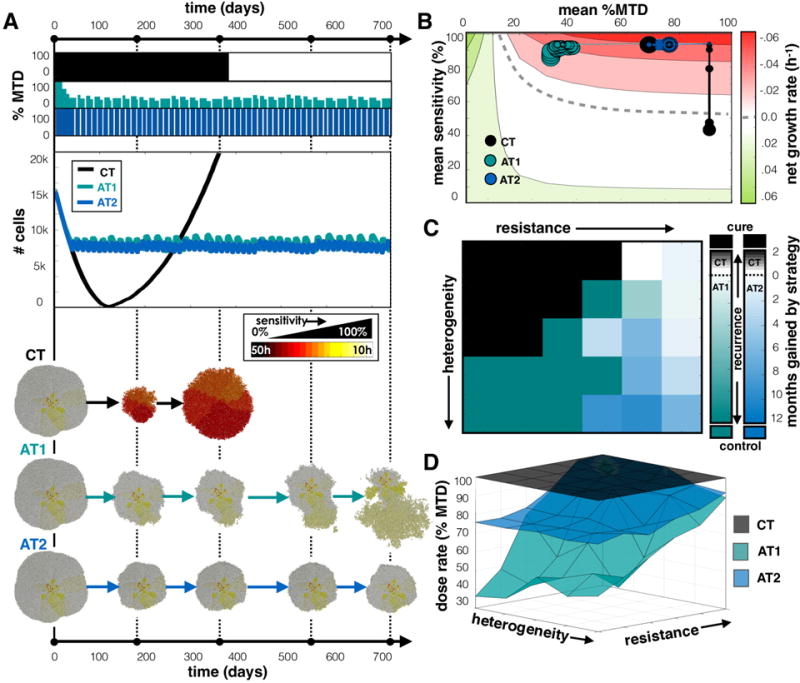
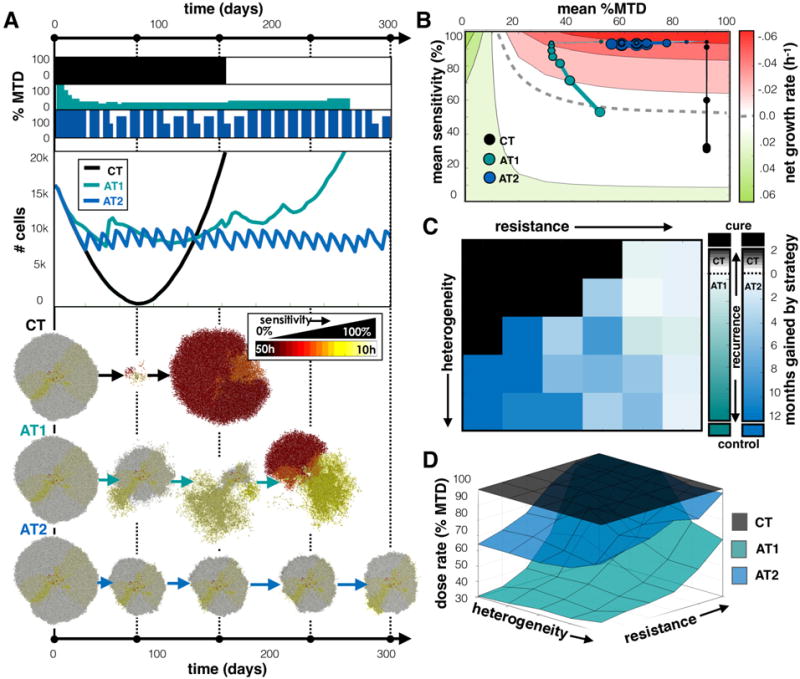
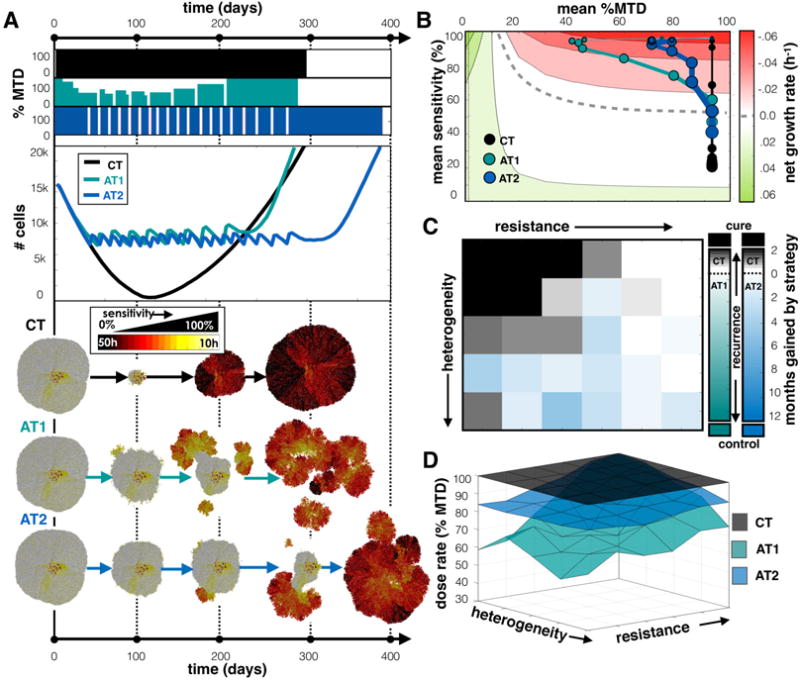
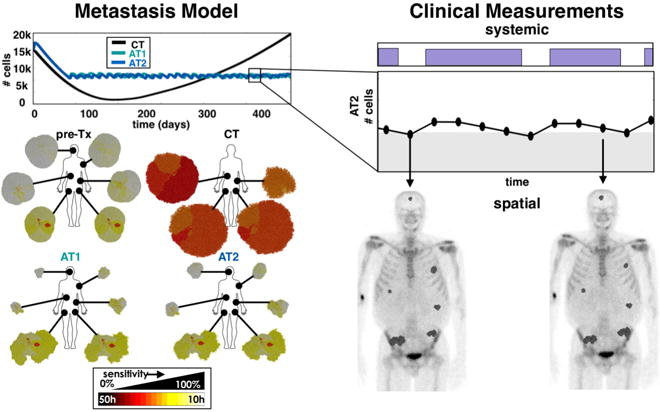
Treatment of advanced cancers has benefited from new agents that supplement or bypass conventional therapies. However, even effective therapies fail as cancer cells deploy a wide range of resistance strategies. We propose that evolutionary dynamics ultimately determine survival and proliferation of resistant cells. Therefore, evolutionary strategies should be used with conventional therapies to delay or prevent resistance. Using an agent-based framework to model spatial competition among sensitive and resistant populations, we applied antiproliferative drug treatments to varying ratios of sensitive and resistant cells. We compared a continuous maximum-tolerated dose schedule with an adaptive schedule aimed at tumor control via competition between sensitive and resistant cells. Continuous treatment cured mostly sensitive tumors, but with any resistant cells, recurrence was inevitable. We identified two adaptive strategies that control heterogeneous tumors: dose modulation controls most tumors with less drug, while a more vacation-oriented schedule can control more invasive tumors. These findings offer potential modifications to treatment regimens that may improve outcomes and reduce resistance and recurrence.Significance: By using drug dose modulation or treatment vacations, adaptive therapy strategies control the emergence of tumor drug resistance by spatially suppressing less fit resistant populations in favor of treatment sensitive ones. Cancer Res; 78(8); 2127-39. ©2018 AACR.


Conflict of interest statement

Authors report no conflicts of interest.

Figures

Figure 1
Figure 1
Adaptive therapy in the laboratory and the clinic. A) Mice implanted with triple negative human breast cancer were treated with adaptive paclitaxel treatment. If the volume dips below 150 mm3, a treatment vacation occurs, if there is a 20% tumor volume decrease (or increase), there is a 50% dose decrease (or increase), and otherwise the dose remains the same (see (10) for details). B) Patients with metastatic castrate resistant prostate cancer are treated with abiraterone such that treatment is stopped if PSA falls below 50% of the original and resumes when the PSA exceeds the original value.
Figure 2
Figure 2
Competition between sensitive and resistant cells using in vitro and in silico models. Binary sensitive and resistant populations (left) and populations with a spectrum of sensitivity (right) are considered. Top left: Cells sensitive (MCF7) and resistant (MCF7Dox) to doxorubicin are co-cultured in vitro and replated every 3-4 days. Lower left: An in silico co-culture of sensitive (40h cell cycle) and resistant (60h cell cycle) cells seeded randomly throughout the domain or clustered in the center. The spatial distributions of cells are shown at several time points. Right: In silico simulations were initialized with different phenotypic distributions, characterized by a mean sensitivity s and standard deviation σs: A) s=100%, σs=5%; B) s=100%, σs=25%; C) s=60%, σs=5%; and D) s=60%, σs =25%. The initial distributions are shown as histograms in the plot insert; the final spatial layout is shown to the right.
Figure 3
Figure 3
CT and AT schedules applied to tumors with a variety of phenotypes. Tumor phenotypes were initialized by normal distributions with mean sensitivity s and standard deviation σs: A) s=100% and σs=5%, B) s=100% and σs=25%, C) s=60% and σs=5%, and D) s=60% and σs=25%. Top panels show the dose schedules for each treatment strategy, middle panels, the population dynamics, and lower panels, the spatial configurations at several time points.
Figure 4
Figure 4
Comparing CT, AT1 (α=0.25, β=0.05), and AT2 (α=0.50, β=0.10) treatment schedules. A) Dose schedules, population dynamics, and spatial layout at various time points are shown for the treatment of a tumor with a pre-growth normal distribution of s=100% and σs=25%. See the Supplement for animations comparing treatment strategies for several tumor compositions (Movies 1–4). B) Trajectories for average sensitivity vs. average dose plotted every month with increasing point size. The background color indicates the expected growth rate of a tumor with a given cell cycle time, T, receiving a drug dose D (see text). The dashed line indicates where net growth is expected to be zero. C) Heat map indicates the strategy that gives the best outcome averaged from 3 simulations for different tumor compositions. Outcomes are favored in following order: cure, control, and longest time to recurrence. If recurrence is most likely, color indicates the average time gained by the winning strategy. D) Average dose given for each treatment strategy.
Figure 5
Figure 5
Comparing treatments when tumor cells migrate. A) Comparing CT, AT1, and AT2 treatments using a tumor from a pre-growth normal distribution of s=100% and σs=25%. Dose schedules, population dynamics, and spatial layout at various time points are shown for each treatment. See the Supplement for animation (Movie 5). B) Trajectories for average sensitivity vs. average dose over time. C) Winning strategies, and D) Average dose for different initial tumor compositions. See Figure 4 caption for more details on each panel.
Figure 6
Figure 6
Comparing treatments when tumor cell phenotypes can drift. A) Comparing CT, AT1, and AT2 treatments using a tumor from a pre-growth normal distribution of s=80% and σs=25%. Dose schedules, population dynamics, and spatial layout at various time points are shown for each treatment. See the Supplement for animation (Movie 6). B) Trajectories for average sensitivity vs. average dose over time. C) Winning strategies, and D) Average dose for different initial tumor compositions. See Figure 4 caption for details on each panel.
Figure 7
Figure 7
Connecting a set of tumors at the tissue scale to a systemic measure of tumor burden. A set of tumors with dissimilar compositions are treated using CT, AT1 (α=0.25, β=0.05), and AT2 (α=0.50, β=0.10) schedules using the change in the total tumor burden (the sum of tumor cells from all metastatic sites) to adjust treatment doses. The population dynamics (upper left), and the individual spatial compositions at the end of the simulation are shown (lower left). This model can be used to couple the total systemic tumor burden to the individual spatial distributions found from imaging (right).

References

    1. Gallaher JA, Anderson ARA. Evolution of intratumoral phenotypic heterogeneity: the role of trait inheritance. 2013 Aug 6;3(4):20130016. - PMC - PubMed
    1. Kreso A, O’Brien CA, van Galen P, Gan OI, Notta F, Brown AMK, et al. Variable Clonal Repopulation Dynamics Influence Chemotherapy Response in Colorectal Cancer. Science. 2013 Jan 31;339(6119):543–8. - PMC - PubMed
    1. Chmielecki J, Foo J, Oxnard GR, Hutchinson K, Ohashi K, Somwar R, et al. Science Translational Medicine. 90. Vol. 3. American Association for the Advancement of Science; 2011. Jul 6, Optimization of dosing for EGFR-mutant non-small cell lung cancer with evolutionary cancer modeling; pp. 90ra59–9. - PMC - PubMed
    1. Silva AS, Kam Y, Khin ZP, Minton SE, Gillies RJ, Gatenby RA. Evolutionary Approaches to Prolong Progression-Free Survival in Breast Cancer. Cancer Research. 2012 Dec 16;72(24):6362–70. - PMC - PubMed
    1. Silva AS, Durand A, Ribeiro MC, Alsina M, Shain K, Baz R. An Evolutionary Approach for Personalized Therapy in Multiple Myeloma. AM. 2016;07(02):159–69.

Publication types

Substances