. 2018 Feb 28;38(9):2359-2371.
doi: 10.1523/JNEUROSCI.0712-17.2018. Epub 2018 Jan 30.

Age-Dependent Decline in Fate Switch from NG2 Cells to Astrocytes After Olig2 Deletion

Affiliations

Age-Dependent Decline in Fate Switch from NG2 Cells to Astrocytes After Olig2 Deletion

Hao Zuo et al. J Neurosci. .

Abstract

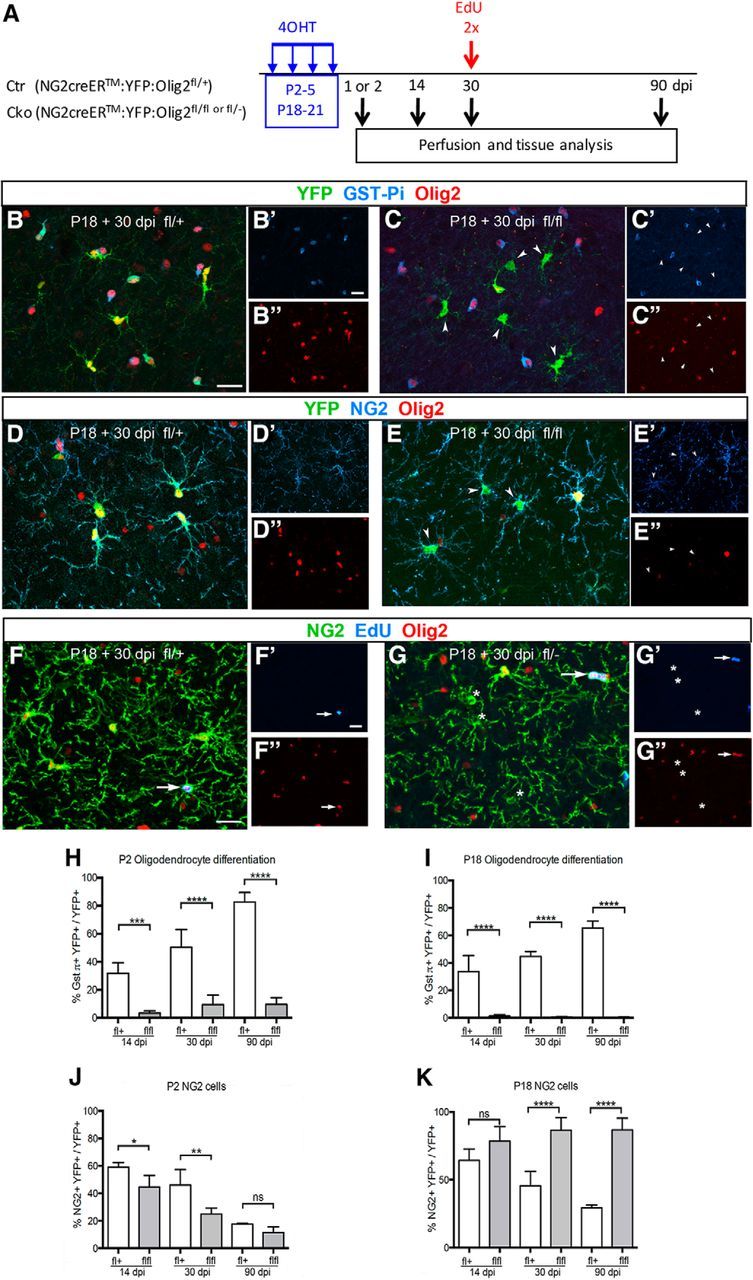
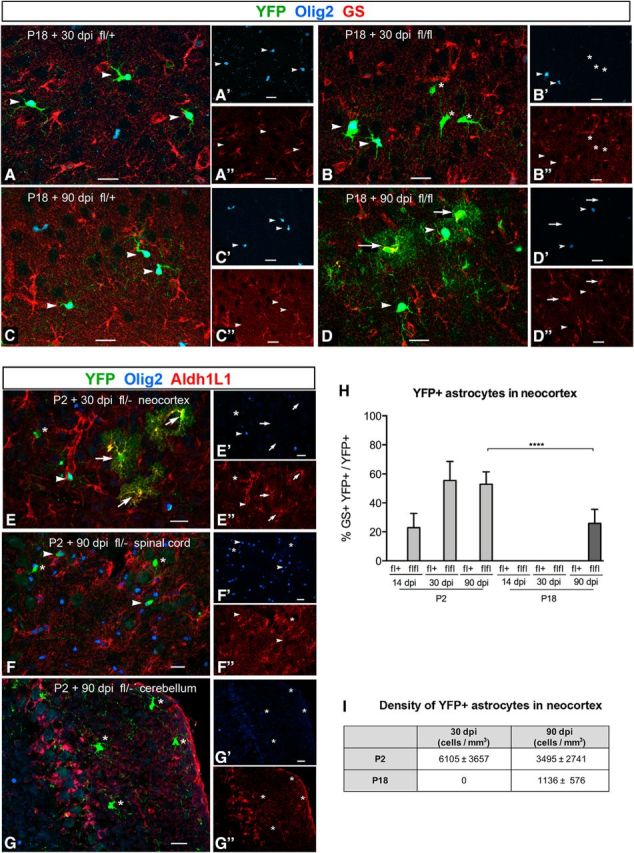
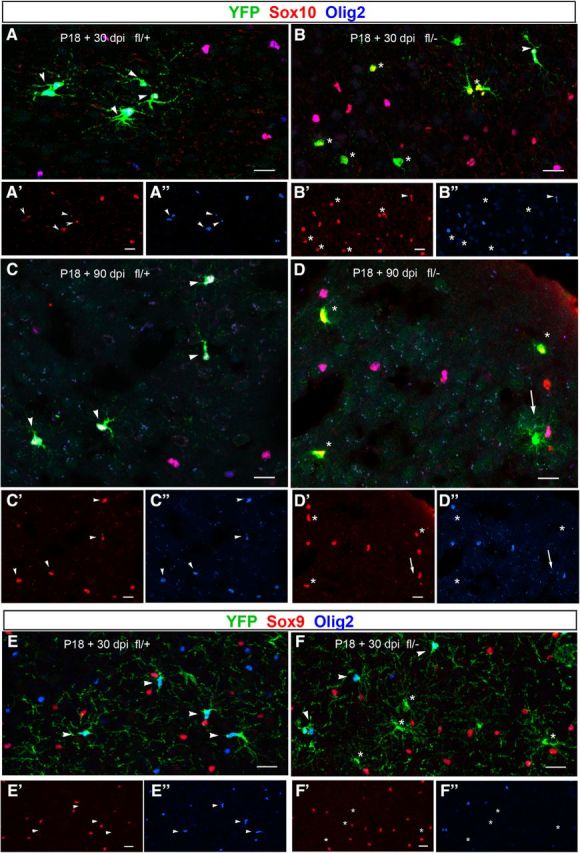
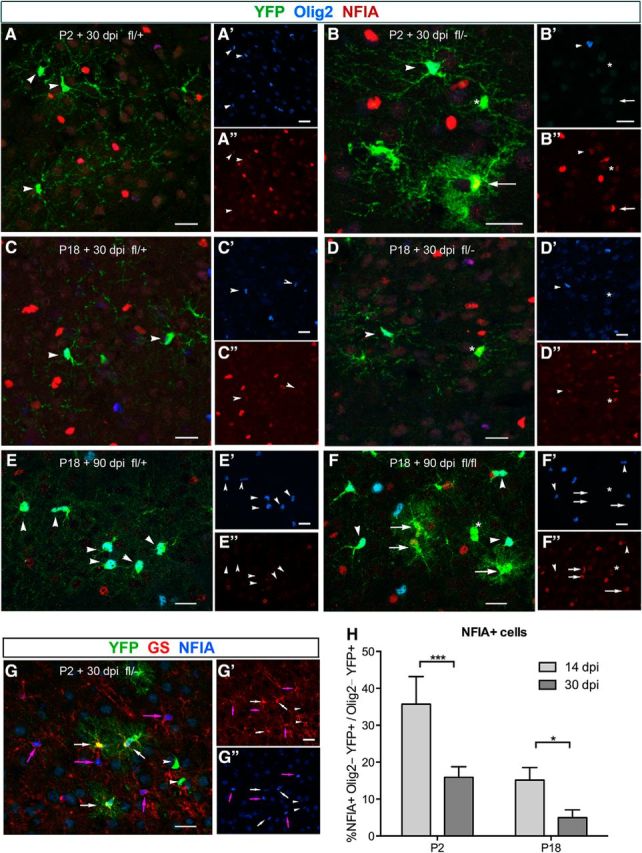
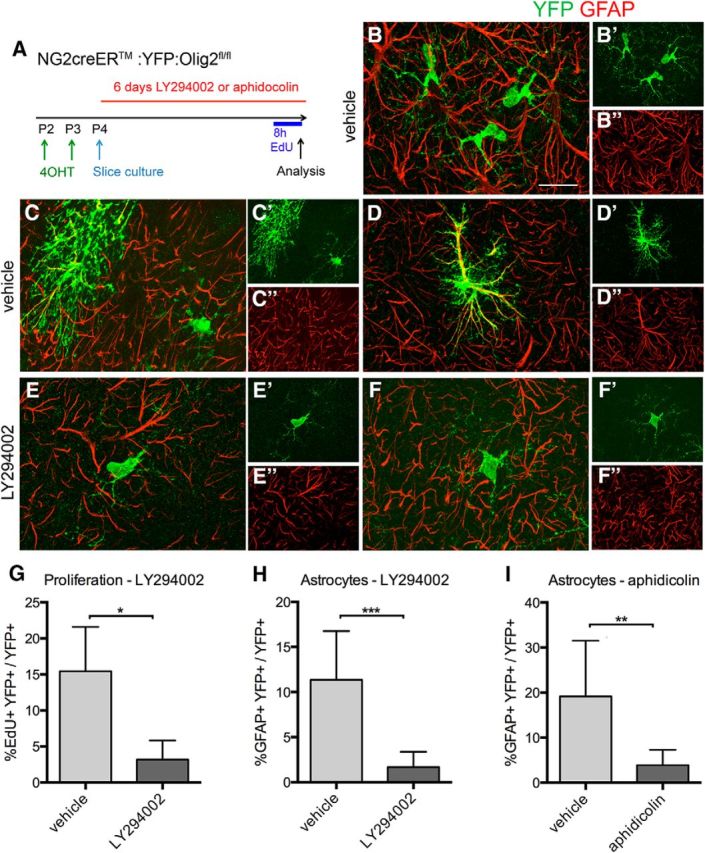
NG2 cells are a resident glial progenitor cell population that is uniformly distributed throughout the developing and mature mammalian CNS. Those in the postnatal CNS generate exclusively myelinating and non-myelinating oligodendrocytes and are thus equated with oligodendrocyte precursor cells. Prenatally, NG2 cells in the ventral gray matter of the forebrain generate protoplasmic astrocytes as well as oligodendrocytes. The fate conversion from NG2 cells into protoplasmic astrocytes is dependent on downregulation of the key oligodendrocyte transcription factor Olig2. We showed previously that constitutive deletion of Olig2 in NG2 cells converts NG2 cells in the neocortex into protoplasmic astrocytes at the expense of oligodendrocytes. In this study, we show that postnatal deletion of Olig2 caused NG2 cells in the neocortex but not in other gray matter regions to become protoplasmic astrocytes. However, NG2 cells in the neocortex became more resistant to astrocyte fate switch over the first 3 postnatal weeks. Fewer NG2 cells differentiated into astrocytes and did so with longer latency after Olig2 deletion at postnatal day 18 (P18) compared with deletion at P2. The high-mobility group transcription factor Sox10 was not downregulated for at least 1 month after Olig2 deletion at P18 despite an early transient upregulation of the astrocyte transcription factor NFIA. Furthermore, inhibiting cell proliferation in slice culture reduced astrocyte differentiation from Olig2-deleted perinatal NG2 cells, suggesting that cell division might facilitate nuclear reorganization needed for astrocyte transformation.SIGNIFICANCE STATEMENT NG2 cells are glial progenitor cells that retain a certain degree of lineage plasticity. In the normal postnatal neocortex, they generate mostly oligodendrocyte lineage cells. When the oligodendrocyte transcription factor Olig2 is deleted in NG2 cells in the neocortex, they switch their fate to protoplasmic astrocytes. However, the efficiency of the fate switch decreases with age over the first 3 postnatal weeks and is reduced when cell proliferation is inhibited. As the neocortex matures, sustained expression of the oligodendrocyte lineage-specific key transcription factor Sox10 becomes less dependent on Olig2. Together, our findings suggest a gradual stabilization of the oligodendrocyte lineage genes and loss of lineage plasticity during the first 3 weeks after birth, possibly due to nuclear reorganization.

Keywords: NG2; Olig2; Sox10; astrocyte; lineage; oligodendrocyte.


Figures

Figure 1.
Figure 1.
Compromised oligodendrocyte differentiation of Olig2-deleted cells. A, Schematic showing a timeline of the experiments. 4OHT was injected into Ctr or Cko mice at P2–P5 or P18–P21 and analyzed at 14, 30, or 90 dpi. A 1 or 2 dpi time point was taken to estimate the Olig2 deletion efficiency. EdU was injected twice 2 h apart before perfusion. BE, Oligodendrocyte differentiation from NG2 cells in Ctr and Cko neocortex at P18 + 30 dpi. Neocortical sections from Ctr (B and D; fl/+) or Cko (C and E; fl/fl) mice immunolabeled for YFP (green), Olig2 (red) and Gst-π (blue in B and C) or NG2 (blue in D and E). YFP+ cells that lack Olig2 do not express Gst-π but are NG2+ (arrowheads in C and E). F, G, EdU incorporation into NG2 cells in Ctr (F) and Cko (G) neocortex at P18 + 30 dpi. Arrows indicate NG2+Olig2+ cells that are EdU+ in Ctr and Cko mice. EdU is not detected among NG2+ cells that lack Olig2 in Cko (asterisks in G). B′ and C′ are single channel images of Gst-pi immunofluorescence. D' and E' are single channel images of NG2 immunofluorescence. F′ and G′ show EdU labeled cells. B″, C″, D″, E″, F″, and G″ represent single channel images of Olig2 immunofluorescence. Scale bars, 20 μm. HK, Quantification of oligodendrocytes and NG2 cells in Ctr and Cko neocortex. H, I, Oligodendrocyte differentiation after Cre activation at P2 (H) or P18 (I) showing the percentage of YFP+Gst-π+Olig2+ cells among YFP+Olig2+ cells in the neocortex of Ctr mice (open bars) and the percentage of YFP+Gst-π+Olig2 cells among YFP+Olig2 cells in Cko mice (gray bars). J, K, NG2 cells after Cre activation at P2 (J) or P18 (K) showing the percentage of YFP+NG2+Olig2+ cells among YFP+Olig2+ cells in the neocortex of Ctr mice (open bars) and the percentage of YFP+NG2+Olig2 cells among YFP+Olig2 cells in Cko mice (gray bars). The quantification in Cko mice was restricted in YFP+Olig2 cells (gray bars). Two-way ANOVA, Fisher's least significant difference test, n = 3. ns: not significant (p > 0.05); *0.01 < p < 0.05; **0.001 < p < 0.01; ***0.0001 < p < 0.001, ****p < 0.0001. Error bars indicate SD.
Figure 2.
Figure 2.
Astrocyte differentiation from NG2 cells in Cko neocortex. AD, NG2 cell-derived astrocytes in Ctr (A, C, fl/+) and Cko mice (B, D, fl/fl) at P18 + 30 dpi (A, B) and 90 dpi (B, D). In Ctr neocortex, YFP+ cells that express Olig2 have the morphology of oligodendrocyte lineage cells and lack GS (arrowheads in A and C). In Cko neocortex, YFP+ cells that retain Olig2 lack GS and have the morphology of oligodendrocyte lineage cells as in Ctr (arrowheads in B and D). In Cko cortex at P18 + 90 dpi, there are clusters of YFP+ cells with bushy astrocyte morphology that express GS (arrows in D). Some Olig2 deleted cells at P18 + 30 dpi exhibit oligodendrocyte lineage morphology and lack GS (asterisks in B). E, Labeling for YFP, Olig2, and Aldh1L1 in Cko neocortex at P2 + 30 dpi confirming the astrocyte identify of bushy YFP+ cells (arrows). Some Olig2-deleted YFP+ cells (asterisks) and YFP+ cells that escaped Olig2 deletion (arrowheads) lack Aldh1L1 and have the morphology of oligodendrocyte lineage cells. F, G, In the spinal cord (F) and cerebellar cortex (G) of P2 + 90 dpi Cko mice, Olig2-deleted YFP+ cells do not express Aldh1L1 and exhibit the morphology of oligodendrocyte lineage cells (asterisks). Arrowheads denote YFP+ cells that retain Olig2. A′–G′: Olig2 immunofluorescence. A″–D″: GS immunofluorescence. E″–G″ Aldh1L1 immunofluorescence. Scale bars, 20 μm. H, Quantification of NG2 cell-derived astrocytes in Ctr and Cko neocortex. The proportion of YFP+GS+ astrocytes among YFP+ cells at 14, 30, and 90 dpi after Olig2 deletion at P2 (light gray bars) or P18 (dark gray bars) in the neocortex of Ctr (fl/+) and Cko (fl/fl) mice. Two-way ANOVA, Fisher's LSD (least significant difference) test, n = 3. ****p < 0.0001. Error bars indicate SD. I, Density of YFP+GS+ astrocytes at 30 and 90 dpi after Olig2 deletion at P2 or P18. The density of YFP+ astrocytes declines in the neocortex from P2 + 30 to 90 dpi and is lower at P18 + 90 dpi compared with that in P2 + 90 dpi neocortex.
Figure 3.
Figure 3.
Delayed downregulation of Sox10 after Olig2 deletion at P18. AD, Sox10 expression in Ctr (A, C) and Cko mice (B, D) at P18 + 30 dpi (A, B) and 90 dpi (C, D). Sections were triple labeled for Sox10, Olig2, and YFP. Sox10 is detected in YFP+Olig2+ cells in Ctr (fl/+) and Cko (fl/−) mice at 30 and 90 dpi (A, C, arrowheads) and in YFP+Olig2 cells in Cko (fl/−) mice at 30 dpi (B, asterisks) and in a subpopulation of YFP+Olig2 cells in Cko mice at 90 dpi with oligodendrocyte lineage morphology (D, asterisks). Sox10 immunoreactivity is not detectable in YFP+ cells with bushy protoplasmic astrocyte morphology found in Cko cortex at 90 dpi (D, arrows). E, F, Mutually exclusive expression of Sox9 and YFP+ cells. At P18 + 30 dpi, Sox9 is not detected in YFP+Olig2+ cells in the neocortex of Ctr (fl/+, E) and Cko (fl/−, F) mice (arrowheads) or YFP+Olig2 cells in Cko mice (F, asterisks). A′–D′: Sox10, A″–D″ Olig2. E′–F′: Sox9, E″–F″: Olig2. Scale bars, 20 μm.
Figure 4.
Figure 4.
Early upregulation of NFIA expression in Olig2-deleted cells. AF, Immunolabeling of neocortical sections from Ctr (fl/+; A, C, E) and Cko (fl/−; B, D, F) mice for YFP, Olig2, and NFIA. A, B, P2 + 30 dpi. In Ctr (A), YFP+ cells are Olig2+ (arrowheads) and have low levels or little detectable NFIA. In Cko (B), an Olig2+ YFP+ cell has a low level of NFIA and an Olig2 YFP+ cell with bushy astrocyte morphology (arrow) has a higher level of NFIA. Another YFP+ cell with an oligodendrocyte lineage cell morphology (asterisk) lacks Olig2 and has an intermediate level of NFIA. C, D, P18 + 30 dpi. In Ctr (C) and Cko (D), YFP+ cells that are Olig2+ (arrowheads) have low or no detectable NFIA. In Cko, one YFP+ cell that lacks Olig2 has a higher level of NFIA than its neighboring Olig2+ cells (asterisk). E, F, P18 + 90 dpi. In Ctr (E), YFP+ cells are Olig2+ (arrowheads) and have little detectable NFIA. In Cko (F), YFP+Olig2+ cells (arrowheads) have little detectable NFIA as in Ctr, whereas YFP+ Olig2 cells with bushy astrocyte morphology (arrows) have readily detectable NFIA. Asterisks indicate a YFP+Olig2 cell that does not have astrocyte morphology. G, Labeling for YFP, NFIA, and GS shows that cells that are strongly labeled for NFIA are GS+ astrocytes (pink arrows). Bushy YFP+ astrocytes derived from NG2 cells also express GS and NFIA (white arrows), whereas YFP+Olig2+ cells express neither GS nor NFIA (arrowheads). A′–F′: single channel images showing Olig2 immunofluorescence. A″–F″: single channel images showing NFIA immunofluorescence. G′: single channel image showing GS immunofluorescence. G″: single channel image showing NFIA immunofluorescence. Scale bars, 20 μm. H, Quantification of YFP+NFIA+ cells in the neocortex of Cko mice. Graph shows the proportion of YFP+Olig2 cells at 14 dpi (light gray bars) and 30 dpi (dark gray bars) after Olig2 deletion at P2 or P18. Fisher's least significant difference test, n = 3. *0.01 < p < 0.05, ***0.0001 < p < 0.001.
Figure 5.
Figure 5.
Astrocyte differentiation from Olig2-deleted NG2 cells in slice culture after inhibiting cell proliferation. A, Experimental setup. Slice cultures were prepared from P4 Cko mice after 4OHT injection in vivo at P2–P3. BF, Slice cultures immunolabeled for YFP and GFAP. B, Vehicle-treated slice showing a cluster of YFP+GFAP cells with polydendrocytes morphology. C, Vehicle-treated slice showing a YFP+GFAP+ cell with protoplasmic astrocyte morphology (left) and a YFP+GFAP cell with polydendrocyte morphology (right). D, Vehicle-treated slice showing a YFP+GFAP+ astrocyte with strong GFAP immunoreactivity. E, F. LY29004-treated slice showing a YFP+GFAP cell with the morphology of a polydendrocyte (E) or immature oligodendrocyte (F). A′, B′, C′, D′, E′, and F′ are single channel images showing YFP+ cells, and A″, B″, C″, D″, E″, and F″ are single channel images showing GFAP immunofluorescence. Scale bar, 20 μm. G, Proportion of EdU+ among YFP+ cells in slice cultures treated with vehicle (light gray bar) or LY294002 (dark gray bars). n = 4. H, Proportion of GFAP+ astrocytes among YFP+ cells in slice cultures treated with vehicle (light gray bar) or LY294002 (dark gray bar). n = 9. I, Proportion of GFAP+ astrocytes among YFP+ cells in slice cultures treated with vehicle (light gray bar) or aphidicolin (dark gray bar). n = 3. *p < 0.05, **0.01 < p < 0.05, ***0.001 < p < 0.01 Student's t test. Error bars indicate SD.

Similar articles

Cited by

References

    1. Bischof M, Weider M, Küspert M, Nave KA, Wegner M (2015) Brg1-dependent chromatin remodelling is not essentially required during oligodendroglial differentiation. J Neurosci 35:21–35. 10.1523/JNEUROSCI.1468-14.2015 - DOI - PMC - PubMed
    1. Cai J, Chen Y, Cai WH, Hurlock EC, Wu H, Kernie SG, Parada LF, Lu QR (2007) A crucial role for Olig2 in white matter astrocyte development. Development 134:1887–1899. 10.1242/dev.02847 - DOI - PubMed
    1. Cammer W, Tansey F, Abramovitz M, Ishigaki S, Listowsky I (1989) Differential localization of glutathione-S-transferase yp and yb subunits in oligodendrocytes and astrocytes of rat brain. J Neurochem 52:876–883. 10.1111/j.1471-4159.1989.tb02536.x - DOI - PubMed
    1. Dawson MR, Polito A, Levine JM, Reynolds R (2003) NG2-expressing glial progenitor cells: an abundant and widespread population of cycling cells in the adult rat CNS. Mol Cell Neurosci 24:476–488. 10.1016/S1044-7431(03)00210-0 - DOI - PubMed
    1. Deneen B, Ho R, Lukaszewicz A, Hochstim CJ, Gronostajski RM, Anderson DJ (2006) The transcription factor NFIA controls the onset of gliogenesis in the developing spinal cord. Neuron 52:953–968. 10.1016/j.neuron.2006.11.019 - DOI - PubMed

Publication types

Substances

LinkOut - more resources