. 2018 Mar 30;293(13):4752-4766.
doi: 10.1074/jbc.RA117.000163. Epub 2018 Jan 30.

Tyrosine phosphorylation switching of a G protein

Affiliations

Tyrosine phosphorylation switching of a G protein

Bo Li et al. J Biol Chem. .

Abstract

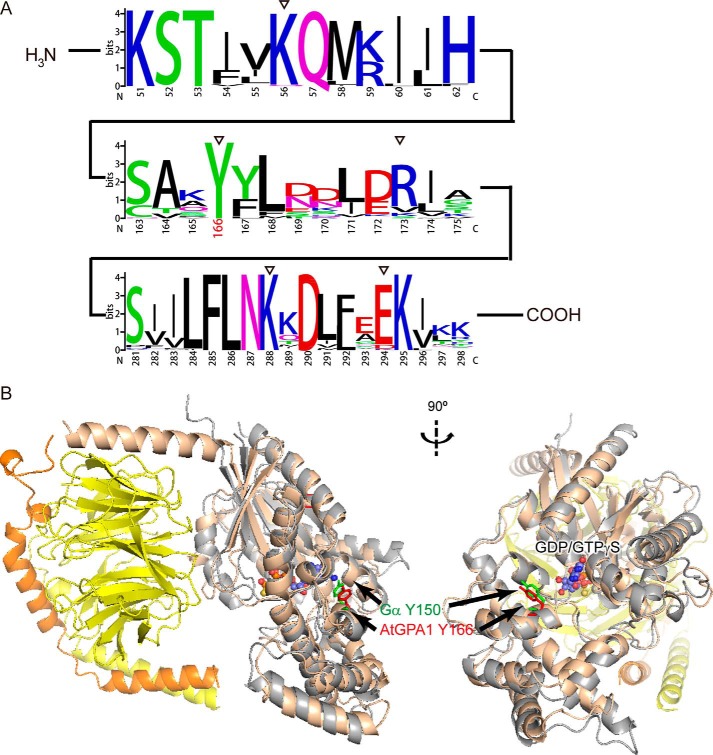
Heterotrimeric G protein complexes are molecular switches relaying extracellular signals sensed by G protein-coupled receptors (GPCRs) to downstream targets in the cytoplasm, which effect cellular responses. In the plant heterotrimeric GTPase cycle, GTP hydrolysis, rather than nucleotide exchange, is the rate-limiting reaction and is accelerated by a receptor-like regulator of G signaling (RGS) protein. We hypothesized that posttranslational modification of the Gα subunit in the G protein complex regulates the RGS-dependent GTPase cycle. Our structural analyses identified an invariant phosphorylated tyrosine residue (Tyr166 in the Arabidopsis Gα subunit AtGPA1) located in the intramolecular domain interface where nucleotide binding and hydrolysis occur. We also identified a receptor-like kinase that phosphorylates AtGPA1 in a Tyr166-dependent manner. Discrete molecular dynamics simulations predicted that phosphorylated Tyr166 forms a salt bridge in this interface and potentially affects the RGS protein-accelerated GTPase cycle. Using a Tyr166 phosphomimetic substitution, we found that the cognate RGS protein binds more tightly to the GDP-bound Gα substrate, consequently reducing its ability to accelerate GTPase activity. In conclusion, we propose that phosphorylation of Tyr166 in AtGPA1 changes the binding pattern with AtRGS1 and thereby attenuates the steady-state rate of the GTPase cycle. We coin this newly identified mechanism "substrate phosphoswitching."

Keywords: G protein-coupled receptor (GPCR); GTP hydrolysis; GTPase; GTPase-activating protein (GAP); guanine-nucleotide exchange factor; heterotrimeric G protein; phosphotyrosine signaling; protein phosphorylation; regulator of G protein signaling (RGS); substrate phosphoswitching.


Conflict of interest statement

The authors declare that they have no conflicts of interest with the contents of this article

Figures

Figure 1.
Figure 1.
SAPH-ire analyses of AtGPA1 Tyr166. A, log plot of experimentally observed PTM hot spots in the Gα protein family IPR001019. PTM hot spots generated by SAPH-ire were plotted in rank order with respect to calculated function potential probability score (SAPH-ire NN Score). Hot spots known to be involved in regulating protein function were color- and size-coded by the number of literature sources (known function source count, KFSC) that provide evidence of the biological function. Hot spot IPR001019-1010, containing AtGPA1 pTyr166 was colored green for ease of viewing. B, PTM hot spot cluster density from N to C terminus of the Gα protein family (Alignment Position (AP)). The native residue position of AtGPA1 (a member of the Gα family) is shown within the nested x axis for clarity (Native Position (NP)). Circle size is proportional to the number of PTMs found within the ±2 residue cluster centered on each hot spot. Circle color indicates whether the hot spot has a known function (red), is known by proximity to a hot spot with known function (yellow), or is uncharacterized (gray).
Figure 2.
Figure 2.
Conservation analysis of AtGPA1 Tyr166. A, conservation of α1 helix (top, amino acid residues 51–62), αE helix (middle, amino acid residues 163–175), and β5 brand + αG helix (bottom, amino acid residues 281–298) were aligned and calculated by the online WebLogo program (73). The x axis represents the corresponding position on AtGPA1, and the y axis represents the bit score. Empty triangles denote the amino acid residues Lys56, Tyr166, Lys173, Lys288, and Lys294, respectively. B, crystal structure of AtGPA1 (gray, PDB code 2XTZ (3)) aligned with a heterotrimeric G protein (tan for Bos hybrid Gα subunit, yellow for Gβ, and orange for Gγ; PDB code 1GOT (74)). Arrows point to Tyr166 on AtGPA1 and its corresponding residue Tyr150 on Bos hybrid Gα subunit.
Figure 3.
Figure 3.
DMD simulations for unphosphorylated, phosphorylated, and phosphomimetic AtGPA1. A, positions of Lys56, Tyr166, Arg173, Lys288, and Lys294 around the intramolecular domain interface are shown. B–Q, distance histograms between the phenolic oxygen of unphosphorylated (B–E), phosphorylated Tyr166 (F–I), phosphomimetic Y166E (J–M), or phosphomimetic Y166D (N–Q) and the amino nitrogen or guanidinium carbon of nearby positive charge residues (Lys56, Arg173, Lys288, and Lys294). Peaks in the histograms in the range indicating salt bridge formation (<6 Å) are highlighted (*).
Figure 4.
Figure 4.
AtGPA1 mutants retain global wildtype structure. A, CD spectra of His-tagged AtGPA1 wildtype (red) and its mutations Y166D (blue) and Y166E (green) on far-UV spectra (185–260 nm) in 0.5-nm scan steps at 20 °C. The protein solutions were all present at 100 nm, and the cell path length was 0.5 cm. The spectra results were analyzed with Chirascan software. B, fast quantitative cysteine reactivity unfolding curves for His-tagged AtGPA1 wildtype (red circle) and its mutations Y166D (blue square) and Y166E (green triangle).
Figure 5.
Figure 5.
Phosphorylation of AtGPA1 by leucine-rich repeat receptor-like kinases. A, in vitro kinase assays were performed to screen kinases for AtGPA1. Naive reactions ([γ-32P]ATP-containing buffer only (lane 1) and GST (lane 2)) were performed as negative controls. Seventy purified LRR RLKs (47) (the migration range on SDS-PAGE is denoted by the vertical line, lanes 3–72) were incubated with GST-AtGPA1 (∼70 kDa, empty triangle) in kinase assay buffer containing [γ-32P]ATP as described under “Experimental procedures.” Purified RGS + Ct (∼28 kDa, solid triangle) was employed as a positive control for the kinase activity of LRR RLKs. Apparent molecular masses were indicated on the left in kDa. The TAIR locus number of each LRR RLK is indicated at the top of the corresponding lane, and the lane number is at the bottom. Autophosphorylation and transphosphorylation were detected by autoradiography. See Table S1. B, functional categorization by annotation for AtGPA1 kinase candidates based on gene ontology biological process. The number indicates the percentage of annotations to terms in each gene ontology slim category with regard to the total annotations to terms in ontology. C, detection of phosphotyrosine residues on wildtype AtGPA1. Triangles denote the position of GST-AtGPA1, circles denote the position of His-BAK1, and squares denote the position of GST. Apparent molecular masses (kDa) are indicated on the right. Tyrosine phosphorylation on AtGPA1 or BAK1 was detected by a phosphotyrosine-specific antibody. Polyhistidine-tagged BAK1 was detected by His tag antibody. Total GST-GPA1 and GST were detected by GST tag antibody. D, the phosphorylation of AtGPA1 wildtype, Y166D, and Y166E was detected by phosphotyrosine-specific antibody. Total GST-GPA1 was detected by GST tag antibody. The intensity of each band was quantified with ImageJ. The ratio of phosphorylated/total AtGPA1 was calibrated to wildtype. The quantitative results were expressed as the means ± S.D. (error bars) of three experiments. Statistical significance was determined by an analysis of variance (ANOVA). **, differences with p values of <0.01. IB, immunoblotting.
Figure 6.
Figure 6.
AtGPA1 Y166E impairs AtRGS1-accelerated GTPase cycle. The GTPase hydrolysis rate was measured by a single-turnover GTP hydrolysis assay in the absence (A) or presence (B) of AtRGS1. Wildtype AtGPA1 or equivalent mutants were incubated with [γ-32P]GTP at 20 °C in the presence of GTPγS. The reactions were quenched at the indicated time points (A) or at 10 min (B), and the amount of 32PO4 in solution was measured by scintillation counting. The GTPase cycle was measured by a steady-state GTP hydrolysis assay in the absence (C) or presence of AtRGS1 (D). Wildtype AtGPA1 or equivalent mutants were incubated with [γ-32P]GTP at 20 °C. The reactions were quenched at the indicated time points (C) or at 10 min (D), and the amount of 32PO4 in solution was measured by scintillation counting. E, GTPγS-binding ability was measured by a GTPγS-binding assay in the absence or presence of 1 μm AtRGS1. Wildtype AtGPA1 or equivalent mutants were incubated with [γ-35S]GTPγS on ice. The reactions were stopped at the indicated time points. The amount of AtGPA1-bound [γ-35S]GTPγS was filtered on nitrocellulose membrane and measured by scintillation counting. The quantitative results were expressed as the means ± S.D. (error bars) of at least three experiments and fitted to exponential one-phase association functions (A and E), linear regression (C), or log (agonist) versus response (D) using GraphPad Prism version 5.0. Statistical significance was determined by ANOVA. ***, differences with p values <0.001. Supporting material for D is shown in Table 1.
Figure 7.
Figure 7.
AtGPA1 Y166E changes its binding specificity with AtRGS1. A, direct interaction between GST-tagged AtRGS1 (RGS + Ct) and His-tagged AtGPA1 wildtype or Y166E mutant in the presence of GDP, GTPγS, or GDP-AlF4 was detected by an in vitro pulldown assay. Protein complexes were purified by glutathione-Sepharose, separated by SDS-PAGE, and detected by anti-GST or anti-His antibodies. B, the intensities of His-AtGPA1 wildtype and Y166E mutant were quantitated with ImageJ and normalized as relative values to each interaction in the presence of GDP-AlF4. The quantitative results were expressed as the means ± S.D. (error bars) of four experiments. Statistical significance was determined by ANOVA. *, differences with p values of <0.05. **, differences with p values of <0.01. The binding affinity constants of AtRGS1 and AtGPA1 wildtype or Y166E mutant were measured by surface plasmon resonance with a ProteOn XPR36 instrument. The GST-tagged AtRGS1 (RGS + Ct) was immobilized on the surface of a GLC sensor chip as ligand, and the His-tagged AtGPA1 wildtype or Y166E in the GDP-bound, GTPγS-bound, or GDP-AlF4-bound state were diluted into dosage concentrations as analyte. The affinity constants were calculated by kinetic analysis (C–H) or equilibrium analysis (I-K) and are shown in Table 2. IP, immunoprecipitation; IB, immunoblotting.
Figure 8.
Figure 8.
Tyr166 modulates AtGPA1 interaction with AtRGS1 in vivo. A, FRET efficiency between transiently expressed C-terminal YFP-tagged AtRGS1 wildtype, phosphorylation mutant (3SA), or GAP mutant (E320K) and C-terminal CFP-tagged AtGPA1 wildtype or Y166E mutant in N. benthamiana. Values are based on Equation 1 (see “Experimental procedures”). B, FRET changes in response to 3-min 1 μm flg22 treatment between AtRGS1 and AtGPA1 wildtype or Y166E mutant in N. benthamiana. The quantitative results were expressed as the means ± S.D. (error bars) of regions of interest (n = 6–37). Statistical significance was determined by t test. *, differences with p values of <0.05.

Similar articles

Cited by

References

    1. Siderovski D. P., and Willard F. S. (2005) The GAPs, GEFs, and GDIs of heterotrimeric G-protein α subunits. Int. J. Biol. Sci. 1, 51–66 - PMC - PubMed
    1. Neubig R. R., and Siderovski D. P. (2002) Regulators of G-protein signalling as new central nervous system drug targets. Nat. Rev. Drug Discov. 1, 187–197 10.1038/nrd747 - DOI - PubMed
    1. Jones J. C., Duffy J. W., Machius M., Temple B. R. S., Dohlman H. G., and Jones A. M. (2011) The crystal structure of a self-activating G protein α subunit reveals its distinct mechanism of signal initiation. Sci. Signal. 4, ra8 10.1126/scisignal.2001446 - DOI - PMC - PubMed
    1. Johnston C. A., Taylor J. P., Gao Y., Kimple A. J., Grigston J. C., Chen J.-G., Siderovski D. P., Jones A. M., and Willard F. S. (2007) GTPase acceleration as the rate-limiting step in Arabidopsis G protein-coupled sugar signaling. Proc. Natl. Acad. Sci. U.S.A. 104, 17317–17322 10.1073/pnas.0704751104 - DOI - PMC - PubMed
    1. Chen J.-G., and Jones A. M. (2004) AtRGS1 function in Arabidopsis thaliana. Methods Enzymol. 389, 338–350 10.1016/S0076-6879(04)89020-7 - DOI - PubMed

Publication types

MeSH terms