. 2018 Jan 30;9(2):139.
doi: 10.1038/s41419-017-0032-5.

Ubiquitin C decrement plays a pivotal role in replicative senescence of bone marrow mesenchymal stromal cells

Affiliations

Ubiquitin C decrement plays a pivotal role in replicative senescence of bone marrow mesenchymal stromal cells

Jiyeon Kim et al. Cell Death Dis. .

Abstract

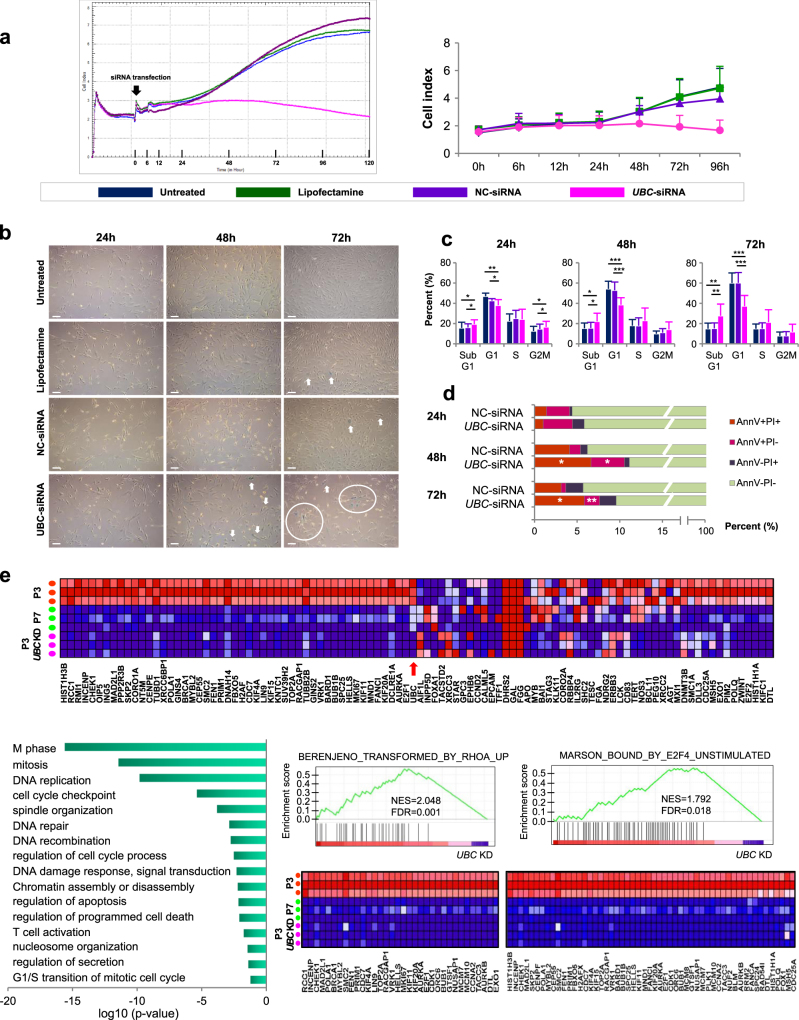
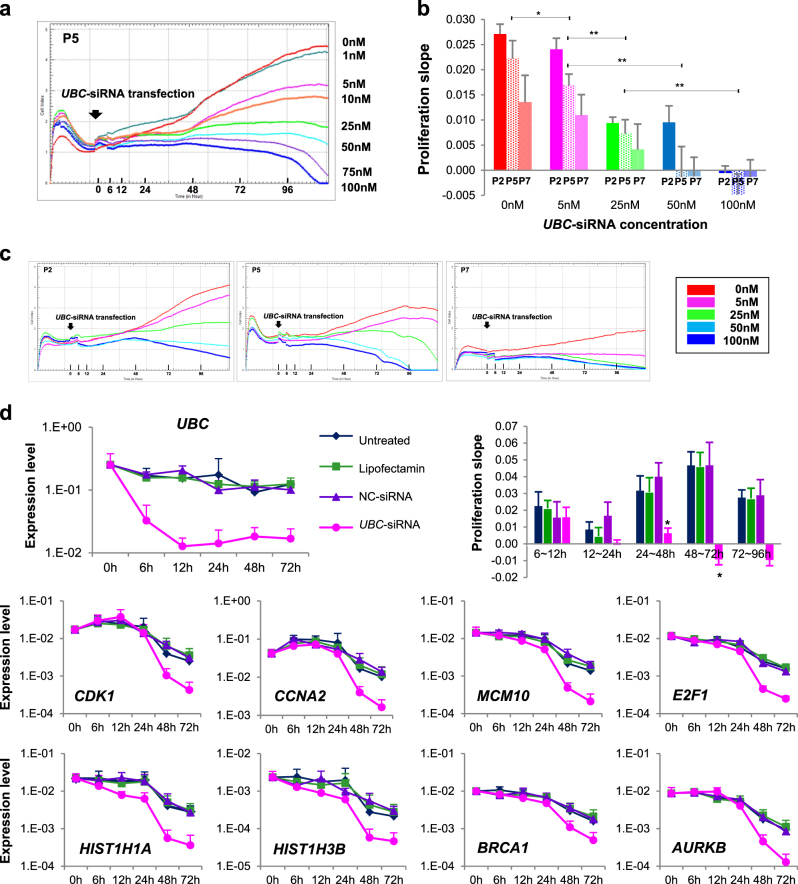
Human bone marrow-mesenchymal stromal cells (hBM-MSCs) undergo cellular senescence during in vitro culture. In this study, we defined this replicative senescence as impaired proliferation, deterioration in representative cell characteristics, accumulated DNA damage, and decreased telomere length and telomerase activity with or without genomic abnormalities. The UBC gene expression gradually decreased during passaging along with the reduction in series of molecules including hub genes; CDK1, CCNA2, MCM10, E2F1, BRCA1, HIST1H1A and HIST1H3B. UBC knockdown in hBM-MSCs induced impaired proliferation in dose-dependent manner and showed replicative senescence-like phenomenon. Gene expression changes after UBC knockdown were similar to late passage hBM-MSCs. Additionally, UBC overexpession improved the proliferation activity of hBM-MSCs accompanied by increased expression of the hub genes. Consequently, UBC worked in higher-order through regulation of the hub genes controlling cell cycle and proliferation. These results indicate that the decrement of UBC expression plays a pivotal role in replicative senescence of hBM-MSCs.


Conflict of interest statement

The authors declare that they have no competing financial interests.

Figures

Fig. 1
Fig. 1. Biological and genetic characteristics of replicative senescence in hBM-MSCs
a Morphologic changes during in vitro culture. Typical homozygous populations of fibroblast-like cells were observed at P2 and P4. Enlarged type II cells with altered morphology were evident at P6 and were more prevalent at P8. Scale bars, 100 μm. b Increment of enlarged type II cells and senescence-associated β-galactosidase (SA-β-gal) positive cells during in vitro culture. Each point corresponds to the mean and SD for at least three independent experiments at each passage. c Representative images of SA-β-gal staining during in vitro culture. SA-β-gal-positive enlarged hBM-MSCs were observed after P5 (indicated with white arrows) and increased in prevalence at P7 and P9. Mean and SD are shown. Scale bars, 100 μm. d Growth kinetics of hBM-MSCs during passaging. Data from three donors are presented and scored as population doubling time (PDT) plotted against passage. e Evaluation of mesodermal differentiation potential of hBM-MSCs at P2, P5 and P8 in terms of adipogenesis (Oil red O), chondrogenesis (Alcian blue) and osteogenesis (silver nitrate). Scale bars, 100 μm. f Changes in metaphase cell count from three donors. The number of available metaphases was decreased after P5. g Single-nucleotide microarray analysis of copy number alterations (CNAs) at P2, P4, P6 and P8 from three donors. Red circle indicates a small CNA at chromosome 7 that was first detected at P6 and was maintained to P8 in MSC3. See also Supplementary Fig. 1S
Fig. 2
Fig. 2. Comparison of characteristics of hBM-MSCs and iPSCs during in vitro culture
a ATM expression was increased in hBM-MSCs (left) during passaging while the expression was maintained in iPSCs (right). b Sub G1 populations increased in hBM-MSCs (left) during passaging while they did not change in iPSCs (right) (see also Supplementary Fig. 2S). c Telomere length shortening occurred in hBM-MSCs (left) during passaging, whereas it did not in iPSCs (right). d Relative telomerase activities (RTA) were low in hBM-MSCs and decreased at passaged cells (left), whereas they were maintained at high level in iPSCs (right) during passaging. Results are represented as mean and SD from three independent experiments. *P < 0.05, **P < 0.01, ***P < 0.001
Fig. 3
Fig. 3. Gene expression profiles in replicative senescence of hBM-MSCs.
a Heatmap showing the expression levels of the differentially expressed genes between P3 and P7 in hBM-MSCs ≥ 4 or ≤ 4. The dendrogram was derived by unsupervised hierarchical clustering of gene expression profiles that characterized the replicative senescence of hBM-MSCs. The algorithm grouped according to their similarity in gene expression profiles. Red spots indicate upregulated transcripts and blue spots indicate downregulated transcripts, relative to the reference RNA used. b General functional classification of genes downregulated more than 4-fold in late passage hBM-MSCs (P7) compared to early passage (P3). Gene Ontology (GO) analysis within the target genes of significantly altered RNAs after passaging was performed using the database for annotation, visualization and integrated discovery (DAVID) bioinformatics tool. The enriched GO biological processes were identified and listed according to their enrichment P-value (P < 0.005). The P-values were obtained from the DAVID 2.1 statistical function classification tool. c Ingenuity Pathway Analysis (IPA) network diagram illustrating annotated interactions between genes affected by in vitro culture. Network represents the merged view of the four significant subnetworks categorized by IPA function: Cell Morphology, Cellular Assembly and Organization, Cellular Function and Maintenance, Cell Cycle, Cellular Assembly and Organization, DNA Replication, Recombination, and Repair, and Cancer, Organismal Injury and Abnormalities, Reproductive System Disease. d Changes in UBC, CDK1, CCNA2, MCM10, E2F1, HIST1H1A, HIST1H3B and BRCA1 mRNA expression of hBM-MSCs (left) during in vitro culture compared to those of iPSCs (right). Data are presented as mean and SD from three independent experiments. See also Supplementary Fig. 3S
Fig. 4
Fig. 4. UBC knockdown (KD) in hBM-MSCs induces replicative senescence-like phenomenon
a Dynamic real-time monitoring of hBM-MSC proliferation after UBC KD (pink line) using the xCELLigence assay compared to untreated (blue), Lipofectamine treated (green) and negative control (NC)-siRNA transfected (purple) hBM-MSCs for 120 h following treatment. Representative data are from MSC3 by three technical replicates (left) and the mean and SD from the three donors (right) (see also Supplementary Movie). b Expression of senescence-associated β-galactosidase (SA-β-gal) at 24, 48 and 72 h after UBC KD compared to untreated, Lipofectamine treated and NC-siRNA transfected hBM-MSCs. Low density cells with lower confluency with increased SA-β-gal-positivity were observed at 72 h after UBC KD. Scale bars, 100 μm. c Cell cycle changes of sub G1, G1, S and G2/M phases after UBC KD compared to untreated and NC-transfection. *P < 0.05, **P < 0.01, ***P < 0.001. d Apoptosis analysis after UBC KD using Annexin V/propidium iodide staining. *P < 0.05, **P < 0.01 compared to NC-siRNA transfected group. e Gene Set Enrichment Analysis (GSEA) shows similar gene expression patterns in hBM-MSCs at P7 and UBC KD cells at P3. Heat Map of the top 50 features for each phenotype in hBM-MSCs at P7 and P3 compared to UBC KD (upper). Gene ontology (GO) analysis within the target genes of significantly altered RNAs in UBC KD hBM-MSCs (lower left). GSEA enrichment plots and corresponding heat map images in hBM-MSCs at P3 versus P7 and UBC KD (lower right). NES, normalized enrichment score. FDR, false discovery rate
Fig. 5
Fig. 5. Molecular mechanism of replicative senescence induced by UBC downregulation
a The degree of hBM-MSC proliferation was dependent on the concentration of the UBC gene expression. UBC-siRNA concentration ranged from 0 to 100 nM. Representative data are from MSC1 by three technical replicates. b, c Effect of the UBC knockdown (KD) on cell proliferation rate of hBM-MSCs at different passages (P2, P5 and P7). Cells were transfected with 0, 5, 25, 50 and 100 nM siRNA. Cell proliferation was calculated as the slope of the growth curve. Results are presented as mean ± SD from three independent experiments. *P < 0.05, **P < 0.01, ***P < 0.001 b. Representative data from MSC1 by three technical replicates c (see also Fig. 4S). d Observed expression changes in UBC, CDK1, CCNA2, MCM10, E2F1, HIST1H1A, HIST1H3B, BRCA1 and AURKB genes and corresponding cell proliferation rate as slope with 100 nM UBC-siRNA transfected (pink line) compared to untreated (blue), lipofectamin (green) and negative control (NC)-siRNA transfected (purple) hBM-MSCs. Each point corresponds to the mean and SD for three independent experiments. *P < 0.05 versus NC-siRNA transfected group
Fig. 6
Fig. 6. Validation of the pivotal role of the UBC gene in replicative senescence
a Knockdown (KD) of CDK1 and E2F1 in hBM-MSCs did not influence on UBC gene expression. Each point corresponds to the mean and SD for three independent experiments. b Representative images of crystal violet-stained colonies in untreated, negative control (NC)-siRNA and UBC-siRNA transfected iPSCs. c Expression changes in UBC, CDK1, CCNA2, MCM10, E2F1, HIST1H1A, HIST1H3B, BRCA1 and AURKB genes in UBC-siRNA transfected (pink line) compared to NC-siRNA transfected (purple) iPSCs. Error bars in all panels represent mean and SD from three independent experiments
Fig. 7
Fig. 7. Improvement of proliferation activity by UBC overexpression in hBM-MSCs
a UBC mRNA level after UBC-transfected hBM-MSCs compared to empty vector (EV)-transfected cells. b, c Comparison of cell proliferation activity by the slope of the growth curve b and representative image via real-time monitoring c. Data are presented as mean and SD; at least three independent experiments were performed. d qRT-PCR to analyze the mRNA level of hub molecules (CDK1, CCNA2, MCM10, E2F1, HIST1H1A, HIST1H3B and BRCA1) in UBC-transfected hBM-MSCs compared to those in EV-transfected cells. e Morphology and proliferation of UBC- and EV-transfected hBM-MSCs. The images were obtained 4 days and 7 days after subculture. Scale bars, 100 μm

Similar articles

Cited by

References

    1. da Silva Meirelles L, Chagastelles PC, Nardi NB. Mesenchymal stem cells reside in virtually all post-natal organs and tissues. J. Cell. Sci. 2006;119(Pt 11):2204–2213. doi: 10.1242/jcs.02932. - DOI - PubMed
    1. Wang Y, et al. Long-term cultured mesenchymal stem cells frequently develop genomic mutations but do not undergo malignant transformation. Cell Death Dis. 2013;4:e950. doi: 10.1038/cddis.2013.480. - DOI - PMC - PubMed
    1. Oh J, Lee YD, Wagers AJ. Stem cell aging: mechanisms, regulators and therapeutic opportunities. Nat. Med. 2014;20:870–880. doi: 10.1038/nm.3651. - DOI - PMC - PubMed
    1. Sepúlveda JC, et al. Cell senescence abrogates the therapeutic potential of human mesenchymal stem cells in the lethal endotoxemia model. Stem Cells. 2014;32:1865–1877. doi: 10.1002/stem.1654. - DOI - PMC - PubMed
    1. Sensebe L, Gadelorge M, Fleury-Cappellesso S. Production of mesenchymal stromal/stem cells according to good manufacturing practices: a review. Stem Cell Res. Ther. 2013;4:66. doi: 10.1186/scrt217. - DOI - PMC - PubMed

Publication types