. 2018 Jan 30;9(1):427.
doi: 10.1038/s41467-017-02800-w.

Single-cell replication profiling to measure stochastic variation in mammalian replication timing

Affiliations

Single-cell replication profiling to measure stochastic variation in mammalian replication timing

Vishnu Dileep et al. Nat Commun. .

Abstract

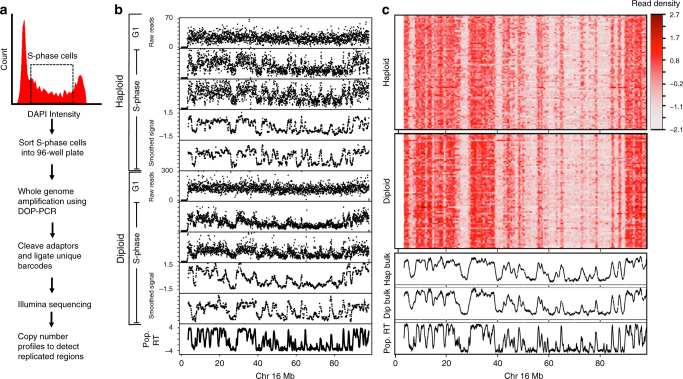
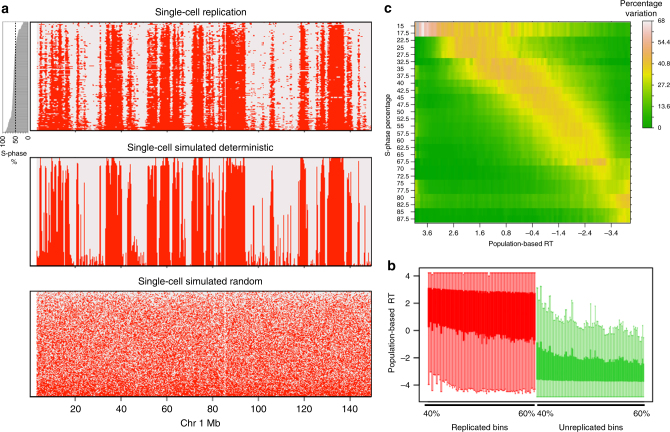
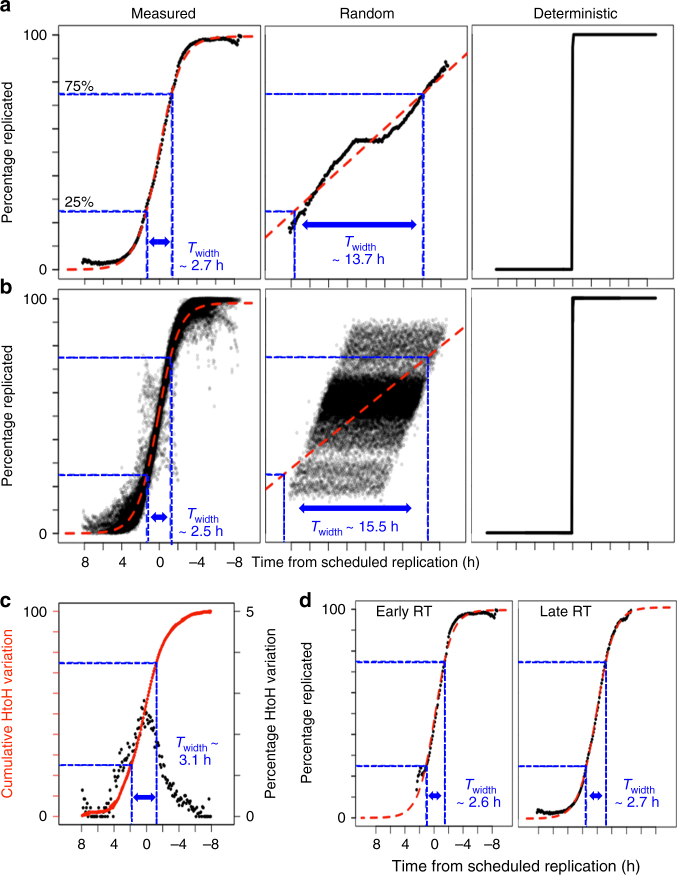
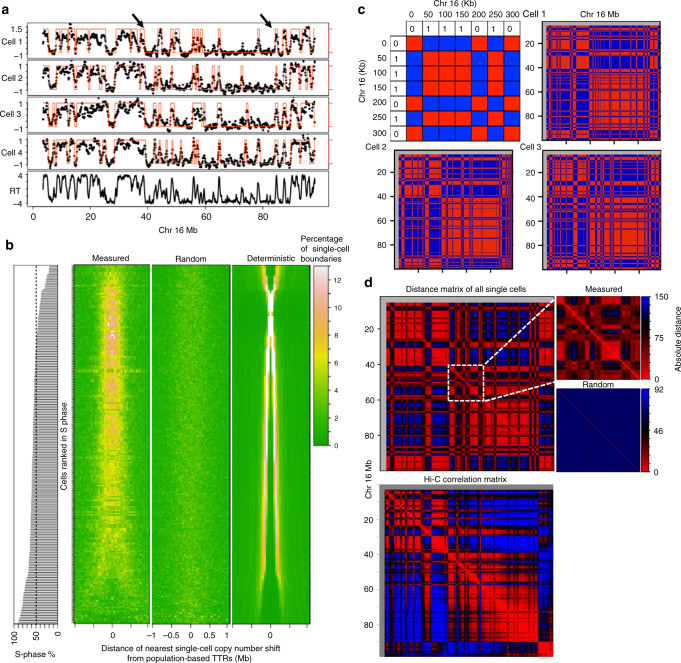
Mammalian DNA replication is regulated via multi-replicon segments that replicate in a defined temporal order during S-phase. Further, early/late replication of RDs corresponds to active/inactive chromatin interaction compartments. Although replication origins are selected stochastically, variation in replication timing is poorly understood. Here we devise a strategy to measure variation in replication timing using DNA copy number in single mouse embryonic stem cells. We find that borders between replicated and unreplicated DNA are highly conserved between cells, demarcating active and inactive compartments of the nucleus. Fifty percent of replication events deviated from their average replication time by ± 15% of S phase. This degree of variation is similar between cells, between homologs within cells and between all domains genomewide, regardless of their replication timing. These results demonstrate that stochastic variation in replication timing is independent of elements that dictate timing or extrinsic environmental variation.


Conflict of interest statement

The authors declare no competing financial interests.

Figures

Fig. 1
Fig. 1
Single-cell replication using copy number variation. a Method for generating single-cell CNV profiles. b Representative single-cell CNV profiles of G1 and S-phase cells in both haploid and diploid hybrid cells. CNV profiles are shown as raw read count in 50 kb bins and after smoothing and corrections. c Heatmap of all single-cell CNV profiles after smoothing and corrections. The bottom three panels show aggregate of haploid single cells, aggregate of diploid single cells, and replication timing measured using population-based Repli-seq in the diploid hybrid cells
Fig. 2
Fig. 2
Binarized single-cell replication. a Binarized replication status in all haploid single cells and homolog-parsed diploid cells. The cells are ranked by their progress in S-phase, which is plotted as a bar plot on the left. The bottom panels show simulated deterministic and random replication for the identical S-phase distribution of single cells (Methods). b Boxplot of population-based replication timing for replicated (red) and unreplicated (green) bins for each single-cell ranked between 40 and 60% S-phase progression. c Heatmap of variability between pairs of cells ranked within one percentile of each other. The Y axis is average S-phase rank of pairs of cells (all pairs ranked within 1% of S phase), measured in intervals of 5% of S-phase progression with a step size of 2.5. The x axis is the replication timing (RT) measured by population-based repli-seq, measured in intervals of 0.1 with a step size of 0.05. The pairwise variability between cells (measured using the binarized data) is the percentage of 50 kb bins where there is a transition in the binary signal for the given S-phase progression interval and population-based RT interval
Fig. 3
Fig. 3
Measuring single-cell replication variability. a Cell-to-cell variability vs. “time from scheduled replication” in hours. The mean across all 50 kb bin positions is plotted for each 0.1 h interval on the x axis and the red line is the sigmoid fit. Control models of random vs. deterministic replication are shown for comparison. b Within cell variability across the genome plotted for each single-cell independently, similar to a. c Homolog-to-homolog variability vs. “time from scheduled replication”. The black scatter plot measures percentage of bins that show homolog asynchrony (right y axis) for each 0.1 h interval on x axis. The overlapping solid and dotted red line are the cumulative sum of the variability and it’s sigmoid fit, respectively (left y axis). d Cell-to-cell variability for early (RT > 0) vs. late replicating regions (RT < 0)
Fig. 4
Fig. 4
Conservation of TTRs and nuclear compartments in single cells. a Binarized single-cell data overlaid on smoothed single-cell CNV profiles. The arrows indicate representative TTRs in population-based data that align with copy number shifts across single cells. b Heatmap showing the distance of the closest single-cell copy number shift from all population-based TTR centers. Each row represents one single-cell and the heat map shows the percentage of closest single-cell copy number shifts in that cell at different distances from the TTR center. The cells are ranked by position is S-phase. c Coordinately regulated bins in each single-cell are color coded red and oppositely regulated bins are color coded blue as shown in the top-left schematic. Whole chromosome plot of single cell from mid-S-phase shows coordinated replication across cells and align with Hi-C compartments (shown in d). d Plotting pairwise absolute distance for all possible pairs of 50 kb bins within each chromosome, using the binary replication status across all cells reveal the functional compartmentalization of replication that show strong similarity to Hi-C compartments plotted using Juicebox. The randomized control of single-cell replication lacks compartments highlighted by plotting a 20 Mb segment of Chr 16

References

    1. Rhind N, Gilbert DM. DNA replication timing. Cold Spring Harb. Perspect. Med. 2013;3:1–26. - PMC - PubMed
    1. Dileep V, Rivera-Mulia JC, Sima J, Gilbert DM. Large-scale chromatin structure-function relationships during the cell cycle and development: insights from replication timing. Cold Spring Harb. Symp. Quant. Biol. 2015;80:53–63. doi: 10.1101/sqb.2015.80.027284. - DOI - PubMed
    1. Lebofsky R, Heilig R, Sonnleitner M, Weissenbach J, Bensimon A. DNA replication origin interference increases the spacing between initiation events in human cells. Mol. Biol. Cell. 2006;17:5337–5345. doi: 10.1091/mbc.E06-04-0298. - DOI - PMC - PubMed
    1. Hamlin JL, et al. A revisionist replicon model for higher eukaryotic genomes. J. Cell. Biochem. 2008;105:321–329. doi: 10.1002/jcb.21828. - DOI - PMC - PubMed
    1. Cayrou C, et al. Genome-scale analysis of metazoan replication origins reveals their organization in specific but flexible sites defined by conserved features. Genome Res. 2011;21:1438–1449. doi: 10.1101/gr.121830.111. - DOI - PMC - PubMed

Publication types