. 2018 Jan 30;8(1):1873.
doi: 10.1038/s41598-018-19522-8.

A novel human induced pluripotent stem cell blood-brain barrier model: Applicability to study antibody-triggered receptor-mediated transcytosis

Affiliations

A novel human induced pluripotent stem cell blood-brain barrier model: Applicability to study antibody-triggered receptor-mediated transcytosis

Maria Ribecco-Lutkiewicz et al. Sci Rep. .

Abstract

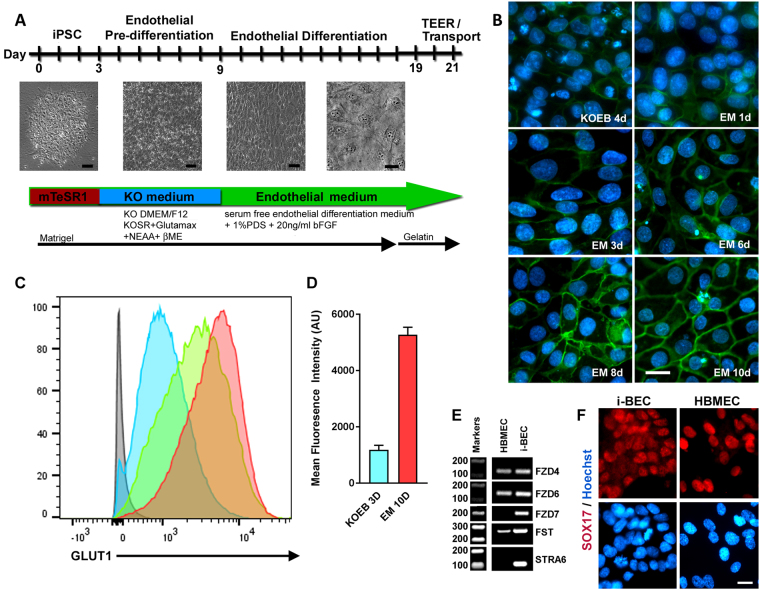
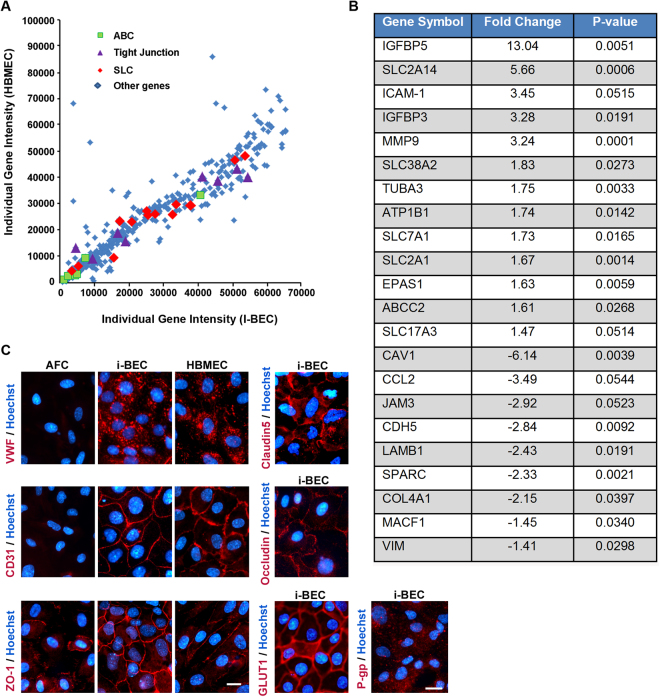
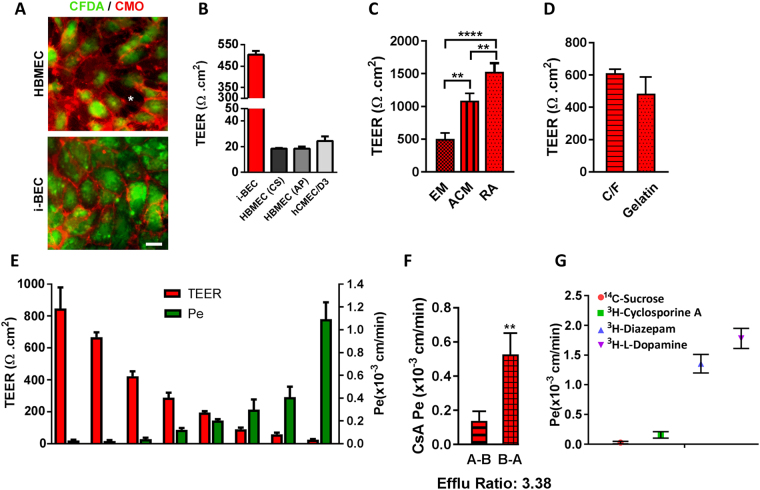
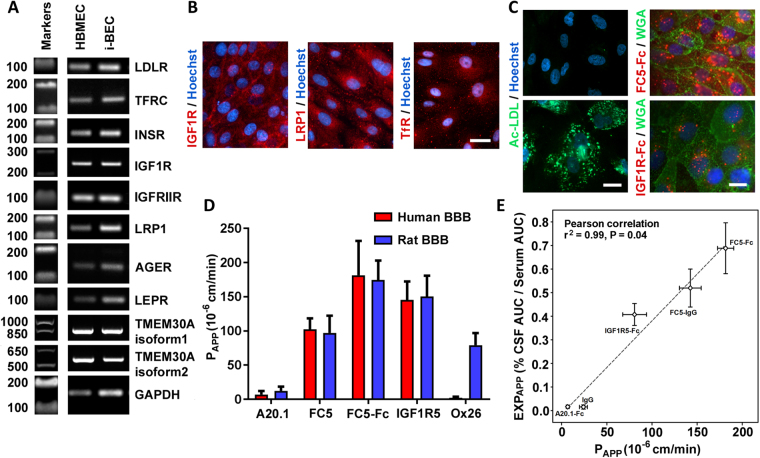
We have developed a renewable, scalable and transgene free human blood-brain barrier model, composed of brain endothelial cells (BECs), generated from human amniotic fluid derived induced pluripotent stem cells (AF-iPSC), which can also give rise to syngeneic neural cells of the neurovascular unit. These AF-iPSC-derived BECs (i-BEC) exhibited high transendothelial electrical resistance (up to 1500 Ω cm2) inducible by astrocyte-derived molecular cues and retinoic acid treatment, polarized expression of functional efflux transporters and receptor mediated transcytosis triggered by antibodies against specific receptors. In vitro human BBB models enable pre-clinical screening of central nervous system (CNS)-targeting drugs and are of particular importance for assessing species-specific/selective transport mechanisms. This i-BEC human BBB model discriminates species-selective antibody- mediated transcytosis mechanisms, is predictive of in vivo CNS exposure of rodent cross-reactive antibodies and can be implemented into pre-clinical CNS drug discovery and development processes.


Conflict of interest statement

The authors declare that they have no competing interests.

Figures

Figure 1
Figure 1
Generation and characterization of induced pluripotent stem cells (iPSCs) derived from amniotic fluid cells (AFCs). (A) Schematic of AF-derived iPSC generation time course. iPSC-like colonies began to emerge at day 8 post-transfection and iPSC colonies were picked and sub-cultured at day 18. (B) Phase contrast image of parental AFCs (top panel) and the established AF-derived iPSC colony (bottom panel) which shows a typical embryonic stem cell-like morphology in feeder-free conditions. (C) Alkaline phosphatase staining of established iPSC colonies shows positive alkaline phosphatase activity in mTeSR1 maintenance conditions. (D) Immunofluorescence staining demonstrating the expression of pluripotency-associated markers OCT4, NANOG, SOX2, and KLF4 in iPSCs compared to parental AFCs. (E) Representative cropped western blot comparing the expression of OCT4, NANOG, SOX2 and KLF4 in AFCs, iPSCs and control NT2 cells. Fold-change increase in expression levels of OCT4, SOX2 and NANOG in iPSCs relative to AFCs is shown (mean ± SEM). (F) Immunofluorescence staining of human embryonic stem cell-specific surface antigens SSEA3 and SSEA4 in iPSCs compared to AFCs. (G) Confirmation of fully reprogrammed state of iPSCs by the concomitant expression of TRA-1-81, OCT4 and CD30. Nuclei counterstained with Hoechst. Scale bar, 20 µm and 40 µm (top panel 1 G).
Figure 2
Figure 2
Differentiation of AF-iPSCs into induced neural progenitors (i-NPs) and functional neurons (i-Ns). (A) Immunofluorescence staining of i-NPs negative for OCT4 staining and positive for neural progenitor markers SOX2, NESTIN and PAX6. (B) Representative cropped western blot confirming increase in expression of PAX6, SOX2 and NESTIN in i-NPs compared to AFCs. Human neural progenitor cells (hNP1) and NT2 cells were used as positive controls. Under specific neural induction conditions (see Methods), the i-NPs gave rise to syngeneic (C) GFAP positive astrocytes and (D) MAP2 positive neurons. (E) Phase contrast images of representative morphology of iPSCs (top panel) in maintenance culture and i-Ns following neuronal differentiation. The mature neurons acquired characteristic neuronal morphology with defined cell bodies and branching neurite extensions (lower panel). Immunofluorescence staining for several neuronal markers including βIII-TUBULIN, NCAM, NeuN, VGLUT1, VGLUT2, SYNAPTOTAGMIN and SYNAPTOPHYSIN expressed in mature i-Ns. (F) Electrophysiological properties of i-Ns was assessed using typical voltage responses to a series of current pulses (bottom traces) applied at resting membrane potential (Vm rest) of -80 mV. Action potentials were evoked by depolarizing current pluses. Top right inset (dotted square) shows magnification of fast and slow after-hyperpolarization (Ihap) of an evoked action potential. (G) Voltage responses to a 0.03 nA current step in absence (black trace) and presence of 1 µM tetrodotoxin (TTX; red trace), a potent sodium blocker which inhibits spiking activity. All recordings were obtained using the whole-cell patch-clamp technique in current clamp mode. Representative traces from individual neurons are shown (n = 8). Nuclei counterstained with Hoechst. Scale bar, 20 µm.
Figure 3
Figure 3
Differentiation of AF-iPSCs into induced brain endothelial cells (i-BECs). (A) Schematic of AF- iPSC BEC directed differentiation process depicting the transitional stages of i-BEC monolayer differentiation. (B) Representative immunofluorescence depicting temporal GLUT1 expression during pre-differentiation and endothelial differentiation and specification in KOEB and EM medium, respectively. Days (d) in each differentiation medium are shown. (C) Flow cytometry histograms depicting the increase in mean fluorescence intensity of GLUT1 expression during different stages of differentiation (3D KOEB, blue; 3D EM, green and 10D EM, red). Grey histogram depicts unstained cells. (D) Quantitation of mean fluorescence intensity (arbitrary units, AU) of GLUT1 expression is shown during KOEB 3D and EM 10D differentiation timeframe (mean ± SD, n = 3). Results are representative of at least two independent differentiations. (E) Cropped gel electrophoresis of RT-PCR products for transcripts encoding Wnt-β-catenin signaling intermediates involved in BBB specification such as: FZD4, FZD6, FZD7, FST and STRA6 in i-BECs and HBMECs. (F) Ubiquitous expression of SOX17, a Wnt-β-catenin downstream signaling target, in i-BECs and HBMECs. Nuclei counterstained with Hoechst. Scale bar, 20 µm.
Figure 4
Figure 4
BBB and endothelial specific gene expression in i-BECs. (A) A comparative gene microarray analysis comparing the individual gene intensity signals (arbitrary units) of 434- BBB and endothelium-specific genes between HBMEC (y-axis) and i-BECs (x-axis). Scatter plot demonstrates a similar expression profile between both cell types, specifically in ABC transporters (green squares), tight junctions (purple triangles) and SLC transporters (red diamonds) transcripts (Pearson Correlation, r2 = 0.86, p = 0.001). (B) Table compiling a list of differentially expressed transcripts in i-BECs when compared to HBMECs. Statistical significant was determined using Student’s T-Test, (*p ≤ 0.05) and a 1.35 fold change in ratio was used to generate the gene list. (C) Representative immunofluorescence staining of i-BECs for vWF, Claudin-5, CD31 (PECAM-1), Occludin, ZO-1, GLUT1 and P-gp. HBMECs were used as a positive control. All characterizations were carried out at day 21 of EM differentiation. Nuclei counterstained with Hoechst. Scale bar, 20 µm.
Figure 5
Figure 5
Functional characterization of the i-BECs. (A) Live staining of i-BEC and HBMEC cultures with CFDA (cellular viability) and CellMask Orange (plasma membrane) to visually assess the maintenance of continuous tight junctions. Intracellular gaps, indicative of poor BBB integrity, are easily visualized as seen in HBMEC cultures (asterisk, left panel) compared to the tight barrier integrity observed in i-BEC cultures (right panel). (B) Transendothelial electrical resistance (TEER, Ωcm2) of confluent i-BECs monolayer cultures on gelatin coated Transwell inserts. Higher TEER was observed in the i-BECs compared to HBMECs (CS and AP) as well as immortalized hCMEC/D3 (mean ± SD). (C) Enhanced TEER in i-BECs following 24 hr co-culture in astrocyte conditioned medium (ACM) and treatment with 10 µM all-trans retinoic acid (RA) compared to EM maintenance culture (mean ± SD, One-Way ANOVA **p < 0.01, ****p < 0.0001). (D) Comparison of TEER between i-BECS seeded onto gelatin and collagen/fibronectin (C/F) coated Transwell inserts (mean ± SD). (E) Comparison between TEER values (left y-axis) and 14C-Sucrose permeability coefficient (Pe, right y-axis) in i-BECs. Values are mean ± SD for each compound measured in 11 independent inserts from at least 8 biological replicates with varying TEER levels acquired during protocol optimization. The means reflect variability from differentiation to differentiation during protocol optimization steps. (F) Permeability values of Cyclosporine A (CsA) from apical to basolateral (A-B) and basolateral to apical (B-A) compartments. Efflux ratio (B-A/A-B) for CsA shown as 3.38. (mean ± SD, Student’s T-test **p < 0.01). (G) Functional i-BEC transporter activity was assessed by measuring apical to basolateral permeability (Pe) using radiolabeled small molecules: 14C-Sucrose, 3H-Cyclosporine A, 3H-Diazepam and 3H- l-Dopamine. Values are mean ± SD for each compound measured in at least 3 inserts. Results are representative of at least two independent differentiations. Nuclei counterstained with Hoechst. Scale bar, 20 µm.
Figure 6
Figure 6
Functional receptor mediated transcytosis in i-BECs. (A) RT-PCR detection of receptor mediated transport (RMT) receptor transcripts including LDLR, TfR, INSR, IGF1R, IGFIIR, LRP1, AGER, LEPR and TMEM30A, isoform 1and 2 expressed in i-BECs compared to HBMECs. Cropped gels shown. (B) Immunofluorescence staining of i-BECs confirming expression of IGF1R, LRP1 and TfR. Scale bar, 20 µm. (C) Receptor mediated endocytosis of acetylated low-density lipoprotein (Ac-LDL), FC5-Fc and IGF1R5-Fc. Plasma membrane stained with Wheat-germ agglutinin (WGA). Scale bar, 20 µm (left panel) and 10 µm (right panel). Nuclei counterstained with Hoechst. (D) The in vitro apparent permeability coefficient (PAPP) was assessed for FC5-IgG (FC5), FC5-Fc, IGF1R5 and Ox26 as well as negative control A20.1 antibodies in human i-BEC and rat SV-ARBEC BBB models. (E) Correlation of PAPP values obtained in the i-BEC BBB model with the apparent CNS exposure (EXPAPP) for FC5-IgG, FC5-Fc, IGF1R5-Fc and control (A20.1-Fc, IgG) antibodies. EXPAPP is derived from simultaneous pharmacokinetic measurements of antibodies in CSF (serial sampling) and in the serum (AUCCSF/AUCserum) in the rat. The results show a significant correlation (Pearson correlation, r2 = 0.96, p = 0.04) among in vitro PAPP and in vivo EXPAPP (CNS) for this set of antibodies. Data are mean ± SD of repeated measurements from 3 to 10 in vitro BBB model assemblies and from 3 to 6 animals in each group.

Similar articles

Cited by

References

    1. Arrowsmith J, Miller P. Trial watch: phase II and phase III attrition rates 2011-2012. Nat Rev Drug Discov. 2013;12:569. doi: 10.1038/nrd4090. - DOI - PubMed
    1. Dawson GR, Dourish CT, Goodwin GM. Special issue on CNS experimental medicine. J Psychopharmacol. 2011;25:1145–1147. doi: 10.1177/0269881111415342. - DOI - PubMed
    1. Palmer AM, Alavijeh MS. Translational CNS medicines research. Drug Discov Today. 2012;17:1068–1078. doi: 10.1016/j.drudis.2012.05.001. - DOI - PubMed
    1. Gabathuler R. Approaches to transport therapeutic drugs across the blood-brain barrier to treat brain diseases. Neurobiol Dis. 2010;37:48–57. doi: 10.1016/j.nbd.2009.07.028. - DOI - PubMed
    1. Neuwelt EA, et al. Engaging neuroscience to advance translational research in brain barrier biology. Nat Rev Neurosci. 2011;12:169–182. doi: 10.1038/nrn2995. - DOI - PMC - PubMed

MeSH terms