. 2018 Jan 30;8(1):1879.
doi: 10.1038/s41598-018-19767-3.

Neuroprotective Drug for Nerve Trauma Revealed Using Artificial Intelligence

Affiliations

Neuroprotective Drug for Nerve Trauma Revealed Using Artificial Intelligence

David Romeo-Guitart et al. Sci Rep. .

Abstract

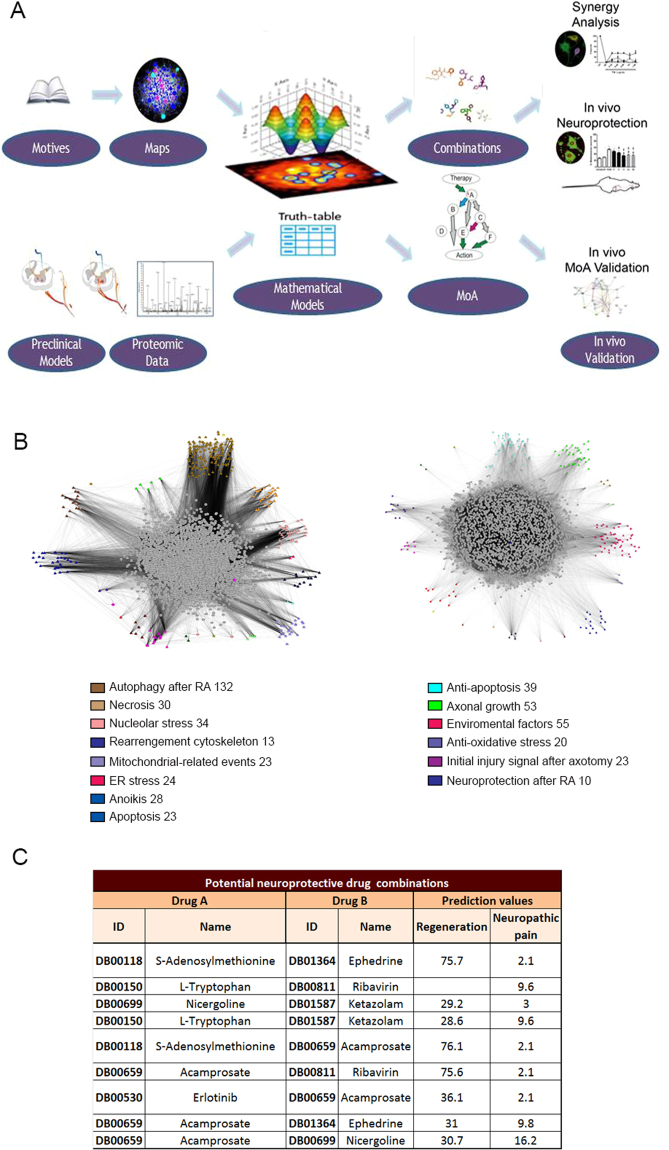
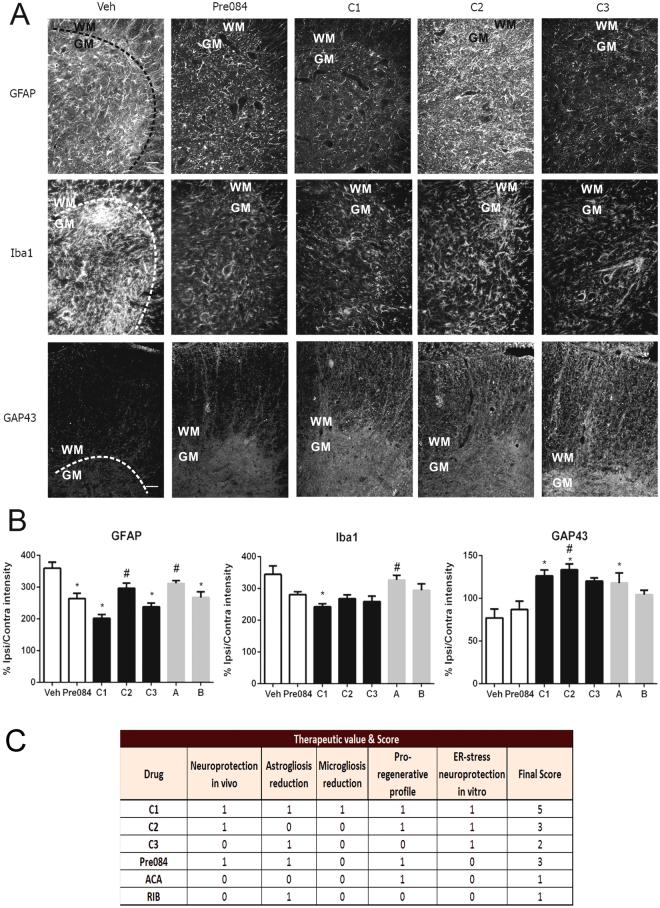
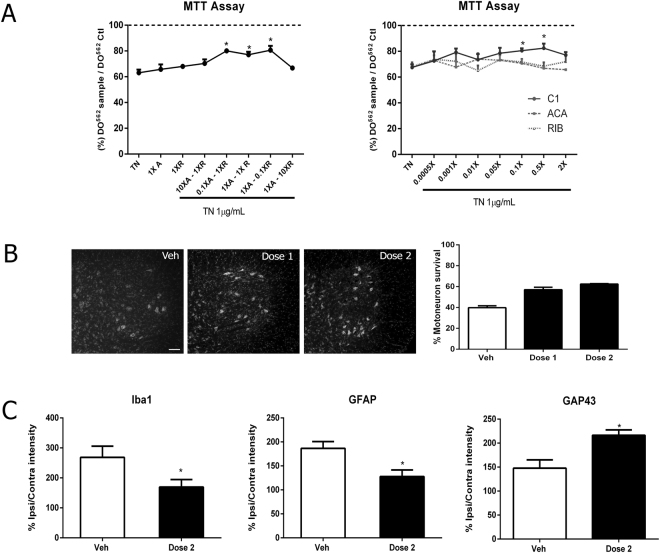
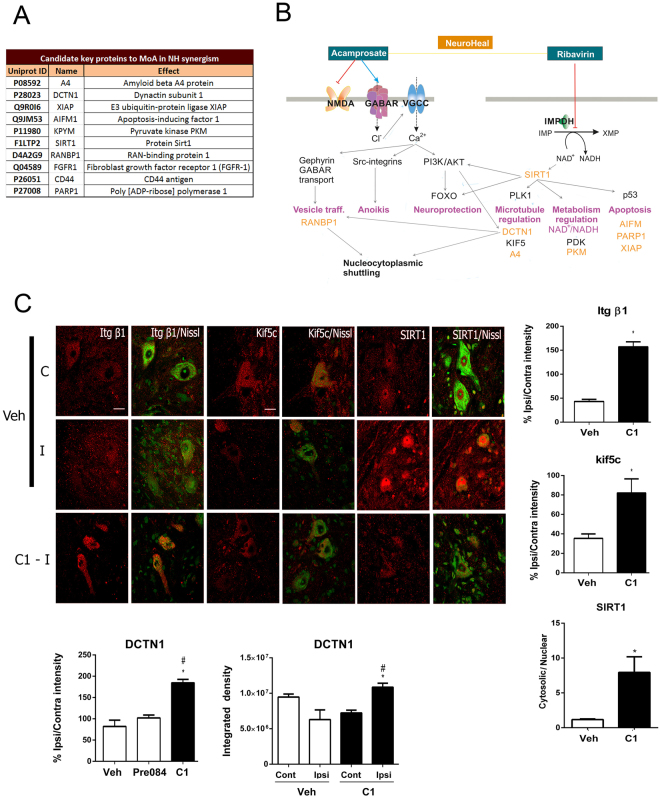
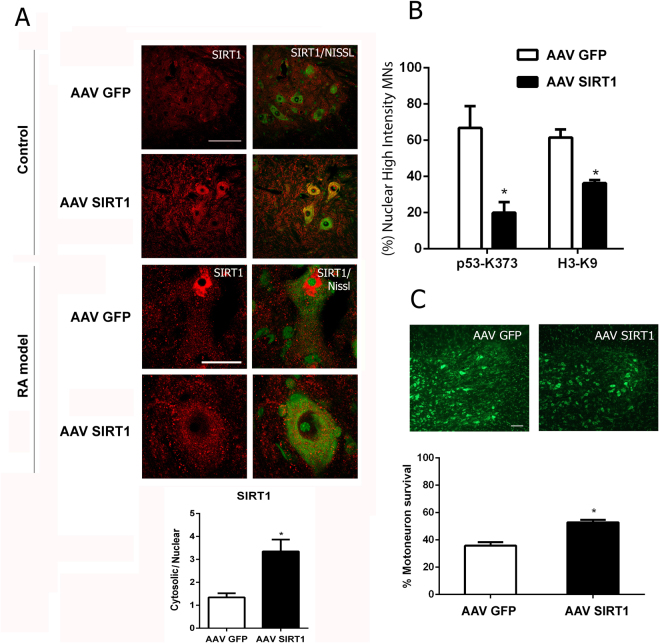
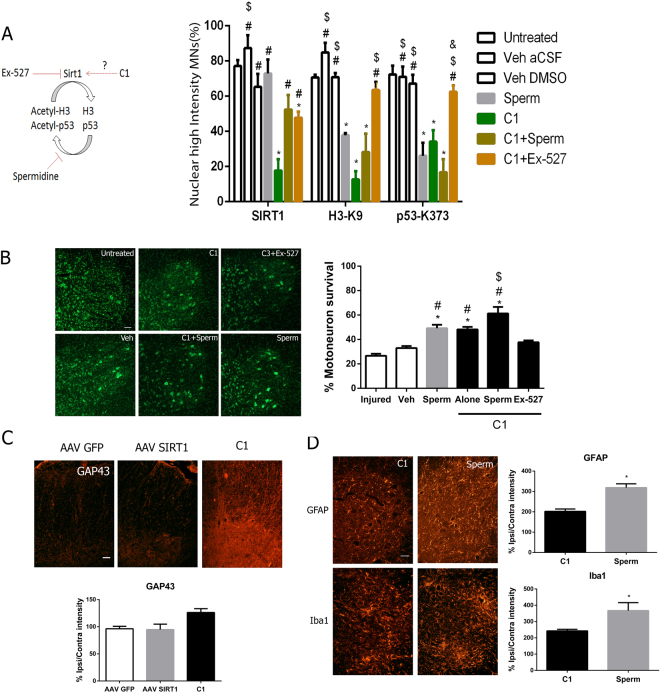
Here we used a systems biology approach and artificial intelligence to identify a neuroprotective agent for the treatment of peripheral nerve root avulsion. Based on accumulated knowledge of the neurodegenerative and neuroprotective processes that occur in motoneurons after root avulsion, we built up protein networks and converted them into mathematical models. Unbiased proteomic data from our preclinical models were used for machine learning algorithms and for restrictions to be imposed on mathematical solutions. Solutions allowed us to identify combinations of repurposed drugs as potential neuroprotective agents and we validated them in our preclinical models. The best one, NeuroHeal, neuroprotected motoneurons, exerted anti-inflammatory properties and promoted functional locomotor recovery. NeuroHeal endorsed the activation of Sirtuin 1, which was essential for its neuroprotective effect. These results support the value of network-centric approaches for drug discovery and demonstrate the efficacy of NeuroHeal as adjuvant treatment with surgical repair for nervous system trauma.


Conflict of interest statement

M.C. and R.V. are employees and J.M.M. is founder and C.E.O. of Anaxomics Biotech. J.M.M. contributed to the design of TPMS. The other authors D.R., J.F., M.H.G., T.L.R., E.G., F.R.P., X.N., V.P., A.B., and C.C. declare no competing interests. NeuroHeal is currently under patent review.

Figures

Figure 1
Figure 1
Experimental design. (A) The starting material was a manually curated list of key proteins clustered in motives that allowed construction of condition-specific networks for neurodegeneration after RA and for neuroprotection after DA. Using TPMS, network static maps were converted into topological maps associated with mathematical equations. The available data from unbiased proteomic analysis generated from RA and DA models (Casas et al., 2015) was used to build a set of restrictions collated into a truth table with which all models generated had to comply. Drug screening in silico was used to perturb the neurodegeneration-associated mathematical model and drug combinations that approximated the model to the neuroprotective state were identified. The algorithms used also allowed specification of key proteins involved in the mode of action (MoA) of each drug combination. Finally, we validated new combinations for its neuroprotective effect and putative MoA in vivo and in vitro. (B) Snapshots of the full protein networks associated with the neurodegenerative condition after RA (left, 3,836 nodes, average links per node 13.4) and with the neuroprotective condition after DA (right, 3,296 nodes, average links per node 13.9) visualized through the Cytoscape software platform. Seed proteins for different motives are labelled by colour as indicated. Some seeds belong to more than one motive. (C) List of potential neuroprotective drug combinations identified using the in silico screen.
Figure 2
Figure 2
Neuroprotection by drug combinations identified in silico. (A) Bar graph showing the percentage of cell survival ± SEM after treatment with different doses of TN, which causes ER stress, to establish the optimal concentration to be used in vitro (fixed at 1 µg/ml TN). Neurotoxicity was evaluated with an MTT assay on differentiated NSC-34 MN-like cells in the absence of treatment (control, ctrl) or vehicle (veh) or presence of a single drug (Pre084, ACA, Rib, SAM, or EPHE or drug combinations (C1-C3) analysed 24 h after adding treatments (n = 3–8, *p < 0.05 vs. vehicle, #p < 0.05 vs. 1 µg/ml TN). (B) Top, representative microphotographs of spinal cord ventral horns at L4-L5 from sham-operated control or the ipsilateral side of RA animals stained with fluorescent Nissl. Animals were intrathecally treated using programmable infusion pumps with either vehicle (artificial cerebrospinal fluid), PRE084 (positive control), single drugs, or combination of drugs: C1 = ACA (drug A) + RIB (drug B); C2 = EPHE + ACA; and C3 = SAM + EPHE. Scale bar = 100 µm. Bottom, bar graph of the average relative number of surviving motoneurons ± SEM on the ipsilateral side with respect to the contralateral side after 21 days post injury (dpi; n = 3 for Sham, PRE084, C3; n = 6 for injured; n = 4 for other groups, ANOVA, post hoc Bonferroni *p < 0.05 vs. vehicle, #p < 0.05 vs. PRE084, $p < 0.05 vs. C1). (C) Microphotographs of ChAT immunohistochemistry in the ventral horn MNs from RA animals treated with vehicle (veh) or with a non-related drug combination of Mef and Ali at 14 dpi. Ali increases expression of ChAT. Bar graph of immunoreactivity intensity per area within MNs (Nissl-positive). (n = 3). (D) Representative microphotographs of MNs of the ipsilateral ventral horn stained by Nissl. Bar graph showing the average number of MNs ± SEM on the ipsilateral with respect to the contralateral side of spinal cord from animals treated with either vehicle or the combination of Mef and Ali at 21 dpi. (n = 3).
Figure 3
Figure 3
All drug combinations reduce microgliosis and astrogliosis and promote neuronal regeneration. (A) Representative fluorescence microphotographs at low magnification of the ipsilateral ventral horns of the spinal cord from RA injured animals treated with vehicle (Veh), Pre084, or drug combinations (C). Top and middle panels, staining for astrocytes (GFAP) and (middle panel) microglia (Iba1), respectively, in grey matter (GM)—delimited with dashed lines. Bottom panels, GAP43-positive neurites at the white matter (WM) of the ipsilateral ventral horns. Scale bar = 100 μm. (B) Bar graph of average immunoreactivity intensities in GM for GFAP and Iba1 and in WM for GAP43 (*p < 0.05 vs. Veh, #p < 0.05 vs. C1). (n = 4). (C) Table summarizing dichotomy scores for MN survival, gliosis, and pro-regenerative effects in vivo and neuroprotective effects in vitro (1 is beneficial effect and 0 indicated no effect).
Figure 4
Figure 4
NeuroHeal has a supra-additive neuroprotective effect and is effective upon oral administration. (A) Left, Bar graph of NSC-34 cell survival upon ER stress measured by MTT assay at different dose ratios of ACA (A; 1X = 0.22 mM) to RIB (R; 1X B = 4 µM). Right, Effect of range of doses within 0–2X with NeuroHeal or with single drugs at 1X (p < 0.05 with respect to TN alone). (B) Representative microphotographs of MNs stained by Nissl at the ipsilateral ventral horns of RA animals treated orally with either vehicle or dose 1 (0.22 mM ACA + 0.4 µM RIB) or dose 2 (0.06 mM ACA + 1 µM RIB), and bar graph of the percentage of surviving MN cells at the ipsilateral side with respect to the contralateral side. (n = 4). (C) Bar graph of average immunoreactivity intensity for GFAP, Iba1, and GAP43 in a fixed region of interest in the ipsilateral ventral horn in grey matter for GFAP and Iba1 staining or white matter for GAP43 (n = 4; *p < 0.05 vs. vehicle).
Figure 5
Figure 5
NeuroHeal accelerates nerve regeneration and improves muscle reinnervation and functional recovery after nerve crush injury. (A) Left panels, mean amplitudes of CMAP from ipsilateral gastrocnemius and plantar muscles after sciatic nerve crush of animals treated with vehicle (Veh) or NeuroHeal (C1; n = 5, ANOVA, post hoc Bonferroni*p < 0.05 vs. Veh). Right panels, representative recordings. (B) Histogram of the percentages of treated animals that presented electrophysiological evidence of reinnervation at the plantar muscle at different time-points. (C) Left, Plot of the sciatic functional index (SFI) obtained with walking track analysis of sciatic nerve in RA animals treated with either vehicle (Veh) or NeuroHeal (C1). Right, Representative footprints from ipsi- and contralateral paws at 35 days post injury (dpi). (D) Left, bar graph showing the percentage of reinnervated motor endplates at plantar muscle. Right, representative pictures of reinnervated neuromuscular junctions showing nerve fibers immunostained by NF200 (red) and end-plates labeled with bungarotoxin (green). (n = 4). (E) Microphotographs of spinal MNs stained with Nissl green at the ventral horn showing no signs of cell death due to nerve crush at 3 weeks post-injury.
Figure 6
Figure 6
Molecular targets of NeuroHeal. (A) List of seed proteins predicted to be key synergic targets in the action of NeuroHeal. (B) Representation of putative NeuroHeal MoA from initial ACA and RIB targets to downstream possible effects to yield the synergic effects (pink) through its targets (orange). Representation is based on analysis using STRING and IntAct platforms and manual scrutiny of relevant literature. (C) Left, microphotographs of ipsilateral (I) and contralateral (C) ventral horns immunostained to reveal Itgb1, Kif5c, and SIRT1 in MNs (red) counterstained with green fluorescent Nissl (merged pictures) in animals treated with vehicle (Veh) or NeuroHeal (C1). Scale bar = 50 μm. Right and Bottom, bar graphs of the average ratios of immunofluorescence intensity (IF) between ipsi- and contralateral sides within an equivalent pre-determined region of interest (ROI) localized in the lateral grey matter for all conditions except for DCTN1, which was measured in the white matter (n = 4 animals, 5 MN/section, 3 sections, *p < 0.05). The bottom right histogram of DCTN1 analysis shows the quantification of total integrated intensity on each side to document that NeuroHeal only changes expression on the injured site (n = 4 animals, 5 MN/section, 3 sections, *p < 0.05).
Figure 7
Figure 7
SIRT1 overexpression promotes MN survival after RA. (A) Top, representative microphotographs of SIRT1 immunolabelling (red) in infected MNs in control animals (upper) and RA injured animals (lower) treated with either AAVrh10-GFP or AAVrh10-SIRT1 and counterstained with green fluorescent Nissl. Scale bar = 100 µm (top); 25 µm (bottom). Bottom, histogram of cytosolic versus nuclear SIRT1 localization in the RA-injured MNs 21dpi after damage. (B) Histogram of the percentage of avulsed MNs with high nuclear immunofluorescence intensity for each acetylated form of either H3 (H3-K9) or p53 (p53-K373) at the ipsilateral side of RA animals infected with either vector (n = 4, *p < 0.05 vs. AAV-GFP). (C) Representative microphotographs of Nissl-labelled MNs (green) at the ipsilateral ventral horns of RA animals treated with either AAVrh10-GFP or AAVrh10-SIRT1and histogram of MN survival ± SEM expressed as % of MN on the contralateral side (contra) (n = 4, *p < 0.05 vs. AAVrh10-GFP).
Figure 8
Figure 8
SIRT1 mediates the neuroprotective effect of NeuroHeal. (A) Diagram of the mechanisms of action of spermidine and Ex-527 and bar graph of the percentage of avulsed MNs with high nuclear immunofluorescence intensity for each marker on the ipsilateral side of RA animals treated with different drugs (n = 6 for untreated; n = 3 for Veh DMSO; n = 4 other groups, ANOVA, post hoc Bonferroni*p < 0.05 vs, #p < 0.05 vs. C1, $p < 0.05 vs. C1 + Sperm, &p < 0.05 vs. Sperm). (B) Representative microphotographs of MNs on the ipsilateral sides and associated histogram of the average percentage of MN survival ± SEM in animals intrathecally treated with spermidine (Sperm) or Ex-527 with or without NeuroHeal (C1) (n = 4, ANOVA, post hoc Bonferroni *p < 0.05 vs. untreated, #p < 0.05 vs. veh, $p < 0.05 vs. C1 + Ex-527, *p < 0.05). Scale bar = 100 μm. (C) Microphotographs of GAP43 immunostaining at the ventral horns of the ipsilateral sides from animals treated with either AAVrh10-GFP, AAVrh10-SIRT1 or C1. Scale bar = 100 µm. Bar graph of the average immunoreactivity in a fixed region of interest of the white matter (n = 3–4, *p < 0.05 vs. AAVrh10-GFP). (D) Representative microphotographs of astrocyte (GFAP) or microglia (Iba1) staining at the ventral horns of the ipsilateral sides of RA animals treated with either NeuroHeal (C1) or spermidine (Sperm). Scale bar = 100 μm. Associated bar graphs of the average immunoreactivity in a fixed region of interest of the grey matter (*p < 0.05 vs. C1).

Similar articles

Cited by

References

    1. Herrando-Grabulosa M, et al. Novel Neuroprotective Multicomponent Therapy for Amyotrophic Lateral Sclerosis Designed by Networked Systems. PLoS One. 2016;11:e0147626. doi: 10.1371/journal.pone.0147626. - DOI - PMC - PubMed
    1. Dias JJ, Garcia-Elias M. Hand injury costs. Injury. 2006;37:1071–7. doi: 10.1016/j.injury.2006.07.023. - DOI - PubMed
    1. Berman JS, Birch R, Anand P. Pain following human brachial plexus injury with spinal cord root avulsion and the effect of surgery. Pain. 1998;75:199–207. doi: 10.1016/S0304-3959(97)00220-0. - DOI - PubMed
    1. Cohen SP, Mao J. Neuropathic pain: mechanisms and their clinical implications. BMJ. 2014;348:f7656. doi: 10.1136/bmj.f7656. - DOI - PubMed
    1. Penas C, Casas C, Robert I, Fores J, Navarro X. Cytoskeletal and activity-related changes in spinal motoneurons after root avulsion. J Neurotrauma. 2009;26:763–779. doi: 10.1089/neu.2008.0661. - DOI - PubMed

Publication types

Substances