. 2018 Jan 30;8(1):1848.
doi: 10.1038/s41598-018-20087-9.

Sub-parts-per-trillion level sensitivity in trace gas detection by cantilever-enhanced photo-acoustic spectroscopy

Affiliations

Sub-parts-per-trillion level sensitivity in trace gas detection by cantilever-enhanced photo-acoustic spectroscopy

Teemu Tomberg et al. Sci Rep. .

Abstract

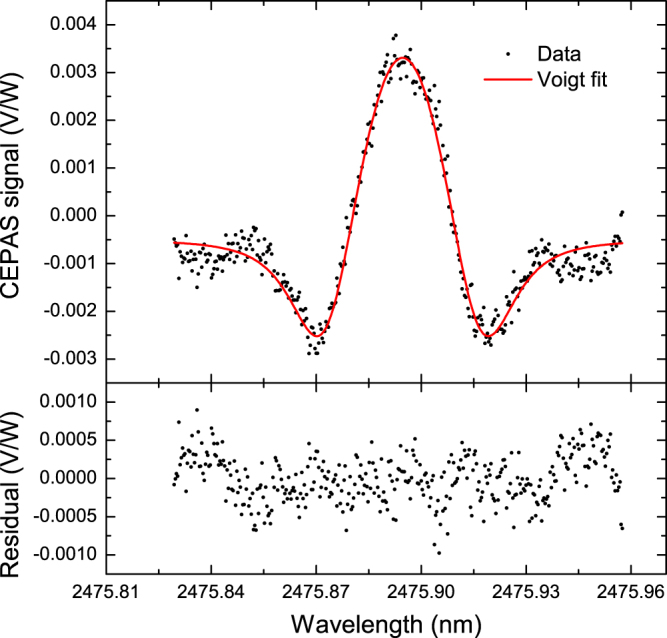
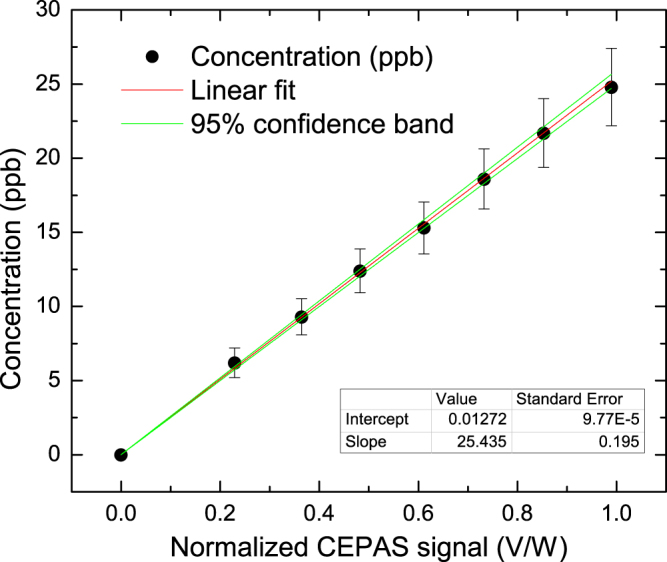
An exceptional property of photo-acoustic spectroscopy is the zero-background in wavelength modulation configuration while the signal varies linearly as a function of absorbed laser power. Here, we make use of this property by combining a highly sensitive cantilever-enhanced photo-acoustic detector, a particularly stable high-power narrow-linewidth mid-infrared continuous-wave optical parametric oscillator, and a strong absorption cross-section of hydrogen fluoride to demonstrate the ability of cantilever-enhanced photo-acoustic spectroscopy to reach sub-parts-per-trillion level sensitivity in trace gas detection. The high stability of the experimental setup allows long averaging times. A noise equivalent concentration of 650 parts-per-quadrillion is reached in 32 minutes.


Conflict of interest statement

The authors declare that they have no competing interests.

Figures

Figure 1
Figure 1
Schematic illustration of the experimental configuration. PS: pump laser source, L1: lens with f = 200 mm, L2: lens with f = 150 mm, E: two etalons, EXFO: wavemeter, PR: equilateral dispersive prism, G1: gold coated mirror with R = 200 mm, S1: silver coated mirror with R = 50 mm, P1: power meter, PA: photo-acoustic analyzer, HF: hydrogen fluoride gas in dry air.
Figure 2
Figure 2
The upper figure shows a second harmonic signal of 97 ppt HF in dry air, measured with an optical power of 740 mW, and a least squares fit of the second harmonic signal of a Voigt profile to the data. The lower figure shows the residual after subtraction of the fit. The background offset is attributed to tails of nearby water absorption, the water concentration being 1010 ppm.
Figure 3
Figure 3
CEPAS signal as a function of HF concentration and a linear fit to the data. The measurement was performed using an optical power of 740 mW. Uncertainties of the MFCs and the concentration of the sample bottle are included.
Figure 4
Figure 4
Allan deviation of the HF volume mixing ratio as a function of averaging time. The inset shows the measurement data, obtained with an optical power of 950 mW. The slopes of the ‘laser on’ and ‘laser off’ Allan deviation traces are −0.28 and −0.5, respectively.
Figure 5
Figure 5
Ranking graph of noise equivalent concentrations for photo-acoustic techniques, expressed in ppt and normalized to 1 s detection time and averaging indicated by an arrow if reported. The NECs (up to 1 ppb) are related to 5 different techniques (letter) and 6 different molecules (color). References are given in brackets. See Supplementary Table 1 for additional information of these results.

References

    1. Koskinen V, Fonsen J, Kauppinen J, Kauppinen I. Extremely sensitive trace gas analysis with modern photoacoustic spectroscopy. Vib. Spectrosc. 2006;42:239–242. doi: 10.1016/j.vibspec.2006.05.018. - DOI
    1. Koskinen V, Fonsen J, Roth K, Kauppinen J. Cantilever enhanced photoacoustic detection of carbon dioxide using a tunable diode laser source. Appl. Phy. B: Lasers & Opt. 2007;86:451–454. doi: 10.1007/s00340-006-2560-z. - DOI
    1. Kosterev AA, Bakhirkin YA, Curl RF, Tittel FK. Quartz-enhanced photoacoustic spectroscopy. Opt. Lett. 2002;27:1902–1904. doi: 10.1364/OL.27.001902. - DOI - PubMed
    1. Wu H, et al. Beat frequency quartz-enhanced photoacoustic spectroscopy for fast and calibration-free continuous trace-gas monitoring. Nat. Commun. 2017;8:15331. doi: 10.1038/ncomms15331. - DOI - PMC - PubMed
    1. Hippler M, Mohr C, Keen KA, McNaghten ED. Cavity-enhanced resonant photoacoustic spectroscopy with optical feedback cw diode lasers: A novel technique for ultratrace gas analysis and high-resolution spectroscopy. The J. Chem. Phy. 2010;133:044308. doi: 10.1063/1.3461061. - DOI - PubMed

Publication types