. 2018 Jan 30;8(1):1898.
doi: 10.1038/s41598-018-20287-3.

Human Skeletal Muscle Possesses an Epigenetic Memory of Hypertrophy

Affiliations

Human Skeletal Muscle Possesses an Epigenetic Memory of Hypertrophy

Robert A Seaborne et al. Sci Rep. .

Abstract

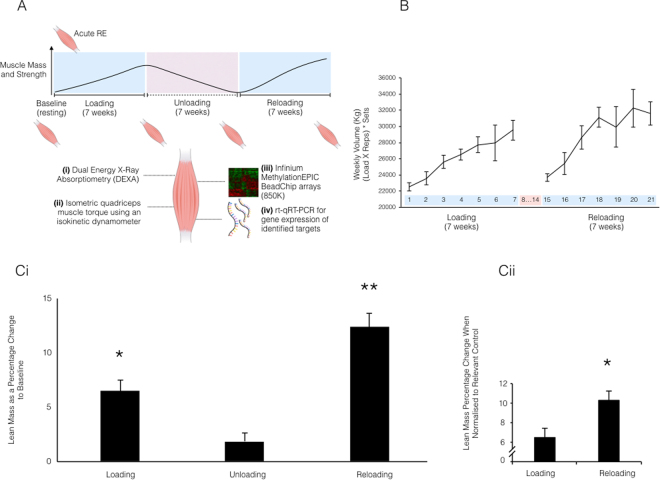
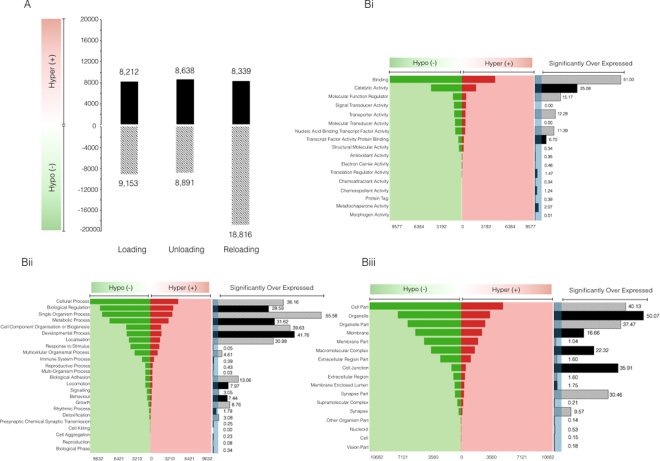
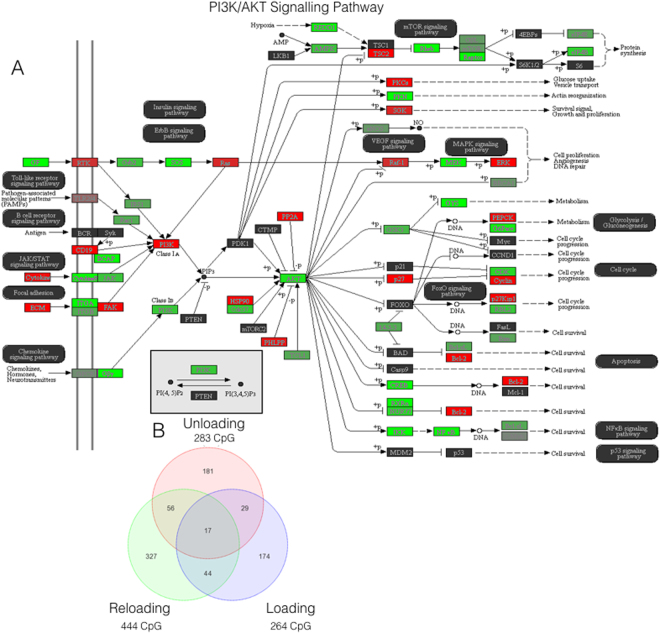
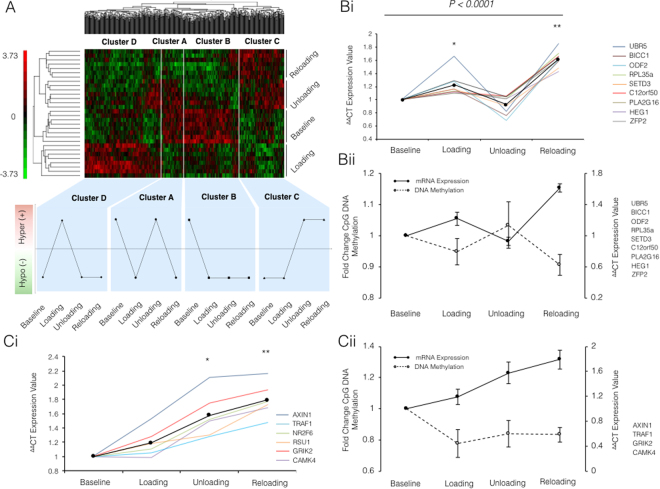
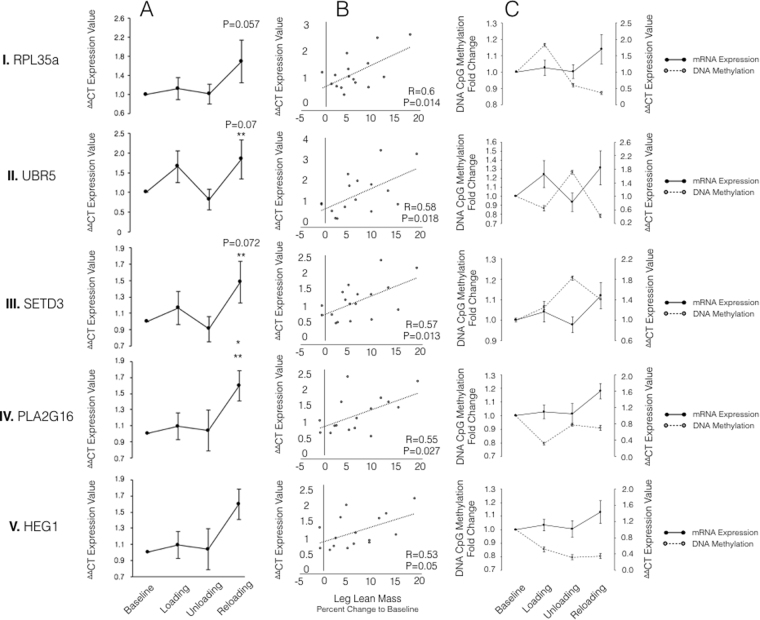
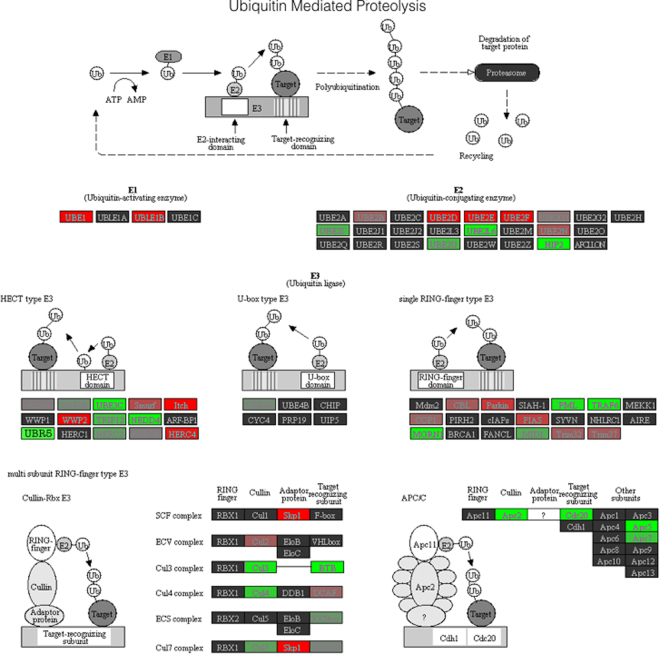
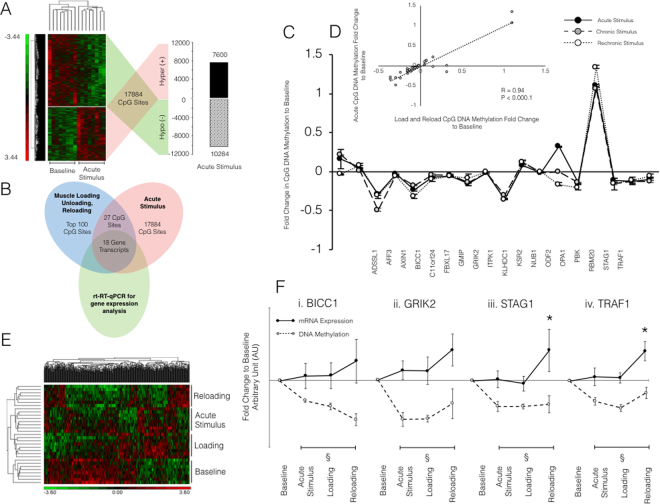
It is unknown if adult human skeletal muscle has an epigenetic memory of earlier encounters with growth. We report, for the first time in humans, genome-wide DNA methylation (850,000 CpGs) and gene expression analysis after muscle hypertrophy (loading), return of muscle mass to baseline (unloading), followed by later hypertrophy (reloading). We discovered increased frequency of hypomethylation across the genome after reloading (18,816 CpGs) versus earlier loading (9,153 CpG sites). We also identified AXIN1, GRIK2, CAMK4, TRAF1 as hypomethylated genes with enhanced expression after loading that maintained their hypomethylated status even during unloading where muscle mass returned to control levels, indicating a memory of these genes methylation signatures following earlier hypertrophy. Further, UBR5, RPL35a, HEG1, PLA2G16, SETD3 displayed hypomethylation and enhanced gene expression following loading, and demonstrated the largest increases in hypomethylation, gene expression and muscle mass after later reloading, indicating an epigenetic memory in these genes. Finally, genes; GRIK2, TRAF1, BICC1, STAG1 were epigenetically sensitive to acute exercise demonstrating hypomethylation after a single bout of resistance exercise that was maintained 22 weeks later with the largest increase in gene expression and muscle mass after reloading. Overall, we identify an important epigenetic role for a number of largely unstudied genes in muscle hypertrophy/memory.


Conflict of interest statement

The authors declare that they have no competing interests.

Figures

Figure 1
Figure 1
(A) Schematic representation of experimental conditions and types of analysis undertaken across the time-course. The image of a muscle represents the time point for analysis of muscle mass via (i) DEXA and strength via (ii) isometric quadriceps muscle torque using an isokinetic dynamometer. The images of muscle tissue also represent the time point of skeletal muscle biopsy of the Vastus Lateralis, muscle sample preparation for downstream analysis of (iii) Infinium MethylationEPIC BeadChip arrays (850 K CpG sites) methylome wide array (iv) and rt-qRT-PCR for gene expression analysis of important genes identified following methylome wide analysis. (B) Weekly total volume of resistance exercise undertaken by human participants (n = 7) during the first 7-week resistance exercise period (loading, weeks 1–7), followed by a 7 week cessation of resistance exercise (unloading, weeks 8–14) and the later second period of 7 weeks resistance exercise (reloading, weeks 15–21). Data represents volume load as calculated by ((load (Kg) x reps) x sets)) averaged across 3 resistance exercise sessions per week. Data presented mean ± SEM. (Ci) Lean lower limb mass changes in human subjects (n = 7) after a period of 7 weeks resistance exercise (loading), exercise cessation (unloading) and a subsequent second period of 7 weeks resistance exercise (reloading). Total limb lean mass normalised to baseline (percentage change). Significant change compared to baseline represented by * and significant difference to all other conditions represented by ** (Cii) Total lean mass percentage change when loading is normalised to baseline, and reloading normalised to unloading to account for starting lean mass in both conditions. Pairwise t-test of significance indicated by *. All data presented as mean ± SEM (n = 7).
Figure 2
Figure 2
(A) Infinium MethylationEPIC BeadChip arrays (850 K CpG sites) identified an enhanced frequency of hypomethylated CpG sites upon reloading (n = 7). (B) Gene ontology analysis using forest plot schematics confirmed an enhanced hypomethylated profile after reloading across various (i) molecular function, (ii) biological processes and (iii) cellular components. Functional groups with a fold enrichment >3 (as indicated via shaded blue region) represents statistically ‘over expressed’ (in this case epigenetically modified) KEGG pathways FDR < 0.05 (n = 8).
Figure 3
Figure 3
(A) Representation of the DNA methylation modifications that occurred within the PI3K/AKT KEGG pathway following 7 weeks of reloading in human subjects. Signalling analysis performed on statistically differentially regulated CpG sites compared to baseline, with green indicating a hypomethylated fold change and red indicating a hypermethylated change, with strength of colour representing the intensity of fold change. Figure 3b. Venn diagram analysis of the statistically differentially regulated CpG sites attributed to the PI3K/AKT pathway following loading, unloading and reloading, compared to be baseline. Ellipsis reports number of commonly statistically differentially regulated CpG sites across each condition. Analysis confirms an enhanced number of differentially regulated CpG sites upon reloading condition.
Figure 4
Figure 4
(A) Heat map depicting unsupervised hierarchical clustering of the top 500 statistically differentially regulated CpG loci (columns) and conditions (baseline, loading, unloading and reloading) in previously untrained male participants (n = 8). The heat-map colours correspond to standardised expression normalised β-values, with green representing hypomethylation, red hypermethylation and unchanged sites are represented in black. (4B and C) Relative gene expression (i) and schematic representation of CpG DNA methylation and gene expression relationship (ii) in two identified gene clusters from genome wide methylation analysis after a period of 7 weeks resistance exercise (loading), exercise cessation (unloading) and a subsequent secondary period of 7 weeks resistance exercise (reloading). (Bi) Expression of genes that displayed a significant increase compared to baseline (represented by *) upon earlier loading, that returned to baseline during unloading, and displayed enhanced expression after reloading (significantly different to all other conditions **). MANOVA analysis reported a significant effect over the entire time course of the experiment (P < 0.0001). (Bii) Representative schematic displaying the inverse relationship between mean gene expression (solid black lines) and CpG DNA methylation (dashed black lines) of grouped transcripts (RPL35a, C12orf50, BICC1, ZFP2, UBR5, HEG1, PLA2G16, SETD3 and ODF2). Data represented as fold change for DNA methylation (left y axis) and gene/mRNA expression (right y axis). (Ci) Clustering of genes that portrayed an accumulative increase in gene expression after loading, unloading and reloading. With the largest increase in gene expression after reloading. Culminating in significance in the unloading (baseline vs. unloading*), and reloading (reloading vs. baseline**). (Cii) Representative schematic displaying the inverse relationship between mean gene expression (solid black lines) and CpG DNA methylation (dashed black lines) of grouped transcripts (AXIN1, TRAF1, GRIK2, CAMK4). Data represented as fold change for methylation (left y axis) and mRNA expression (right y axis). All data represented as mean ± SEM for gene expression (n = 7 for UBR5, PLA2G16, AXIN1, GRIK2; n = 8 for all others) and CpG DNA methylation (n = 8 for baseline, loading and unloading; n = 7 for reloading).
Figure 5
Figure 5
Relative fold changes in: (A) gene expression; (B) correlation between gene expression and lower limb lean mass across experimental conditions, and; (C) schematic representation of relationship between fold changes in CpG DNA methylation (dashed black line; left y axis) and fold change in gene/mRNA expression (solid black line; right y axis) for identified genes: RPL35a (I), UBR5 (II), SETD3 (III), PLA2G16 (IV) and HEG1 (V). Statistical significance compared to baseline and unloading represented by* and** respectively. All significance taken as p less than or equal to 0.05 unless otherwise state on graph. All data presented as mean ± SEM (n = 7/8).
Figure 6
Figure 6
Representation and characterisation of the DNA methylation modifications that occurred within the ubiquitin mediated proteolysis pathway across all conditions of loading, unloading and reloading compared to baseline (ANOVA). Signalling analysis performed on statistically differentially regulated CpG sites compared to baseline, with green indicating a hypomethylated fold change and red indicating a hypermethylated change, with strength of colour representing the intensity of fold change. Importantly, the novel HECT-type E3 ubiquitin ligase, UBR5, displays a significantly hypomethylated state within this pathway.
Figure 7
Figure 7
Response of the methylome after acute resistance loading stimulus compared to baseline, 7 weeks loading and 7 weeks reloading: (A) Heat map depicting unsupervised hierarchical clustering of statistically differentially regulated (P = 0.05) CpG loci following exposure to acute RE compared to baseline; (B) a Venn diagram depicting the number of CpG sites that were significantly differentially regulated in both methylome analysis experiments (base, loading, unloading and reloading, blue circle; baseline and acute resistance stimulus, red circle), and the amount of genes analysed for gene expression across acute, 7 weeks loading and 7 weeks reloading, respectively; (C) temporal pattern of fold change in DNA CpG methylation of the identified overlapping CpG sites that mapped to relevant gene transcripts; (D) correlation of CpG DNA methylation of acute RE vs. 7 weeks loading and reloading conditions, and (E) Heat map depicting unsupervised hierarchical clustering of statistically differentially regulated (P = 0.05) CpG loci following exposure to acute RE compared to baseline, loading and reloading (F) representative schematic displaying the inverse relationship between mean gene expression (solid black lines) and CpG DNA methylation (dashed black lines) of identified transcripts. Significance indicated in gene expression (*) and in CpG DNA methylation (§) when compared to baseline.

Similar articles

Cited by

References

    1. Sharples AP, Stewart CE, Seaborne RA. Does skeletal muscle have an ‘epi’-memory? The role of epigenetics in nutritional programming, metabolic disease, aging and exercise. Aging cell. 2016;15:603–616. doi: 10.1111/acel.12486. - DOI - PMC - PubMed
    1. Patel HP, et al. Developmental influences, muscle morphology, and sarcopenia in community-dwelling older men. J Gerontol A Biol Sci Med Sci. 2012;67:82–87. doi: 10.1093/gerona/glr020. - DOI - PubMed
    1. Patel HP, et al. Lean mass, muscle strength and gene expression in community dwelling older men: findings from the Hertfordshire Sarcopenia Study (HSS) Calcified tissue international. 2014;95:308–316. doi: 10.1007/s00223-014-9894-z. - DOI - PubMed
    1. Laker RC, et al. Exercise prevents maternal high-fat diet-induced hypermethylation of the Pgc-1alpha gene and age-dependent metabolic dysfunction in the offspring. Diabetes. 2014;63:1605–1611. doi: 10.2337/db13-1614. - DOI - PMC - PubMed
    1. Zeng Y, Gu P, Liu K, Huang P. Maternal protein restriction in rats leads to reduced PGC-1alpha expression via altered DNA methylation in skeletal muscle. Molecular medicine reports. 2013;7:306–312. doi: 10.3892/mmr.2012.1134. - DOI - PubMed

Publication types