

Locality and diel cycling of viral production revealed by a 24 h time course cross-omics analysis in a coastal region of Japan
- PMID: 29382948
- PMCID: PMC5932082
- DOI: 10.1038/s41396-018-0052-x
Locality and diel cycling of viral production revealed by a 24 h time course cross-omics analysis in a coastal region of Japan
Erratum in
-
Correction: Locality and diel cycling of viral production revealed by a 24 h time course cross-omics analysis in a coastal region of Japan.ISME J. 2018 Dec;12(12):3046. doi: 10.1038/s41396-018-0247-1. ISME J. 2018. PMID: 30068936 Free PMC article.
Abstract
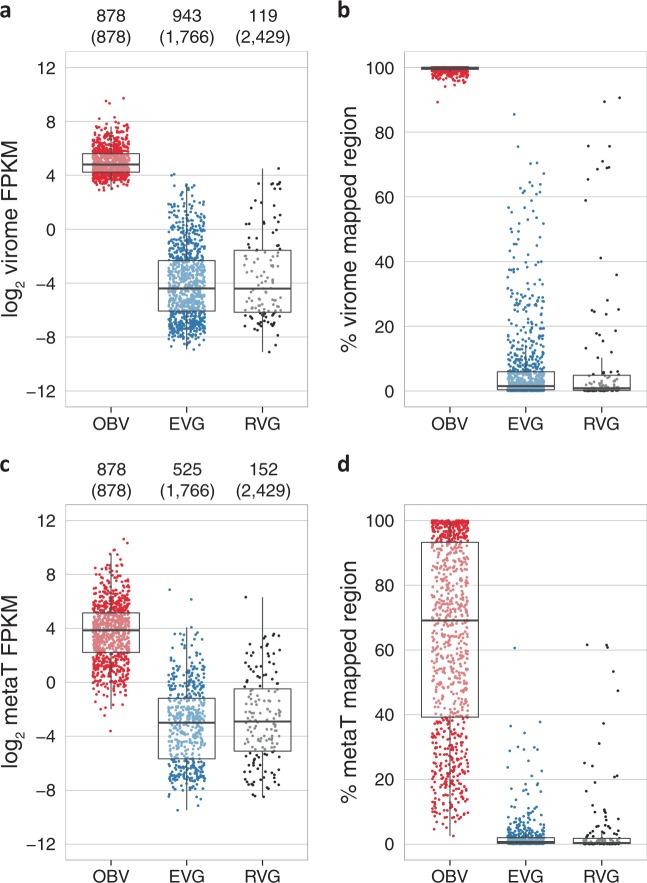
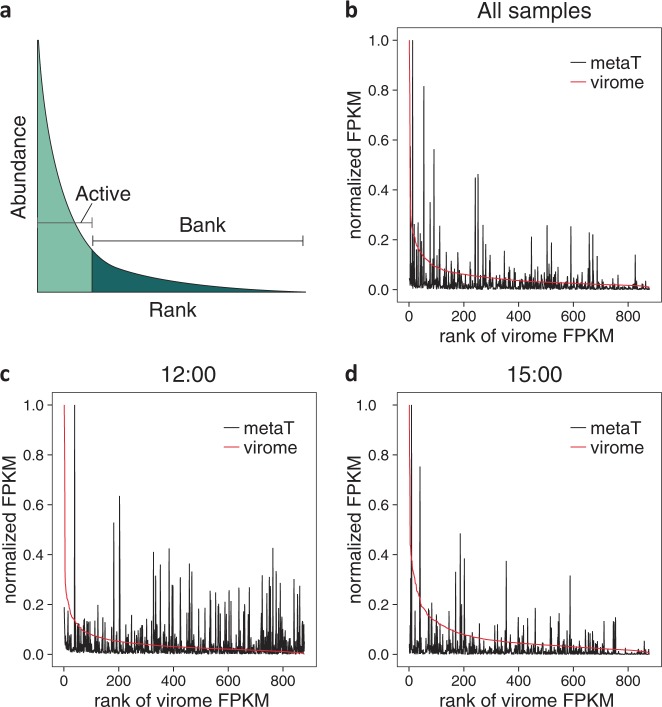
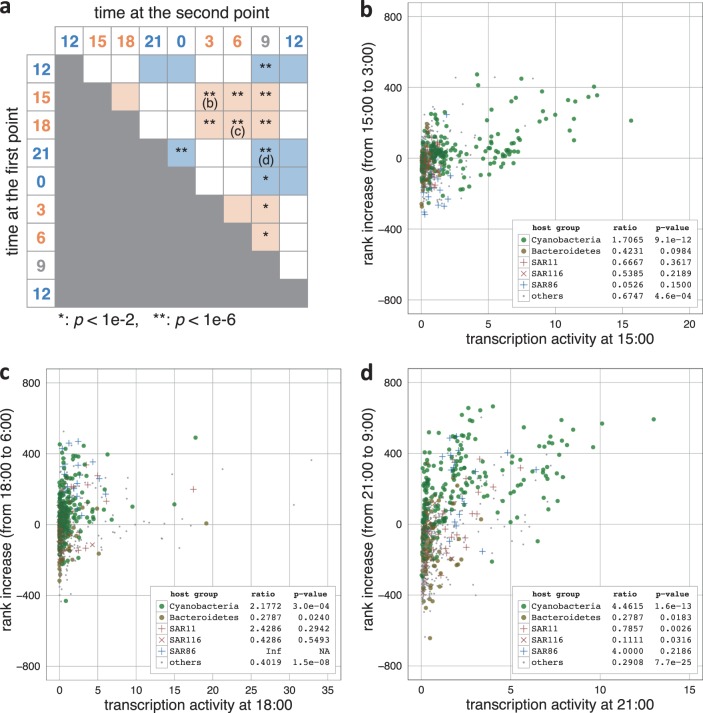
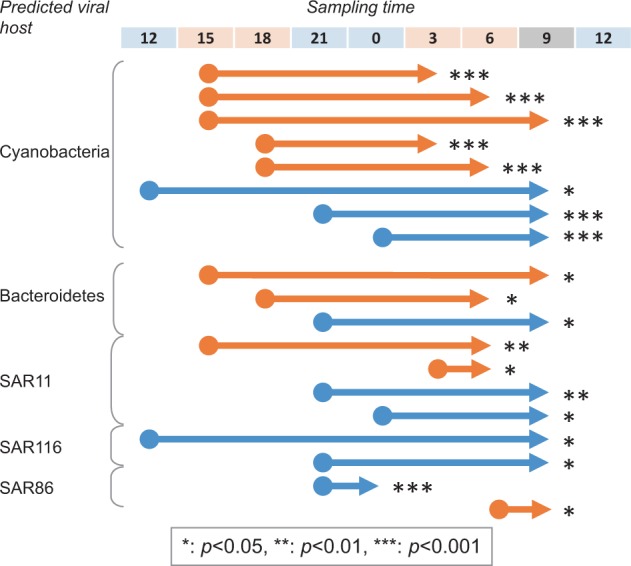
Viruses infecting microorganisms are ubiquitous and abundant in the ocean. However, it is unclear when and where the numerous viral particles we observe in the sea are produced and whether they are active. To address these questions, we performed time-series analyses of viral metagenomes and microbial metatranscriptomes collected over a period of 24 h at a Japanese coastal site. Through mapping the metatranscriptomic reads on three sets of viral genomes ((i) 878 contigs of Osaka Bay viromes (OBV), (ii) 1766 environmental viral genomes from marine viromes, and (iii) 2429 reference viral genomes), we revealed that all the local OBV contigs were transcribed in the host fraction. This indicates that the majority of viral populations detected in viromes are active, and suggests that virions are rapidly diluted as a result of diffusion, currents, and mixing. Our data further revealed a peak of cyanophage gene expression in the afternoon/dusk followed by an increase of genomes from their virions at night and less-coherent infectious patterns for viruses putatively infecting various groups of heterotrophs. This suggests that cyanophages drive the diel release of cyanobacteria-derived organic matter into the environment and viruses of heterotrophic bacteria might have adapted to the population-specific life cycles of hosts.
Conflict of interest statement
The authors declare that they have no conflict of interest.
Figures
Similar articles
-
Diversity and genome dynamics of marine cyanophages using metagenomic analyses.Environ Microbiol Rep. 2014 Dec;6(6):583-94. doi: 10.1111/1758-2229.12160. Environ Microbiol Rep. 2014. PMID: 25756111
-
Dynamic marine viral infections and major contribution to photosynthetic processes shown by spatiotemporal picoplankton metatranscriptomes.Nat Commun. 2019 Mar 12;10(1):1169. doi: 10.1038/s41467-019-09106-z. Nat Commun. 2019. PMID: 30862830 Free PMC article.
-
Genome sequences of siphoviruses infecting marine Synechococcus unveil a diverse cyanophage group and extensive phage-host genetic exchanges.Environ Microbiol. 2012 Feb;14(2):540-58. doi: 10.1111/j.1462-2920.2011.02667.x. Epub 2011 Dec 22. Environ Microbiol. 2012. PMID: 22188618
-
Marine cyanophages and light.Environ Microbiol. 2006 Dec;8(12):2074-82. doi: 10.1111/j.1462-2920.2006.01171.x. Environ Microbiol. 2006. PMID: 17107549 Review.
-
Host-hijacking and planktonic piracy: how phages command the microbial high seas.Virol J. 2019 Feb 1;16(1):15. doi: 10.1186/s12985-019-1120-1. Virol J. 2019. PMID: 30709355 Free PMC article. Review.
Cited by
-
Differential Responses of a Coastal Prokaryotic Community to Phytoplanktonic Organic Matter Derived from Cellular Components and Exudates.Microbes Environ. 2020;35(3):ME20033. doi: 10.1264/jsme2.ME20033. Microbes Environ. 2020. PMID: 32554942 Free PMC article.
-
Unraveling the Contribution of High Temperature Stage to Jiang-Flavor Daqu, a Liquor Starter for Production of Chinese Jiang-Flavor Baijiu, With Special Reference to Metatranscriptomics.Front Microbiol. 2019 Mar 12;10:472. doi: 10.3389/fmicb.2019.00472. eCollection 2019. Front Microbiol. 2019. PMID: 30930875 Free PMC article.
-
Viral Complexity.Biomolecules. 2022 Jul 30;12(8):1061. doi: 10.3390/biom12081061. Biomolecules. 2022. PMID: 36008955 Free PMC article. Review.
-
Daily microbial rhythms of the surface ocean interrupted by the new moon-a lipidomic study.ISME Commun. 2025 Mar 9;5(1):ycaf044. doi: 10.1093/ismeco/ycaf044. eCollection 2025 Jan. ISME Commun. 2025. PMID: 40177466 Free PMC article.
-
Extensive gut virome variation and its associations with host and environmental factors in a population-level cohort.Nat Commun. 2022 Sep 6;13(1):5252. doi: 10.1038/s41467-022-32832-w. Nat Commun. 2022. PMID: 36068216 Free PMC article.
References
Publication types
MeSH terms
LinkOut - more resources
Full Text Sources
Other Literature Sources
