

Epidemiology, causes, evolution and outcome in a single-center cohort of 1116 critically ill patients with hypoxic hepatitis
- PMID: 29383510
- PMCID: PMC5790763
- DOI: 10.1186/s13613-018-0356-z
Epidemiology, causes, evolution and outcome in a single-center cohort of 1116 critically ill patients with hypoxic hepatitis
Abstract
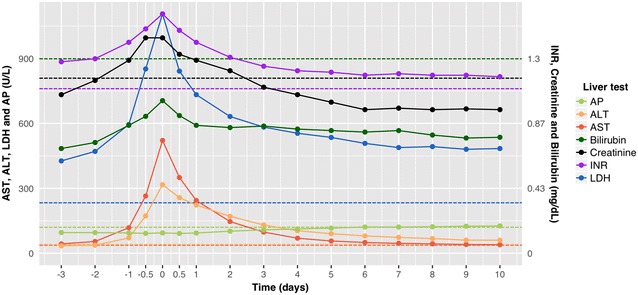
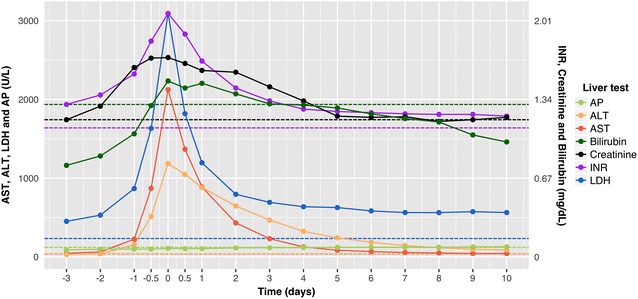
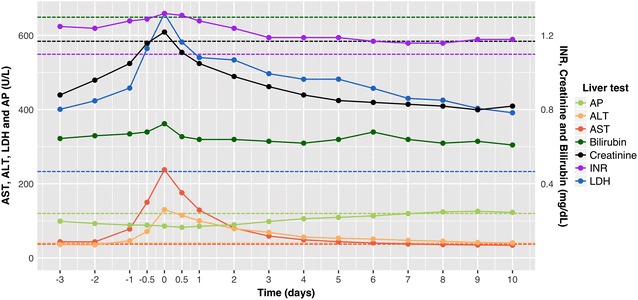
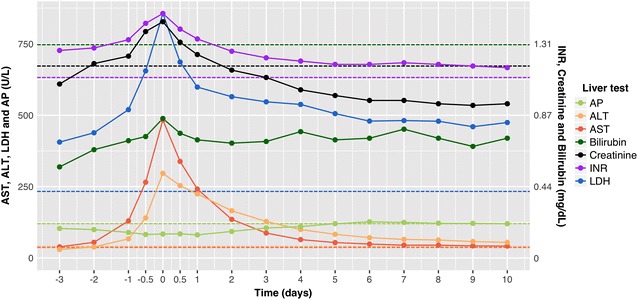
Background: Hypoxic hepatitis (HH) is a type of acute hepatic injury that is histologically characterized by centrilobular liver cell necrosis and that is caused by insufficient oxygen delivery to the hepatocytes. Typical for HH is the sudden and significant increase of aspartate aminotransferase (AST) in response to cardiac, circulatory or respiratory failure. The aim of this study is to investigate its epidemiology, causes, evolution and outcome.
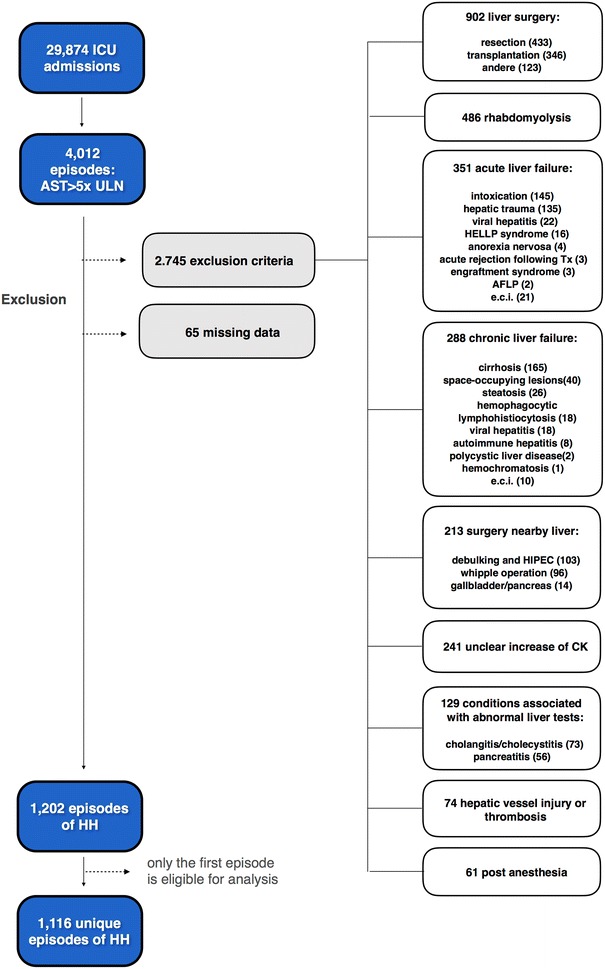
Methods: The screened population consisted of all adults admitted to the intensive care unit (ICU) at the Ghent University Hospital between January 1, 2007 and September 21, 2015. HH was defined as peak AST > 5 times the upper limit of normal (ULN) after exclusion of other causes of liver injury. Thirty-five variables were retrospectively collected and used in descriptive analysis, time series plots and Kaplan-Meier survival curves with multi-group log-rank tests.
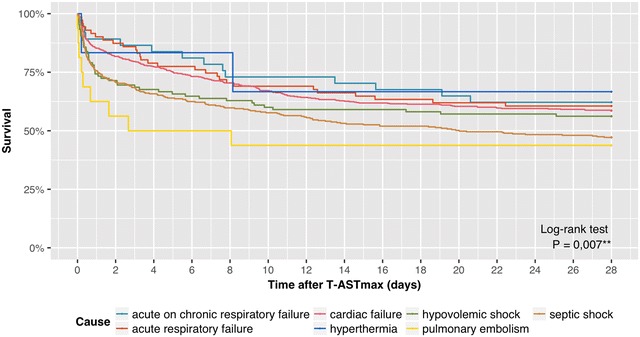
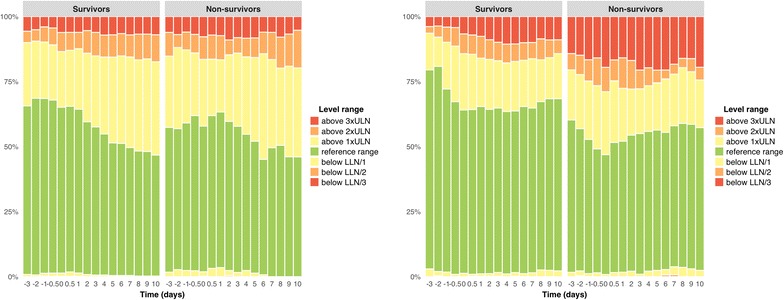
Results: HH was observed in 4.0% of the ICU admissions at our center. The study cohort comprised 1116 patients. Causes of HH were cardiac failure (49.1%), septic shock (29.8%), hypovolemic shock (9.4%), acute respiratory failure (6.4%), acute on chronic respiratory failure (3.3%), pulmonary embolism (1.4%) and hyperthermia (0.5%). The 28-day mortality associated with HH was 45.0%. Mortality rates differed significantly (P = 0.007) among the causes, ranging from 33.3% in the hyperthermia subgroup to 52.9 and 56.2% in the septic shock and pulmonary embolism subgroups, respectively. The magnitude of AST increase was also significantly correlated (P < 0.001) with mortality: 33.2, 44.4 and 55.4% for peak AST 5-10× ULN, 10-20× ULN and > 20× ULN, respectively.
Conclusion: This study surpasses by far the largest cohort of critically ill patients with HH. HH is more common than previously thought with an ICU incidence of 4.0%, and it is associated with a high all-cause mortality of 45.0% at 28 days. The main causes of HH are cardiac failure and septic shock, which include more than 3/4 of all episodes. Clinicians should search actively for any underlying hemodynamic or respiratory instability even in patients with moderately increased AST levels.
Keywords: Critical care medicine; Critically ill; Epidemiology; Hypoxic hepatitis; Intensive care medicine; Ischemic hepatitis; Liver failure; Mortality; Outcome; Shock liver.
Figures
Similar articles
-
Prevalence, clinical characteristics and outcomes of hypoxic hepatitis in critically ill patients.Scand J Gastroenterol. 2022 Mar;57(3):311-318. doi: 10.1080/00365521.2021.2005136. Epub 2021 Nov 30. Scand J Gastroenterol. 2022. PMID: 34846975
-
Statin therapy is associated with reduced incidence of hypoxic hepatitis in critically ill patients.J Hepatol. 2014 Jun;60(6):1187-93. doi: 10.1016/j.jhep.2014.01.019. Epub 2014 Feb 5. J Hepatol. 2014. PMID: 24509409
-
Prevalence and Characteristics of Hypoxic Hepatitis in COVID-19 Patients in the Intensive Care Unit: A First Retrospective Study.Front Med (Lausanne). 2021 Feb 11;7:607206. doi: 10.3389/fmed.2020.607206. eCollection 2020. Front Med (Lausanne). 2021. PMID: 33681238 Free PMC article.
-
Hypoxic hepatitis - epidemiology, pathophysiology and clinical management.Wien Klin Wochenschr. 2010 Mar;122(5-6):129-39. doi: 10.1007/s00508-010-1357-6. Wien Klin Wochenschr. 2010. PMID: 20361374 Review.
-
Hypoxic hepatitis.Liver Int. 2012 Aug;32(7):1039-52. doi: 10.1111/j.1478-3231.2011.02655.x. Epub 2011 Oct 10. Liver Int. 2012. PMID: 22098491 Review.
Cited by
-
Prediction of 30-day mortality in heart failure patients with hypoxic hepatitis: Development and external validation of an interpretable machine learning model.Front Cardiovasc Med. 2022 Oct 28;9:1035675. doi: 10.3389/fcvm.2022.1035675. eCollection 2022. Front Cardiovasc Med. 2022. PMID: 36386374 Free PMC article.
-
The Predictive Value of the MELD Scores for In-Hospital Adverse Events in Normotensive Patients with Acute Pulmonary Embolism.Clin Appl Thromb Hemost. 2024 Jan-Dec;30:10760296241266607. doi: 10.1177/10760296241266607. Clin Appl Thromb Hemost. 2024. PMID: 39129349 Free PMC article.
-
Atypical Presentation of Cardiac Tamponade as a Cause of Acute Liver Injury: Case Report and Review of Literature.Cureus. 2018 Jun 11;10(6):e2779. doi: 10.7759/cureus.2779. Cureus. 2018. PMID: 30112255 Free PMC article. Review.
-
Organ Dysfunction in Sepsis: An Ominous Trajectory From Infection To Death.Yale J Biol Med. 2019 Dec 20;92(4):629-640. eCollection 2019 Dec. Yale J Biol Med. 2019. PMID: 31866778 Free PMC article. Review.
-
Definition and classification of acute-on-chronic liver diseases.World J Clin Cases. 2022 May 26;10(15):4717-4725. doi: 10.12998/wjcc.v10.i15.4717. World J Clin Cases. 2022. PMID: 35801045 Free PMC article. Review.
References
-
- Henrion J, Schapira M, Luwaert R, Colin L, Delannoy A, Heller FR. Hypoxic hepatitis: clinical and hemodynamic study in 142 consecutive cases. Medicine (Baltimore) 2003;82(6):392–406. doi: 10.1097/01.md.0000101573.54295.bd. - DOI - PubMed
LinkOut - more resources
Full Text Sources
Other Literature Sources
