

Development and Validation of Machine Learning Models for Prediction of 1-Year Mortality Utilizing Electronic Medical Record Data Available at the End of Hospitalization in Multicondition Patients: a Proof-of-Concept Study
- PMID: 29383551
- PMCID: PMC5975145
- DOI: 10.1007/s11606-018-4316-y
Development and Validation of Machine Learning Models for Prediction of 1-Year Mortality Utilizing Electronic Medical Record Data Available at the End of Hospitalization in Multicondition Patients: a Proof-of-Concept Study
Abstract
Background: Predicting death in a cohort of clinically diverse, multicondition hospitalized patients is difficult. Prognostic models that use electronic medical record (EMR) data to determine 1-year death risk can improve end-of-life planning and risk adjustment for research.
Objective: Determine if the final set of demographic, vital sign, and laboratory data from a hospitalization can be used to accurately quantify 1-year mortality risk.
Design: A retrospective study using electronic medical record data linked with the state death registry.
Participants: A total of 59,848 hospitalized patients within a six-hospital network over a 4-year period.
Main measures: The last set of vital signs, complete blood count, basic and complete metabolic panel, demographic information, and ICD codes. The outcome of interest was death within 1 year.
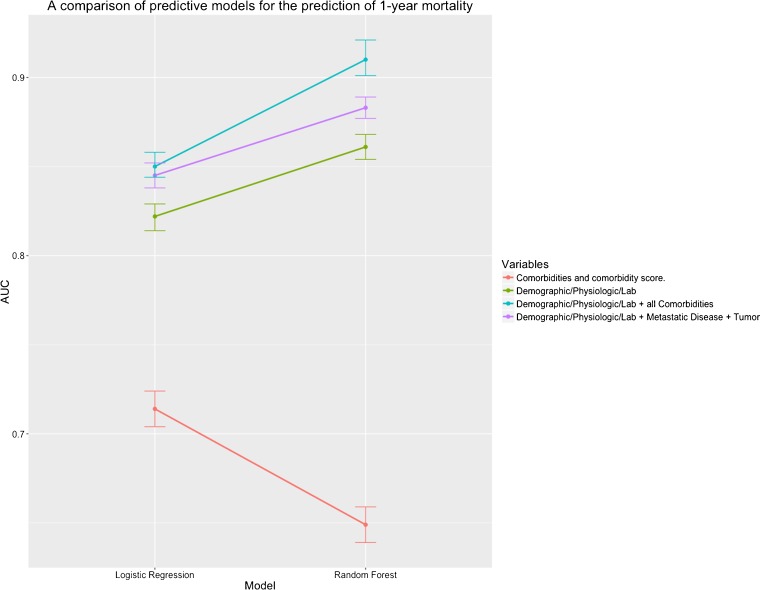
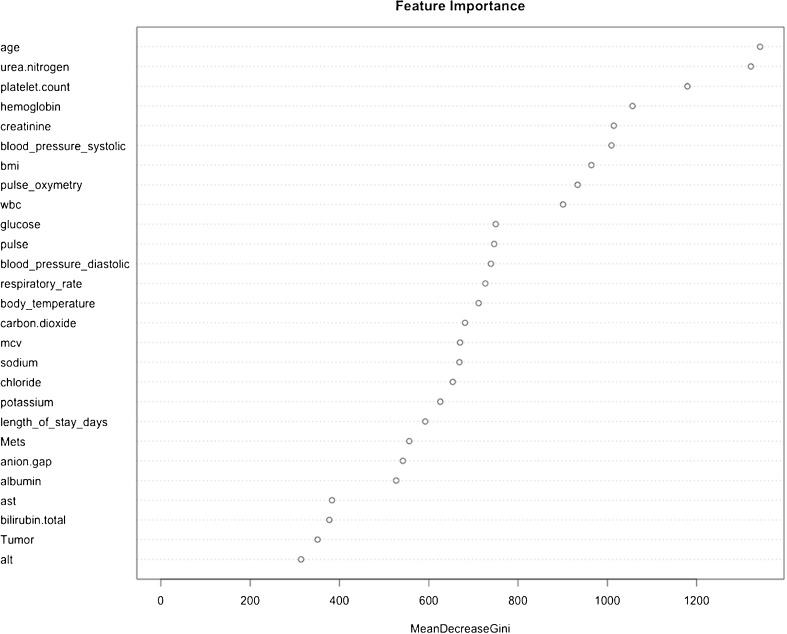
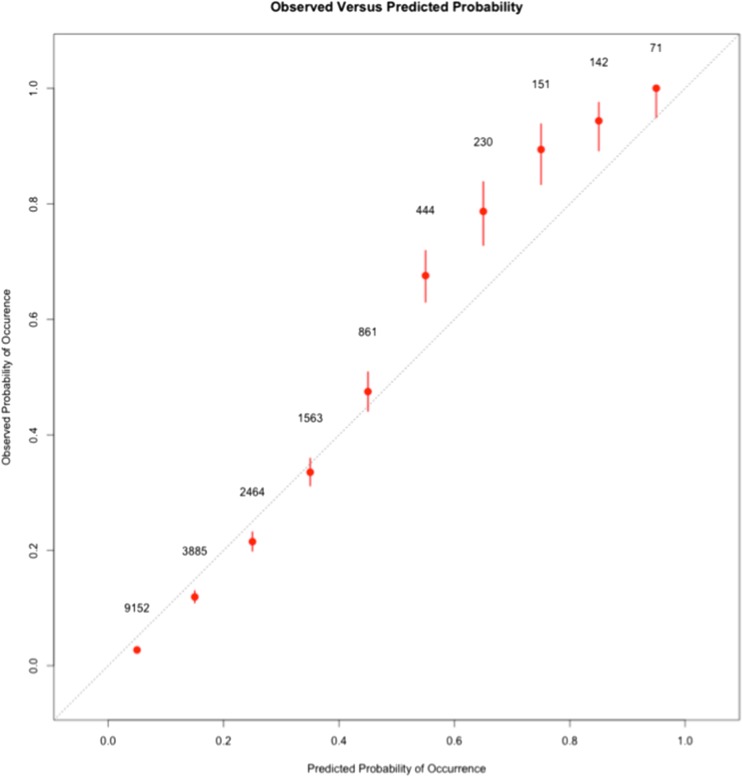
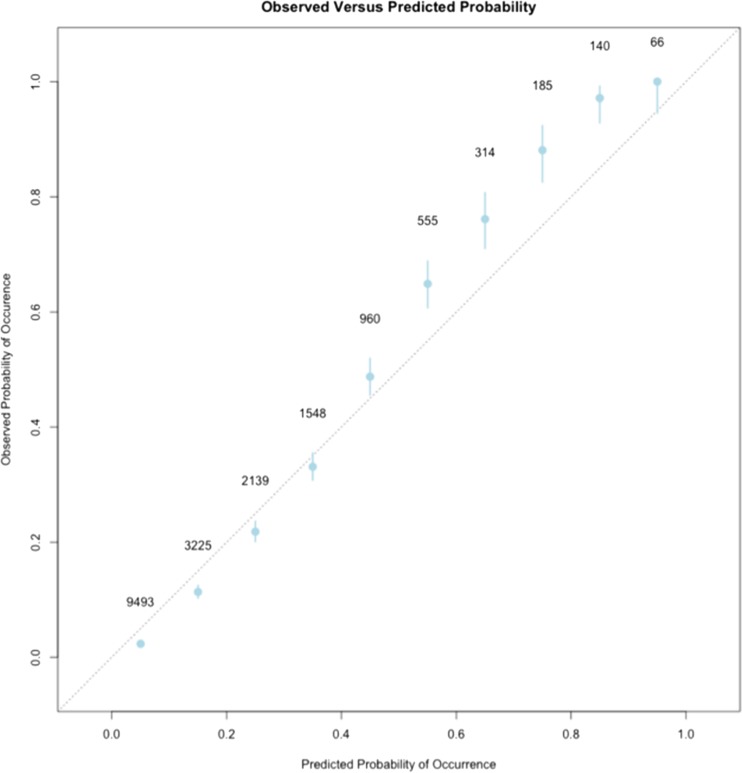
Key results: Model performance was measured on the validation data set. Random forests (RF) outperformed logisitic regression (LR) models in discriminative ability. An RF model that used the final set of demographic, vitals, and laboratory data from the final 48 h of hospitalization had an AUC of 0.86 (0.85-0.87) for predicting death within a year. Age, blood urea nitrogen, platelet count, hemoglobin, and creatinine were the most important variables in the RF model. Models that used comorbidity variables alone had the lowest AUC. In groups of patients with a high probability of death, RF models underestimated the probability by less than 10%.
Conclusion: The last set of EMR data from a hospitalization can be used to accurately estimate the risk of 1-year mortality within a cohort of multicondition hospitalized patients.
Keywords: data mining; hospital outcomes; machine learning; predictive models.
Conflict of interest statement
The authors report no conflicts of interest in this work.
Figures
Similar articles
-
min-SIA: a Lightweight Algorithm to Predict the Risk of 6-Month Mortality at the Time of Hospital Admission.J Gen Intern Med. 2020 May;35(5):1413-1418. doi: 10.1007/s11606-020-05733-1. Epub 2020 Mar 10. J Gen Intern Med. 2020. PMID: 32157649 Free PMC article.
-
Development and Validation of an Electronic Health Record-Based Machine Learning Model to Estimate Delirium Risk in Newly Hospitalized Patients Without Known Cognitive Impairment.JAMA Netw Open. 2018 Aug 3;1(4):e181018. doi: 10.1001/jamanetworkopen.2018.1018. JAMA Netw Open. 2018. PMID: 30646095 Free PMC article.
-
Prediction of In-hospital Mortality in Emergency Department Patients With Sepsis: A Local Big Data-Driven, Machine Learning Approach.Acad Emerg Med. 2016 Mar;23(3):269-78. doi: 10.1111/acem.12876. Epub 2016 Feb 13. Acad Emerg Med. 2016. PMID: 26679719 Free PMC article.
-
Use of machine learning to analyse routinely collected intensive care unit data: a systematic review.Crit Care. 2019 Aug 22;23(1):284. doi: 10.1186/s13054-019-2564-9. Crit Care. 2019. PMID: 31439010 Free PMC article.
-
A Machine Learning Approach to Predicting Need for Hospitalization for Pediatric Asthma Exacerbation at the Time of Emergency Department Triage.Acad Emerg Med. 2018 Dec;25(12):1463-1470. doi: 10.1111/acem.13655. Epub 2018 Nov 29. Acad Emerg Med. 2018. PMID: 30382605
Cited by
-
Pulse wave-based evaluation of the blood-supply capability of patients with heart failure via machine learning.Biomed Eng Online. 2024 Jan 19;23(1):7. doi: 10.1186/s12938-024-01201-7. Biomed Eng Online. 2024. PMID: 38243221 Free PMC article.
-
Predicting Patient Mortality for Earlier Palliative Care Identification in Medicare Advantage Plans: Features of a Machine Learning Model.JMIR AI. 2023 Feb 20;2:e42253. doi: 10.2196/42253. JMIR AI. 2023. PMID: 38875557 Free PMC article.
-
Application of machine learning approaches to administrative claims data to predict clinical outcomes in medical and surgical patient populations.PLoS One. 2021 Jun 3;16(6):e0252585. doi: 10.1371/journal.pone.0252585. eCollection 2021. PLoS One. 2021. PMID: 34081720 Free PMC article.
-
Electronic Health Record Mortality Prediction Model for Targeted Palliative Care Among Hospitalized Medical Patients: a Pilot Quasi-experimental Study.J Gen Intern Med. 2019 Sep;34(9):1841-1847. doi: 10.1007/s11606-019-05169-2. Epub 2019 Jul 16. J Gen Intern Med. 2019. PMID: 31313110 Free PMC article.
-
Machine Learning Prediction Models for Mitral Valve Repairability and Mitral Regurgitation Recurrence in Patients Undergoing Surgical Mitral Valve Repair.Bioengineering (Basel). 2021 Aug 25;8(9):117. doi: 10.3390/bioengineering8090117. Bioengineering (Basel). 2021. PMID: 34562939 Free PMC article.
References
Publication types
MeSH terms
Grants and funding
LinkOut - more resources
Full Text Sources
Other Literature Sources
