. 2018 Sep;55(9):7132-7152.
doi: 10.1007/s12035-018-0882-6. Epub 2018 Jan 30.

Glia Maturation Factor Dependent Inhibition of Mitochondrial PGC-1α Triggers Oxidative Stress-Mediated Apoptosis in N27 Rat Dopaminergic Neuronal Cells

Affiliations

Glia Maturation Factor Dependent Inhibition of Mitochondrial PGC-1α Triggers Oxidative Stress-Mediated Apoptosis in N27 Rat Dopaminergic Neuronal Cells

Govindhasamy Pushpavathi Selvakumar et al. Mol Neurobiol. 2018 Sep.

Abstract

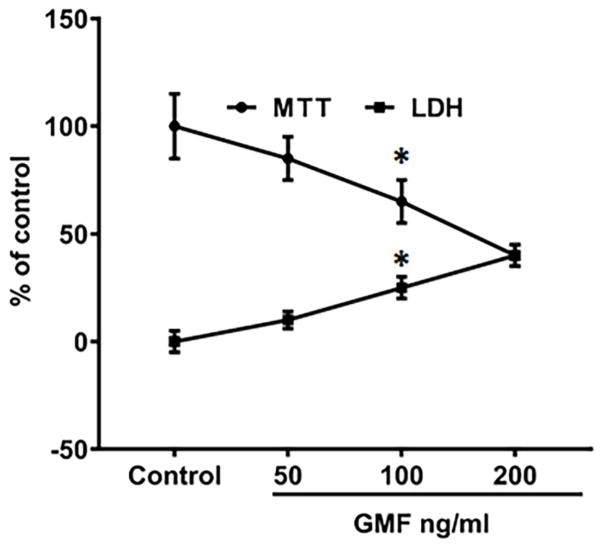
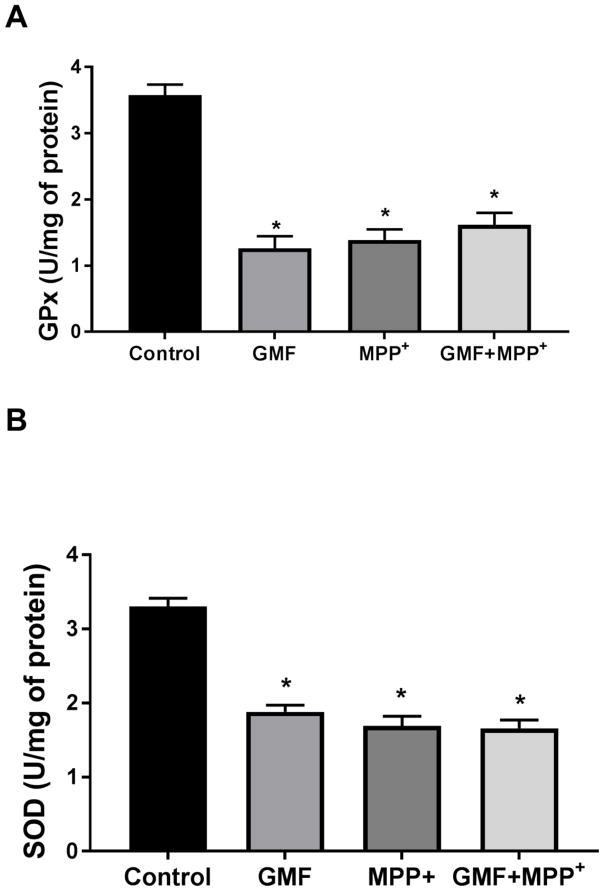
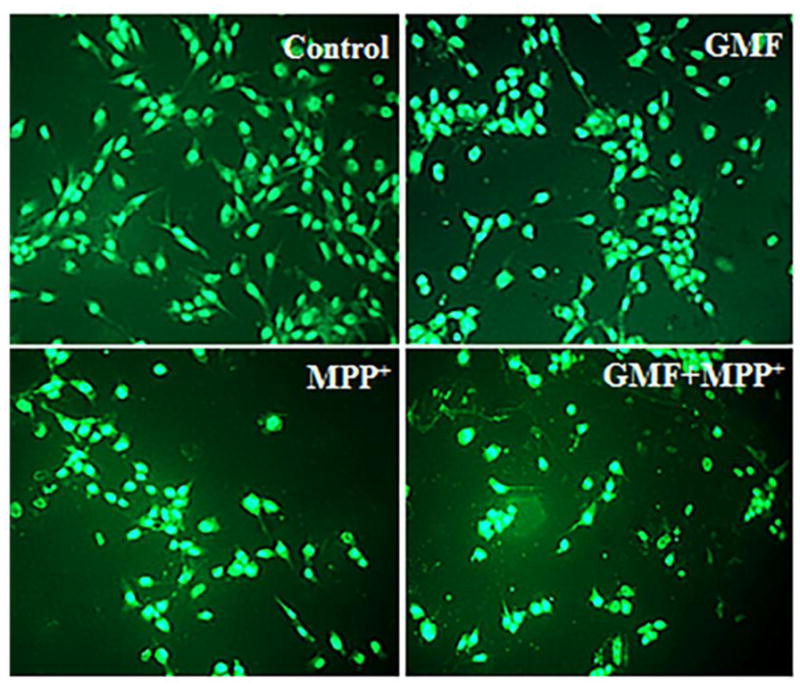
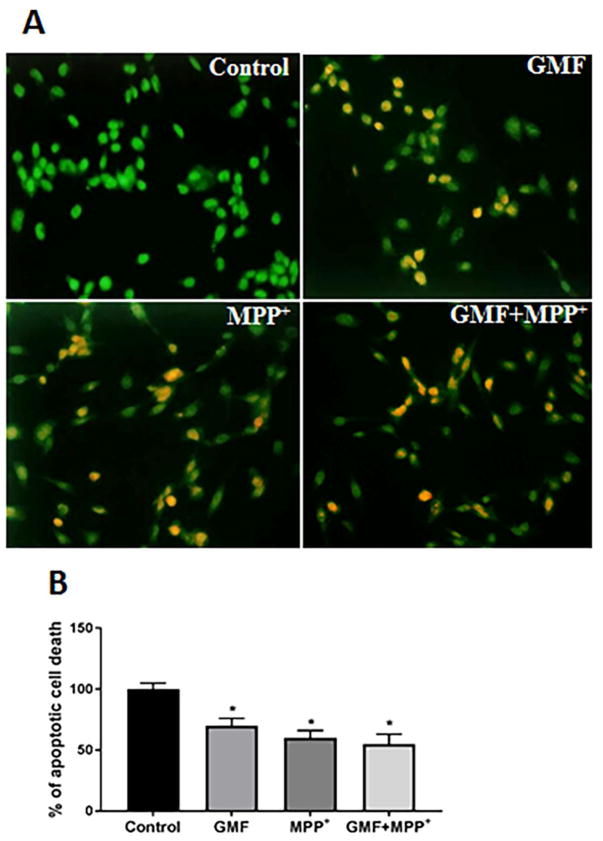
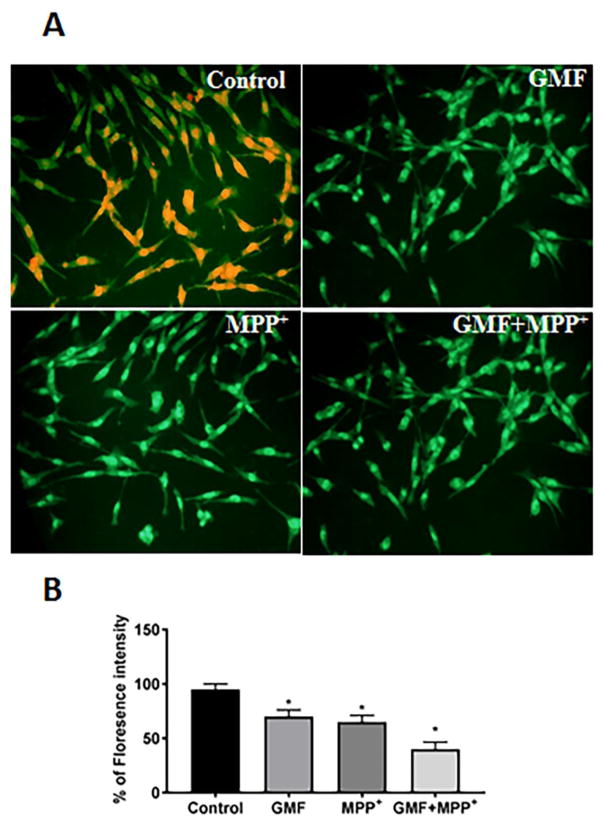
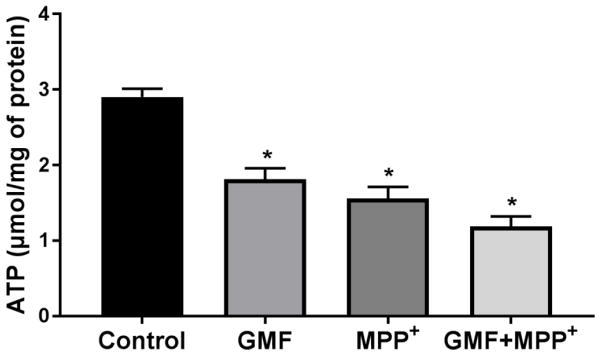
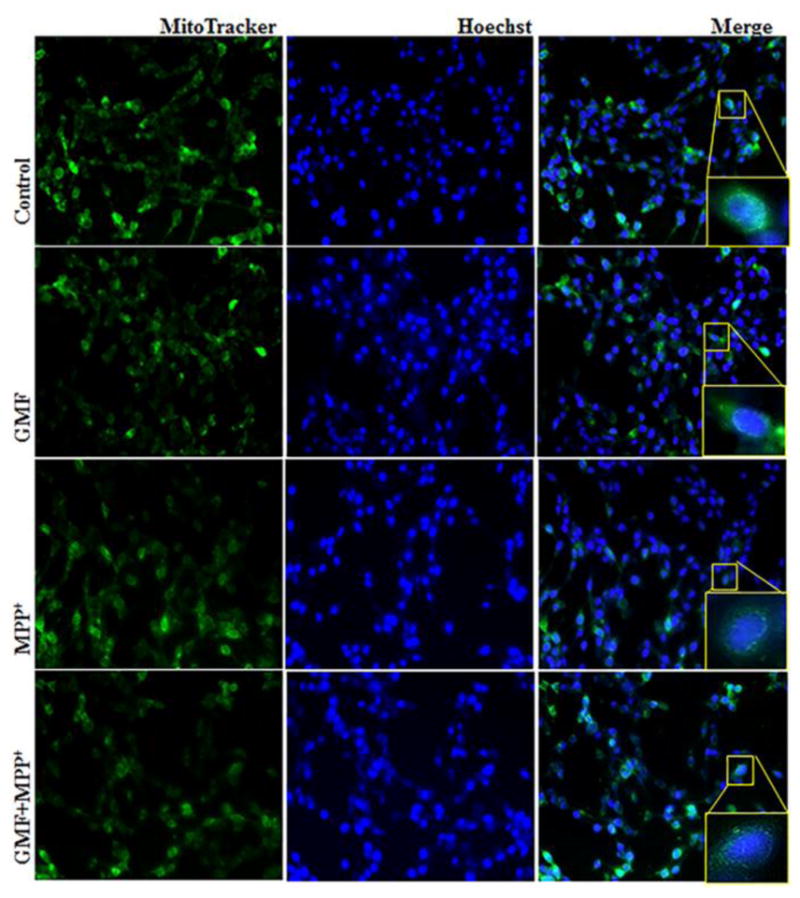
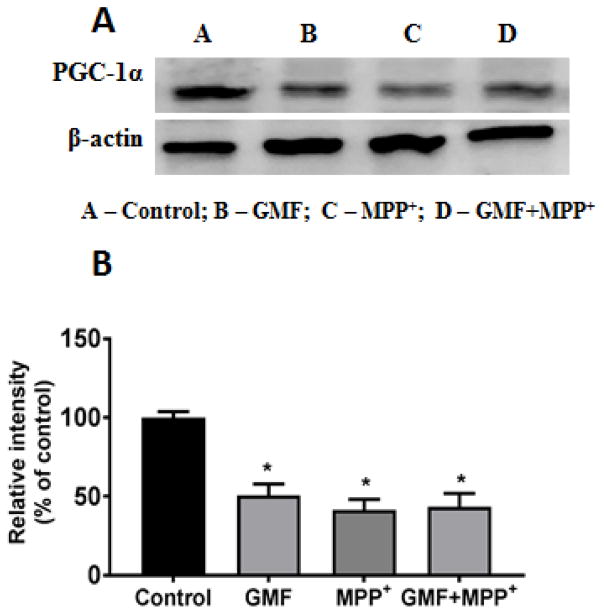
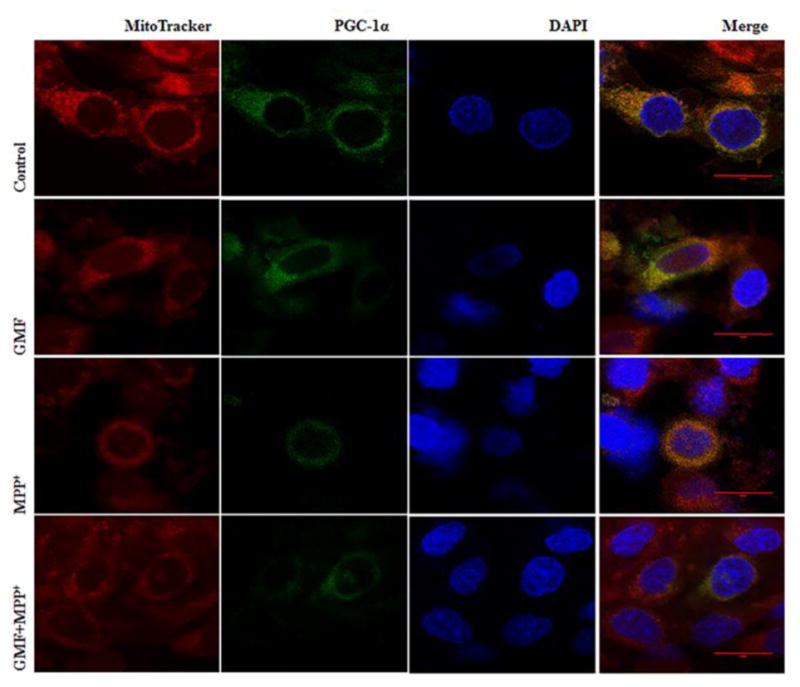
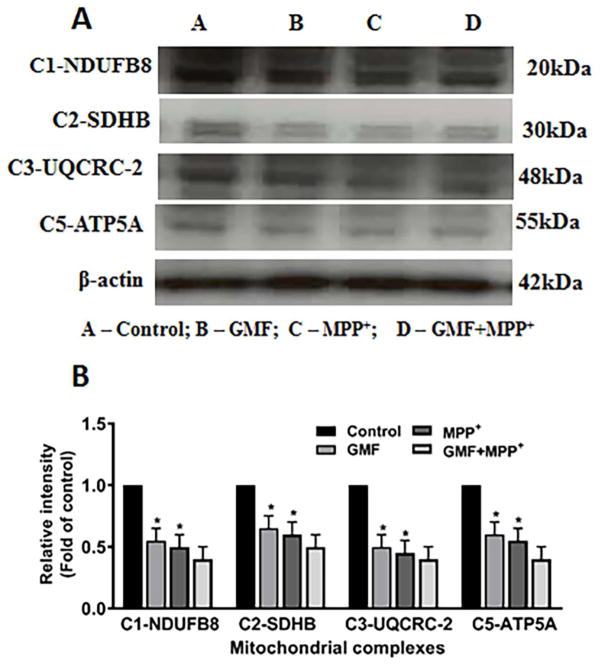
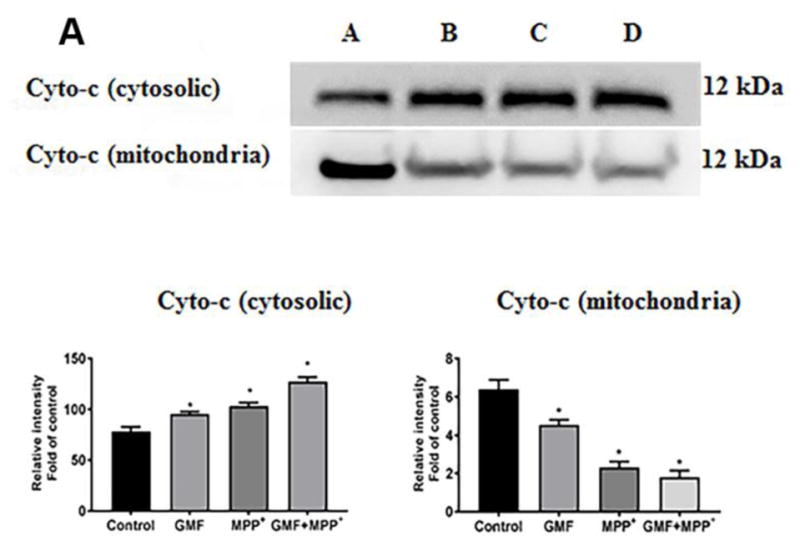
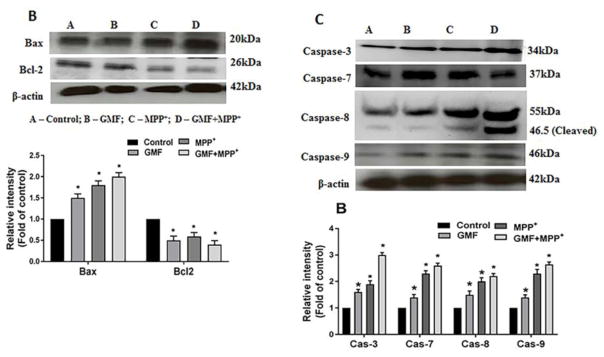
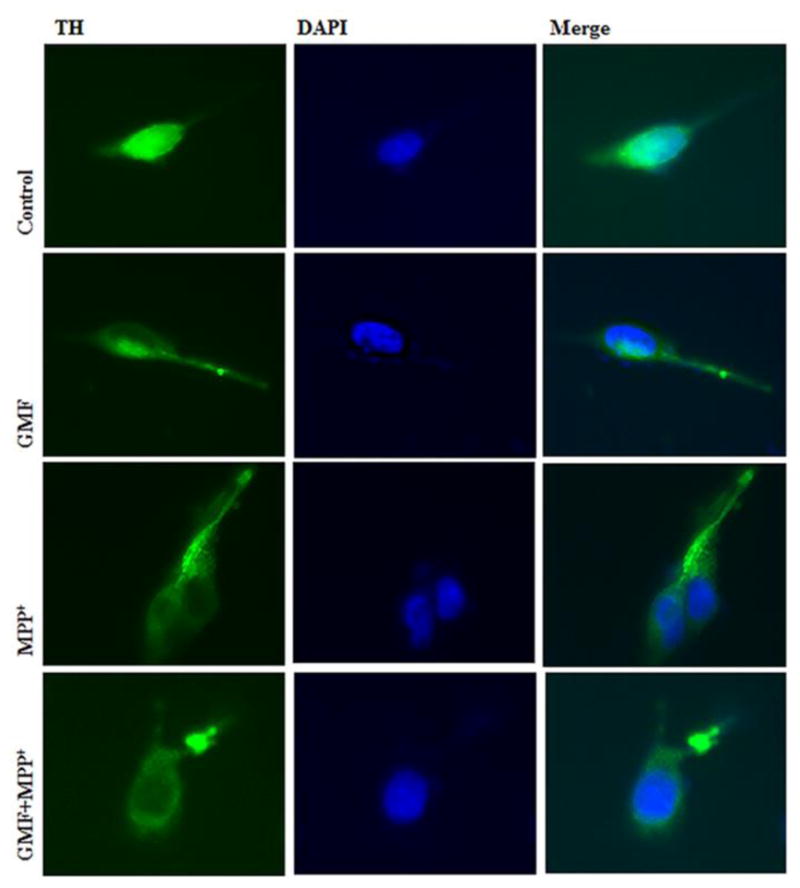
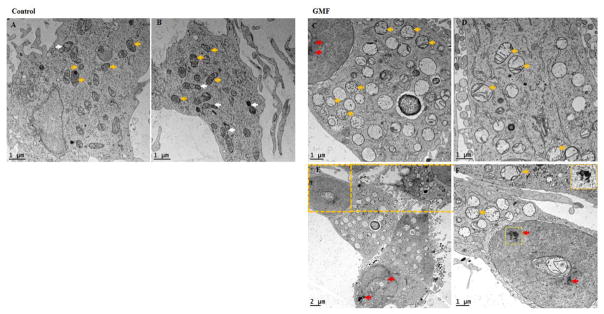
Parkinson's disease (PD) is a progressive neurodegenerative disease affecting over five million individuals worldwide. The exact molecular events underlying PD pathogenesis are still not clearly known. Glia maturation factor (GMF), a neuroinflammatory protein in the brain plays an important role in the pathogenesis of PD. Mitochondrial dysfunctions and oxidative stress trigger apoptosis leading to dopaminergic neuronal degeneration in PD. Peroxisome proliferator-activated receptor-gamma coactivator-1 alpha (PGC-1α or PPARGC-α) acts as a transcriptional co-regulator of mitochondrial biogenesis and energy metabolism by controlling oxidative phosphorylation, antioxidant activity, and autophagy. In this study, we found that incubation of immortalized rat dopaminergic (N27) neurons with GMF influences the expression of peroxisome PGC-1α and increases oxidative stress, mitochondrial dysfunction, and apoptotic cell death. We show that incubation with GMF reduces the expression of PGC-1α with concomitant decreases in the mitochondrial complexes. Besides, there is increased oxidative stress and depolarization of mitochondrial membrane potential (MMP) in these cells. Further, GMF reduces tyrosine hydroxylase (TH) expression and shifts Bax/Bcl-2 expression resulting in release of cytochrome-c and increased activations of effector caspase expressions. Transmission electron microscopy analyses revealed alteration in the mitochondrial architecture. Our results show that GMF acts as an important upstream regulator of PGC-1α in promoting dopaminergic neuronal death through its effect on oxidative stress-mediated apoptosis. Our current data suggest that GMF is a critical risk factor for PD and suggest that it could be explored as a potential therapeutic target to inhibit PD progression.

Keywords: Apoptosis; Dysfunctions; Mitochondrial; Neurodegeneration; Oxidative stress; Parkinson’s disease.


Conflict of interest statement

Conflict of Interest

The authors declare that there are no conflicts of interest.

Figures

Fig. 1
Fig. 1
Effect of GMF on dopaminergic N27 cells viability and proliferation. The dose (0, 50, 100 and 200 ng/ml) dependent effect of GMF toxicity was determined by MTT reduction and LDH release. Different doses of GMF significantly reduced cell viability, and increased LDH release of N27 cells when incubated for 24 h. Values are presented as mean ± SD of four experiments in each group. The maximum of above 50% inhibition concentration value was found to be 100 ng/ml. *indicates significance compared to control cells.
Fig. 2
Fig. 2
GMF potentiates the neurotoxicity through oxidative stress indices in N27 cells. Incubation of N27 cells with GMF (100 ng/ml) for 24 h significantly reduced the activities of GPx (A) and SOD (B) as compared control cells. Incubation of N27 cells with both GMF and MPP+ (300 μm) significantly downregulates the antioxidant status by reduce GPx, and SOD activities when compared with cells incubated only with GMF or MPP+. Values are given as mean ± SD. of four experiments in each group. SOD units-enzyme concentration required for 50% inhibition of nitro blue tetrazolium reduction in 1 min. GPx units-micrograms of glutathione consumed/minute. *p< 0.05 compared to control, and *p< 0.05 compared to GMF treated group.
Fig. 3
Fig. 3
Effect of GMF on ROS expression in dopaminergic N27 cells. N27 cells were seeded (3×10⁶) in 96 well plate and incubated with GMF (100 ng/ml) and/or MPP+ (300 μm) for 24 h. After the incubation period cells washed with PBS and stained with DCFDA green flourescent dye for 35 mins. Microphotographs showing the toxic putative effect of GMF induced ROS generation (green flourescence) by DCFDA staining (200X). The optimum dose of GMF treatment significantly increased the levels of ROS (similar to MPP+ treated cells) as compared to control cells. Incubation of cells with both GMF and MPP+ drastically increased ROS generation compared with cells incubated with only GMF or MPP+. Values are given as mean ± SD. of four experiments in each group. *p< 0.05 compared to control, and *p< 0.05 compared to GMF treated group.
Fig. 4
Fig. 4
Effect of GMF on apoptotic morphological changes in dopaminergic N27 cells. N27 cells were seeded (3×10⁶) in 96 well plate and incubated with GMF (100 ng/ml) and/or MPP+ (300 μm) for 24 h. After the incubation period the cells werewashed with PBS and stained with EtBr/AO fluorescent dye for 15 mins. Images were taken using fluorescence microscope at 200X. Photomicrographs show that GMF exposure increased apoptotic cell death of dopaminergic cells (A). The percentage of viable cells were measured after termination of incubation period (B). The bright green color indicate control cells, orange color indicates the apoptotic cell death (B). *p< 0.05 compared to control, and *p< 0.05 compared to GMF treated group.
Fig. 5
Fig. 5
Effect of GMF on mitochondrial membrane potential (MMP) depolarization in N27 dopaminergic cells. N27 cells were seeded (3×10⁶) in 96 well plate and incubated with GMF (100 ng/ml) and/or MPP+ (300 μm) for 24 h. After the incubation period cells were washed with PBS and stained with the fluorescent dye rhodamine 123 (Rh-123) for 15 mins. Images were taken using fluorescence microscopy at 200X. The photomicrographs show the alteration in MMP induced by GMF in N27 cells after 24 h treatment (A). Expression of GMF significantly decreased MMP (similar to MPP+ treated cells) as compared with control cells (B). The values are given as mean ± SD. of four experiments in each group. *p< 0.05 compared to control, and *p< 0.05 compared to GMF treated group.
Fig. 6
Fig. 6
Effect of GMF on intracellular ATP levels in dopaminergic N27 cells. N27 cells were seeded (1×10⁶) in T25 cell culture flask and incubated with GMF (100 ng/ml) and/or MPP+ (300 μm) for 24 h. After incubation period cells harvested and washed with PBS. The Cell lysates were prepared and intracellular ATP levels determined as per manufacture’s instruction. GMF significantly reduced intracellular ATPlevel (similar to MPP+ treated cells) as compared with control cells. Values are given as mean ± SD. of four experiments in each group. *p< 0.05 compared to control, and *p< 0.05 compared to GMF treated group.
Fig. 7
Fig. 7
Effect of GMF exposure on intracellular mitochondrial morphology detected by MitoTracker Red CMXRos fluorescent staining method. N27 cells were seeded (3×10⁶) in 6 well plate and incubated with GMF (100 ng/ml) and/or MPP+ (300 μm) for 24 h under standard conditions. After incubation period cells washed with PBS. 1 mM of MitoTracker Red CMXRos and 16 mM Hoechst fluorescent dye were prepared and incubated with cells for 20 mins. Exposure of GMF to dopaminergic N27 cells directly affects the cytoplasmic mitochondria mass and induced mitochondrial morphological changes compared with control cells. GMF treatment reduced the MitoTracker Red CMXRos fluorescent stained mitochondria mass as compared with control cells. Images were taken using fluorescence microscopy at 200X.
Fig. 8
Fig. 8
Effect of GMF on PGC-1α expression. N27 cells were seeded in T25 cell culture flask and incubated with GMF (100 ng/ml) and MPP+ (300 μm) for 24 h under standard conditions. After the incubation period cells were washed with PBS and cell lysates were prepared from these cells for western blot studies. GMF treatment significantly reduced expression of PGC-1α expression as seen by immunoblotting as compared with control cells (A). β-actin was used as an internal protein control to show equal protein loading (B). Western blot bands were quantified and the values are expressed as arbitrary units and given as mean ± SD of four experiments in each group. *p< 0.05 compared to control
Fig. 9
Fig. 9
Influence of GMF on PGC-1α immunocytochemical expression in rat dopaminergic N27 cells. N27 cells were incubated in the presence or absence of GMF (100 ng/ml) or MPP+ and immunostained for PGC-1α, and further stained with MitoTracker Red CMXRos finally counterstained with DAPI. Representative images show that exposure of N27 cells to GMF significantly reduced PGC-1α expression, and reduced positive mitochondrial staining (like to MPP+ treated cells) as compared to control cells. Incubation of N27 cells with both GMF and MPP+ simultaneously significantly reduced PGC-1α expression as compared with other group. Images were taken using Leica TCP SP8 laser scanning confocal microscope with a 405-nm diode laser and tunable super continuum white light laser using 63X oil immersion objective.
Fig. 10
Fig. 10
Effect of GMF induced mitochondrial OXPHOS expression in dopaminergic N27 cells. N27 cells were seeded in T25 cell culture flask with appropriate concentration and incubated with GMF (100 ng/ml) and/or MPP+ (300 μm) for 24 h under standard conditions. After incubation period cells washed with PBS and cell lysates were prepared from these cells used to detect the mitochondrial OXPHOS complexes expressions by western blot (A). GMF incubation significantly reduced mitochondrial complexes (NDUFB8, SDHB, UQCRC and ATP5A) as compared with control cells (B). Protein expressions were quantified by using β-actin as an internal control and values are given as mean ± S.D. of four experiments in each group. *p< 0.05 compared to control, and *p< 0.05 compared to GMF treated group.
Fig. 11
Fig. 11
Influences of GMF on the apoptotic and anti-apoptotic markers expression. Cells were treatedin the presence orabsence of GMF (100 ng/ml) and/or MPP+ (300 μm) for 24 h. After the incubation period cell lysates from these cells are used to detect the apoptotic and anti-apoptotic markers expressions by western blot Exposure of N27 cells to GMF significantly increased the cytosolic cytochrome-c (A), increased Bax, reduced Bcl2 (B) and increased caspases 3, 7, 8 and 9; (C) expression when compared with control cells. The band density was quantified by densitometry. β-actin was used as internal standard to normalize the intensity of the protein expressions. Values are given as mean ± SD. of four experiments in each group. *p< 0.05 compared to control, and *p< 0.05 compared to GMF treated group.
Fig. 12
Fig. 12
Effects of GMF on TH immunocytochemical expression in rat dopaminergic N27 cells. N27 cells were incubated in the presence or absence of GMF (100 ng/ml) or MPP+ and double- stained with TH and DAPI. Exposure to GMF showed moderate e TH positive expression as compared with untreated control cells. Incubation of N27 cells with both GMF and MPP+ significantly reduced TH expression as compared with other group. Images were taken using fluorescence microscopy at 200X.
Fig. 13
Fig. 13
Influences of GMF on the ultrastructural changes (mitochondrial integrity and chromatin condensation) in rat dopaminergic N27 cells. Representative transmission electron microscopy (TEM) images analysis of N27 dopaminergic cells exposed to GMF (100 ng/ml) for 24 h. (A and B) untreated control N27 dopaminergic cells; (C, D, E and F) exposed with GMF for 24 h. Exposure toGMF altered the mitochondrial integrity by inhibiting mitochondrial biogenesis and by chromatin condensations as shown in representative images. The figure shows morphology of the mitochondrial structure and the damaged organelle structure (white colored arrows indicate mitochondrial biogenesis; yellow colored arrows indicate mitochondria and red color arrows indicate chromatin condensation) scale bar 1 and 2 μm.
Fig. 14
Fig. 14
Overall mechanism of action of GMF in N27 dopaminergic neuronal cell death through apoptotic intrinsic pathway by inhibition of PGC-1α expression. Inhibition of PGC-1α expression leads to depletion of intracellularATP stores, and causes oxidative flux further leads to shift in Bax and Bcl2 expression with subsequent release of cytochrome-c. Released cytochrome-c binds with Apaf (apoptosis activating factor) to form the apoptosome, which activates effector caspases expression and activation. This further leads to apoptotic dopaminergic neuronal death. Red colored arrows indicates increase or decrease in the intracellular markers expression.

References

    1. Blum D, Torch S, Lambeng N, Nissou M, Benabid AL, Sadoul R, Verna JM. Molecular pathways involved in the neurotoxicity of 6-OHDA, dopamine and MPTP: contribution to the apoptotic theory in Parkinson’s disease. Prog Neurobiol. 2001;65(2):135–172. - PubMed
    1. Frank C, Pari G, Rossiter JP. Approach to diagnosis of Parkinson disease. Can Fam Physician. 2006;52:862–868. - PMC - PubMed
    1. Cory-Slechta DA, Thiruchelvam M, Di Monte DA. Letter regarding: “Paraquat: The Red Herring of Parkinson’s Disease Research”. Toxicological Sciences. 2008;103(1):215–216. doi: 10.1093/toxsci/kfm309. - DOI - PubMed
    1. Eriksen JL, Wszolek Z, Petrucelli L. MOlecular pathogenesis of parkinson disease. Archives of Neurology. 2005;62(3):353–357. doi: 10.1001/archneur.62.3.353. - DOI - PubMed
    1. Kieburtz K, Wunderle KB. Parkinson’s disease: evidence for environmental risk factors. Mov Disord. 2013;28(1):8–13. doi: 10.1002/mds.25150. - DOI - PubMed

MeSH terms

LinkOut - more resources