. 2018 Apr 15;596(8):1433-1466.
doi: 10.1113/JP275719.

Ca2+ signalling in mouse urethral smooth muscle in situ: role of Ca2+ stores and Ca2+ influx mechanisms

Affiliations

Ca2+ signalling in mouse urethral smooth muscle in situ: role of Ca2+ stores and Ca2+ influx mechanisms

Bernard T Drumm et al. J Physiol. .

Abstract

Key points: Contraction of urethral smooth muscle cells (USMCs) contributes to urinary continence. Ca2+ signalling in USMCs was investigated in intact urethral muscles using a genetically encoded Ca2+ sensor, GCaMP3, expressed selectively in USMCs. USMCs were spontaneously active in situ, firing intracellular Ca2+ waves that were asynchronous at different sites within cells and between adjacent cells. Spontaneous Ca2+ waves in USMCs were myogenic but enhanced by adrenergic or purinergic agonists and decreased by nitric oxide. Ca2+ waves arose from inositol trisphosphate type 1 receptors and ryanodine receptors, and Ca2+ influx by store-operated calcium entry was required to maintain Ca2+ release events. Ca2+ release and development of Ca2+ waves appear to be the primary source of Ca2+ for excitation-contraction coupling in the mouse urethra, and no evidence was found that voltage-dependent Ca2+ entry via L-type or T-type channels was required for responses to α adrenergic responses.

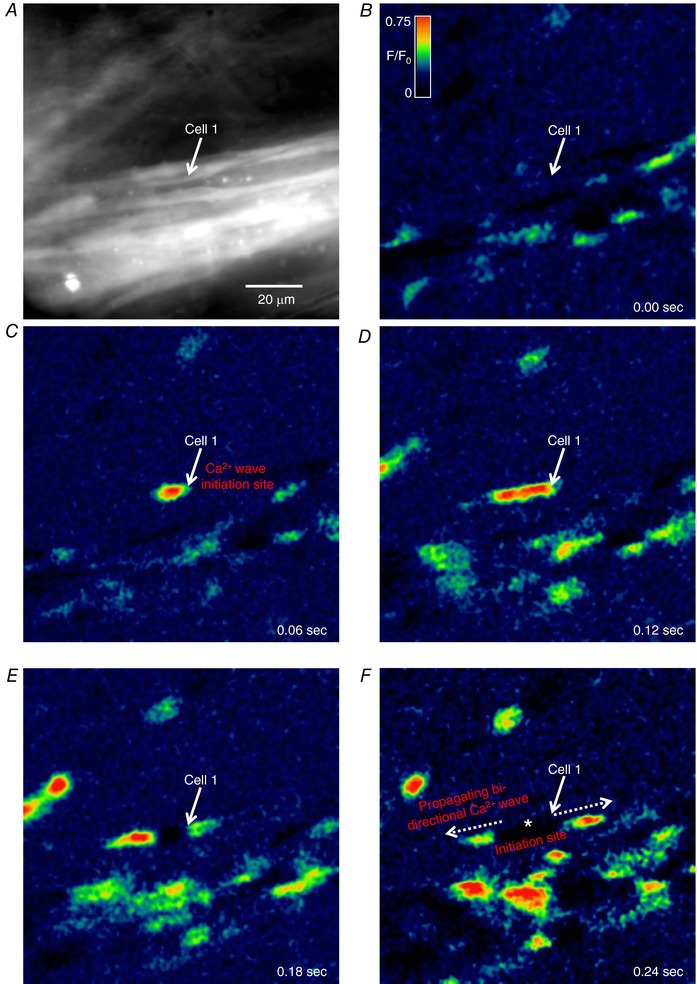
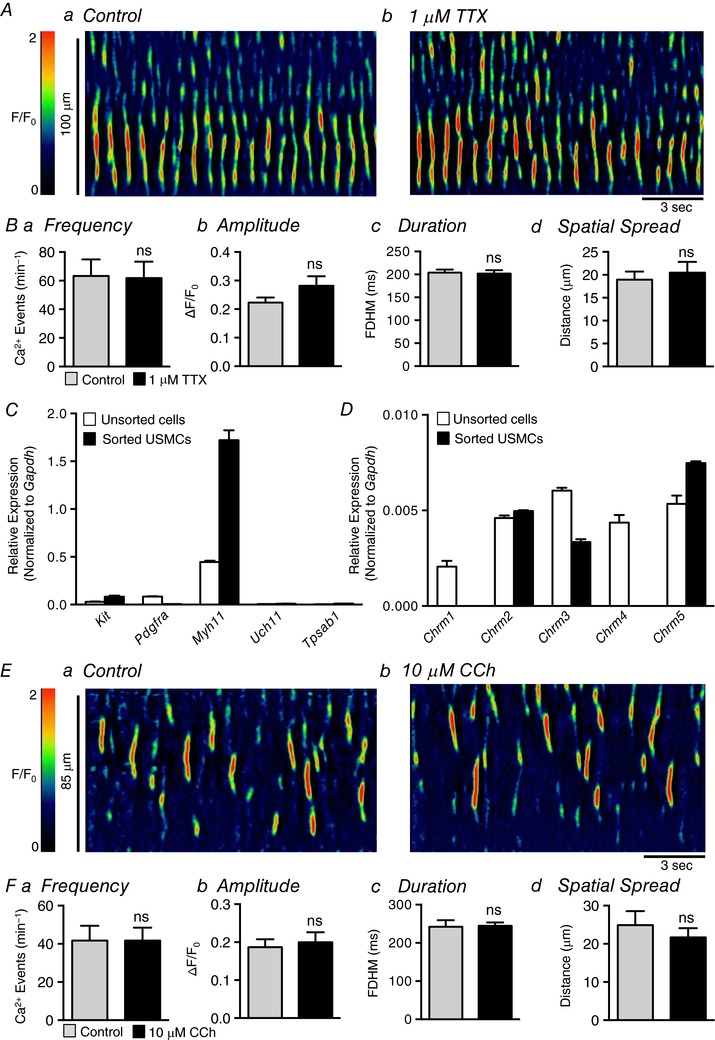
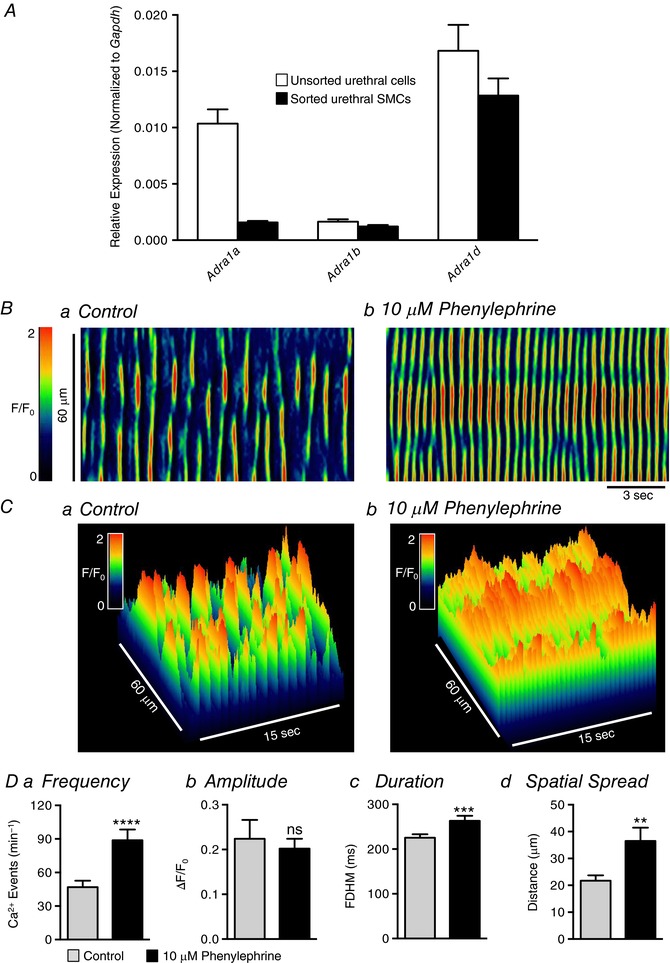
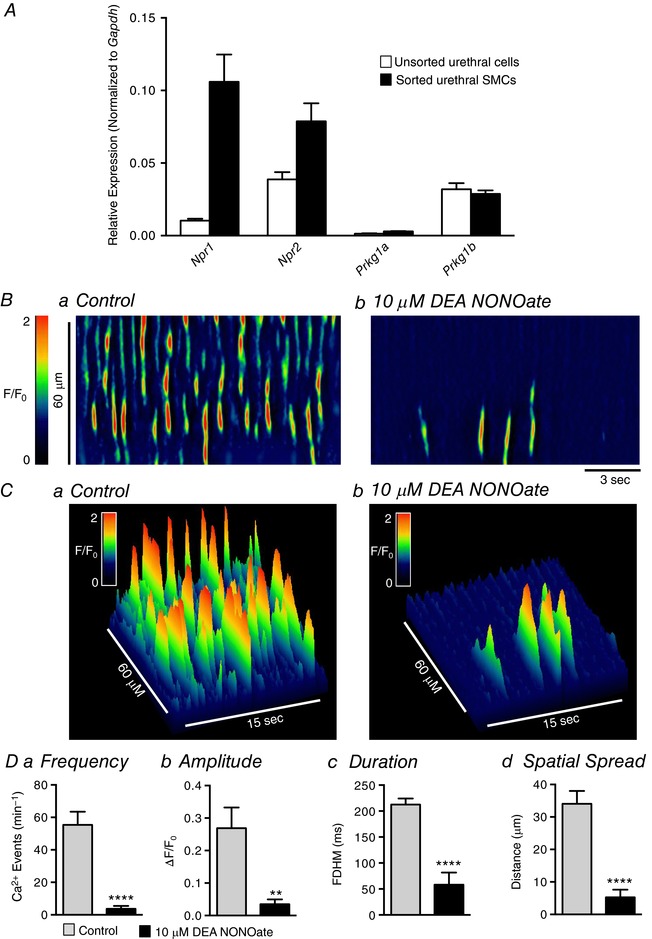
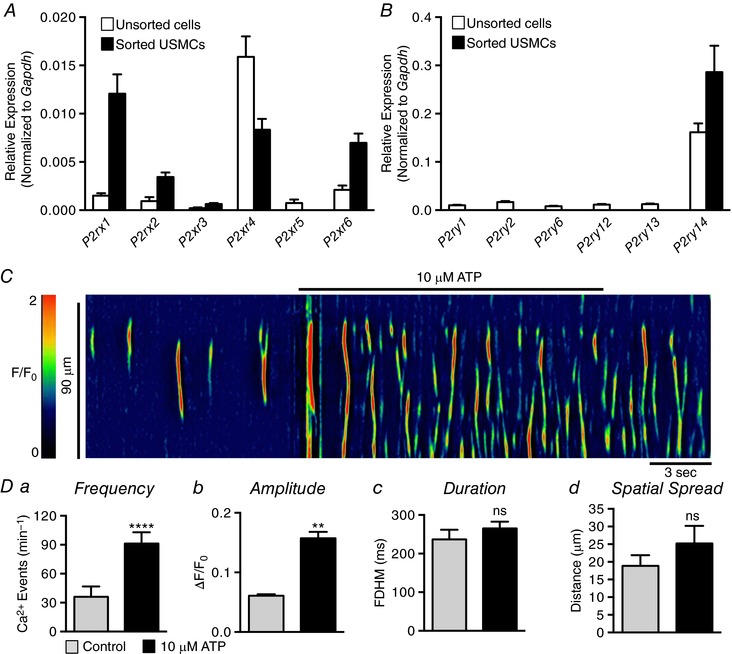
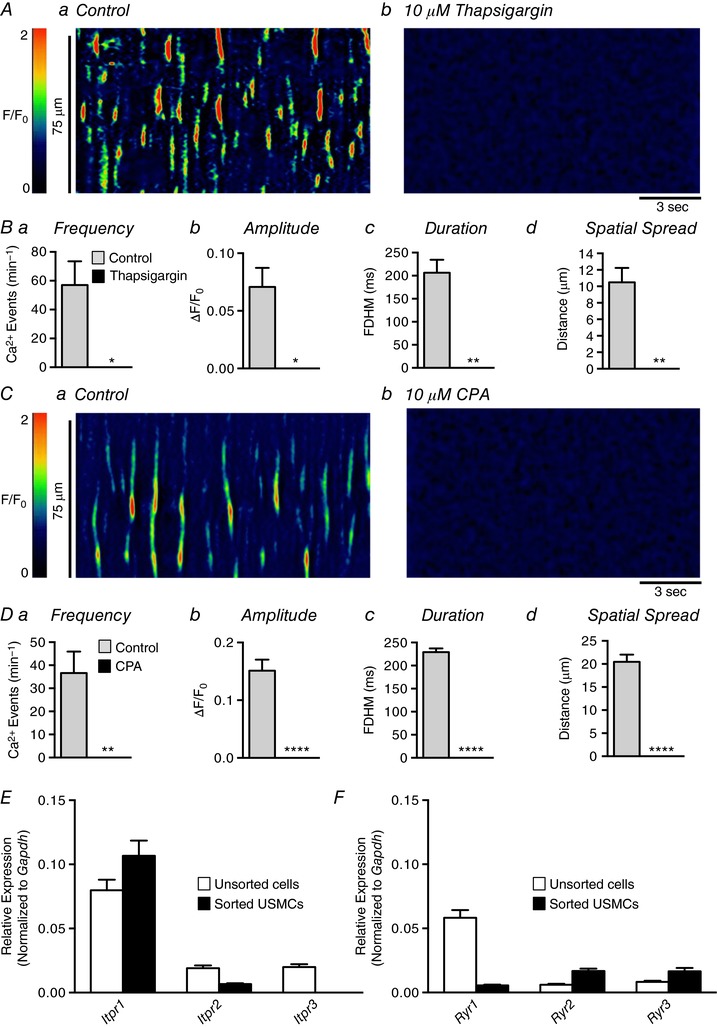
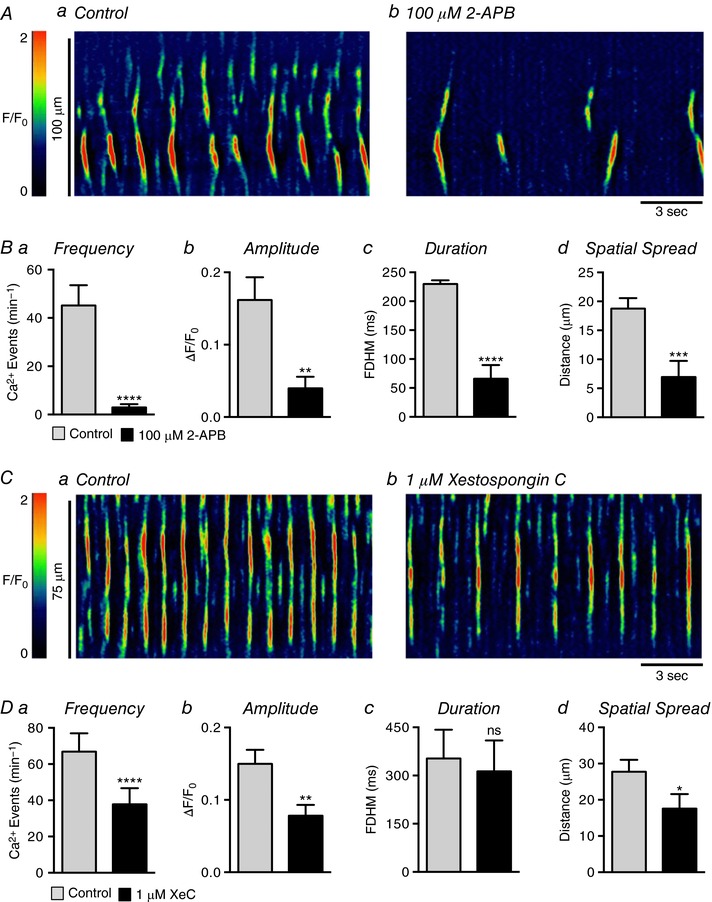
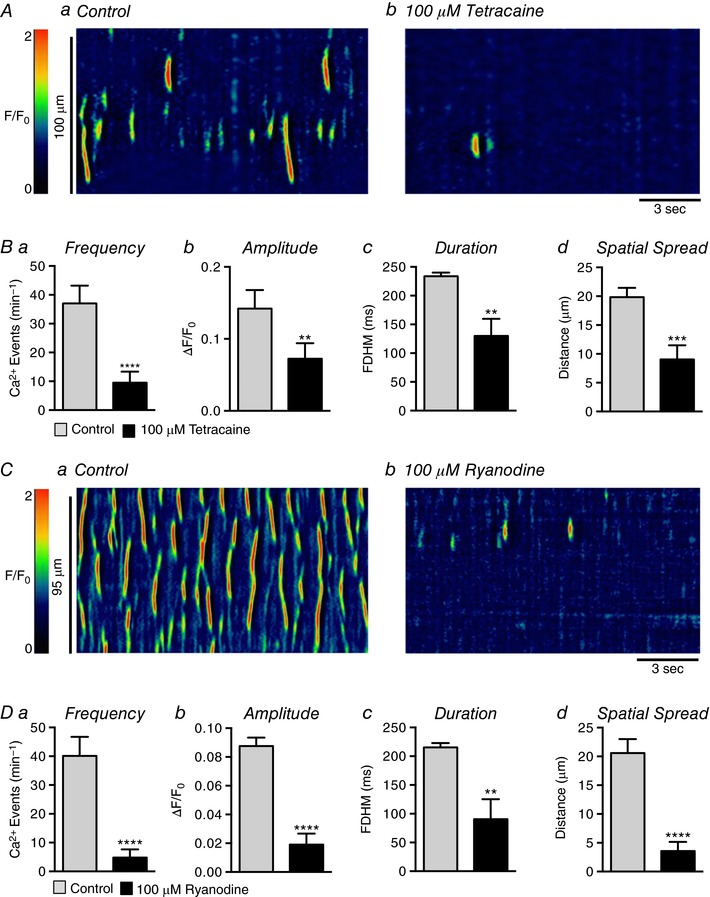
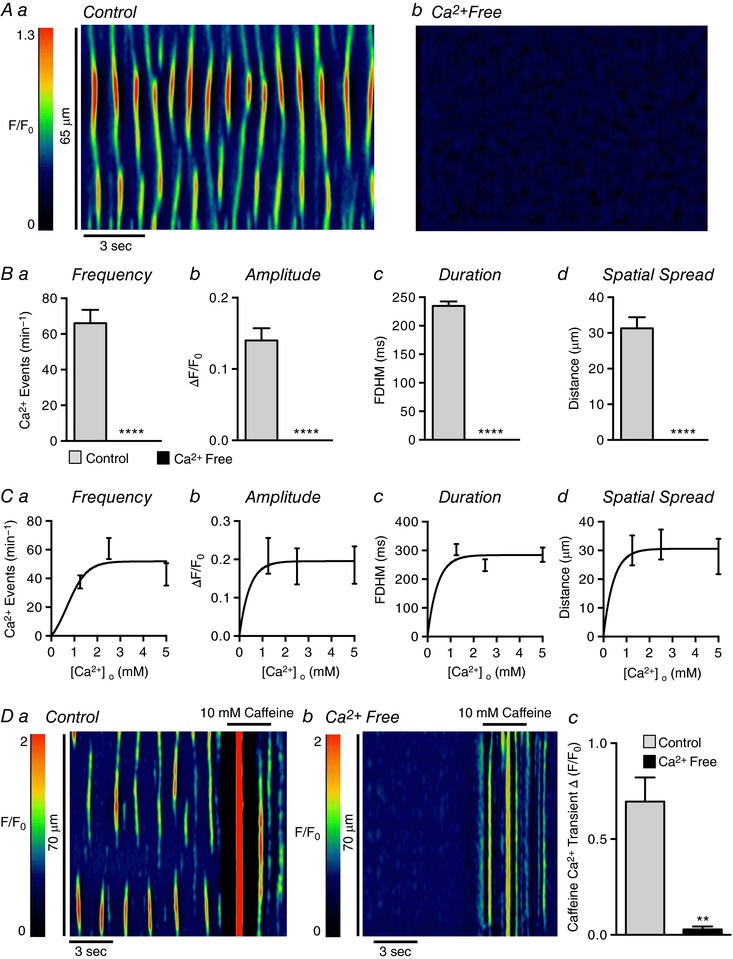
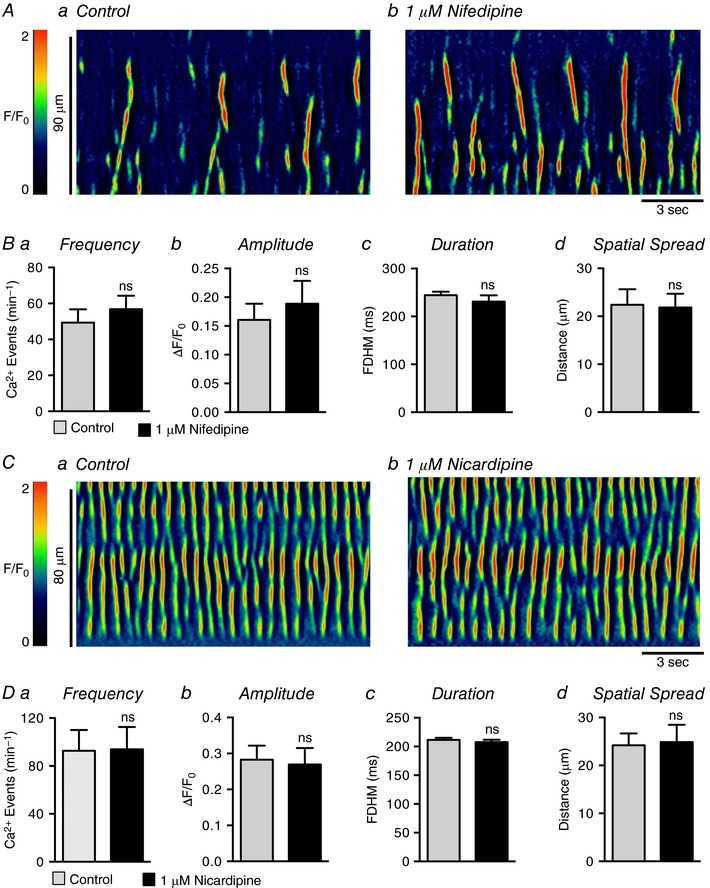
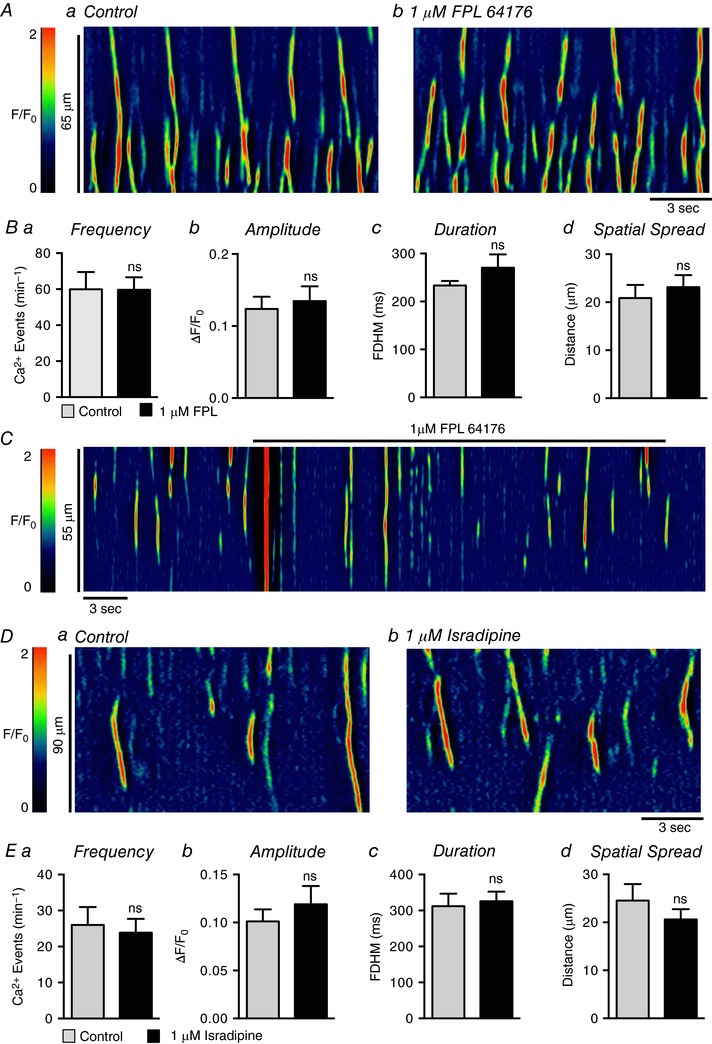
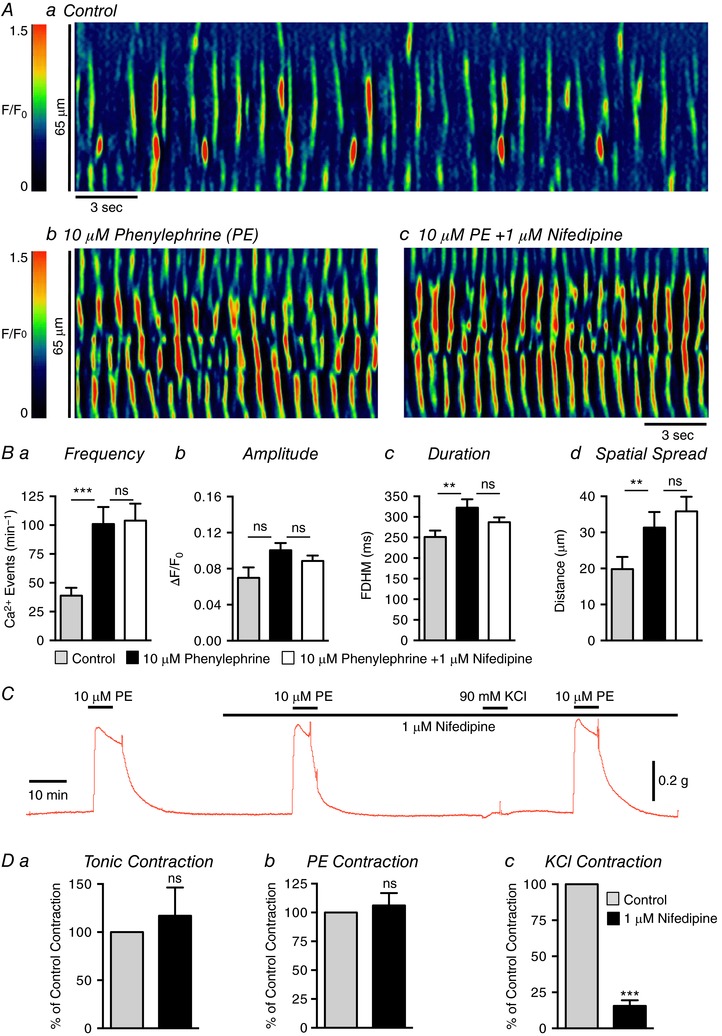
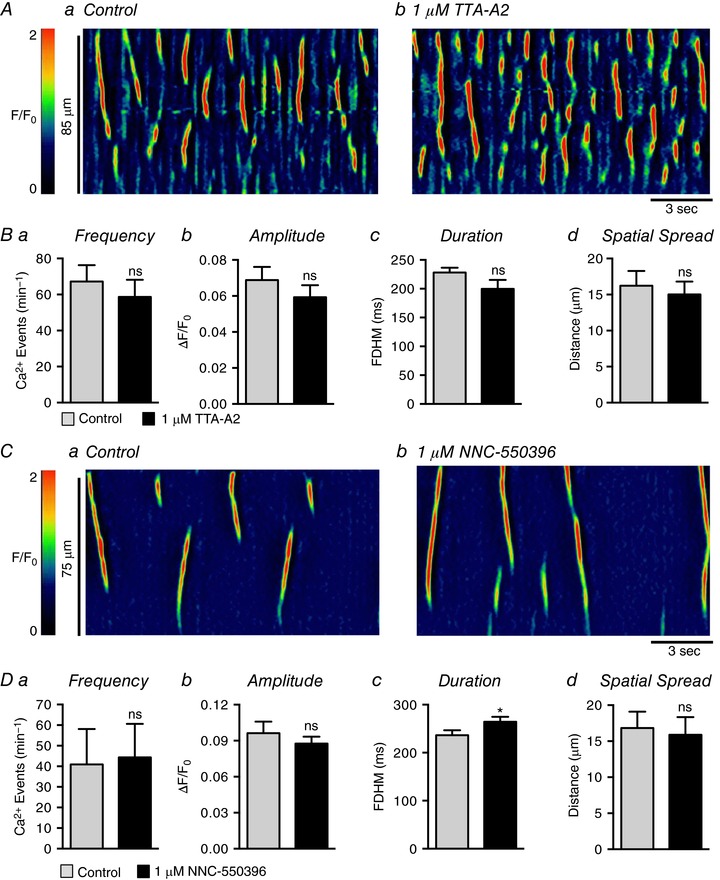
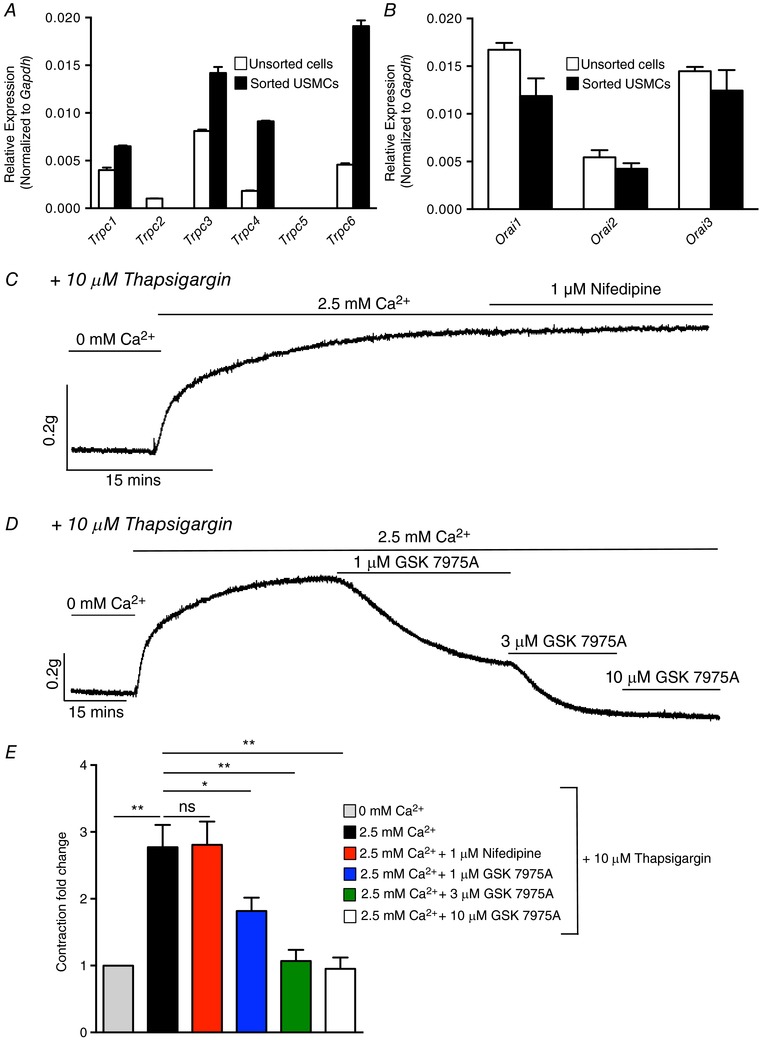
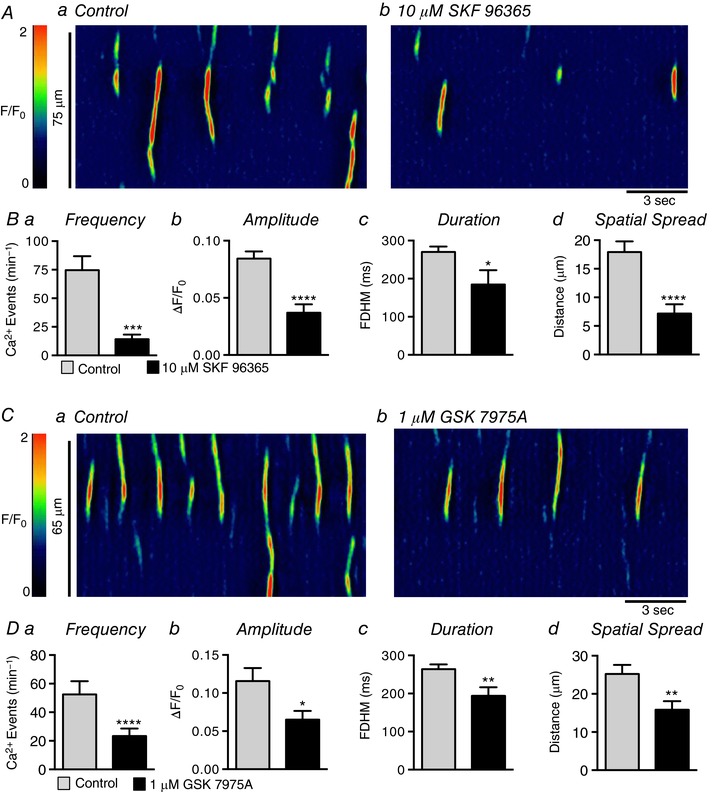
Abstract: Urethral smooth muscle cells (USMCs) generate myogenic tone and contribute to urinary continence. Currently, little is known about Ca2+ signalling in USMCs in situ, and therefore little is known about the source(s) of Ca2+ required for excitation-contraction coupling. We characterized Ca2+ signalling in USMCs within intact urethral muscles using a genetically encoded Ca2+ sensor, GCaMP3, expressed selectively in USMCs. USMCs fired spontaneous intracellular Ca2+ waves that did not propagate cell-to-cell across muscle bundles. Ca2+ waves increased dramatically in response to the α1 adrenoceptor agonist phenylephrine (10 μm) and to ATP (10 μm). Ca2+ waves were inhibited by the nitric oxide donor DEA NONOate (10 μm). Ca2+ influx and release from sarcoplasmic reticulum stores contributed to Ca2+ waves, as Ca2+ free bathing solution and blocking the sarcoplasmic Ca2+ -ATPase abolished activity. Intracellular Ca2+ release involved cooperation between ryanadine receptors and inositol trisphosphate receptors, as tetracaine and ryanodine (100 μm) and xestospongin C (1 μm) reduced Ca2+ waves. Ca2+ waves were insensitive to L-type Ca2+ channel modulators nifedipine (1 μm), nicardipine (1 μm), isradipine (1 μm) and FPL 64176 (1 μm), and were unaffected by the T-type Ca2+ channel antagonists NNC-550396 (1 μm) and TTA-A2 (1 μm). Ca2+ waves were reduced by the store operated Ca2+ entry blocker SKF 96365 (10 μm) and by an Orai antagonist, GSK-7975A (1 μm). The latter also reduced urethral contractions induced by phenylephrine, suggesting that Orai can function effectively as a receptor-operated channel. In conclusion, Ca2+ waves in mouse USMCs are a source of Ca2+ for excitation-contraction coupling in urethral muscles.

Keywords: Ca2+ imaging; lower urinary tract; optogenetics; store-operated Ca2+ entry; urinary continence.


Figures

Figure 1
Figure 1. Spontaneous intracellular Ca2+ waves in USMCs
A, representative image of a USMC bundle imaged from a SmMHC‐Cre‐GCaMP3 mouse urethra with a 60× objective. The white arrow highlights a cell of interest. BF, time‐lapse montage of spontaneous intracellular Ca2+ activity in USMCs in situ with a bi‐directional Ca2+ wave in the highlighted cell emphasized throughout. The initiation site of this Ca2+ wave is indicated in F by the white asterisks. Panels are colour coded as F/F 0 as shown in B.
Figure 2
Figure 2. Characterization of USMC intracellular Ca2+ events
A, representative spatio‐temporal (ST) map of spontaneous intracellular Ca2+ waves recorded in situ. The ST map is calibrated for amplitude as F/F 0 and colour coded accordingly. B, xy plot of the Ca2+ activity represented in A. C, 3‐D plot representation of the ST map shown in A. D, 3‐D plot profile of 5 representative Ca2+ waves from the ST map in A. E, summary histograms showing the distribution of values for USMC Ca2+ event frequency (a), amplitude (b), duration (c), spatial spread (d), velocity (e) and number of firing sites (f) (c = 301, n = 31).
Figure 3
Figure 3. Asynchronous firing of USMC intracellular Ca2+ events
A, representative ST map of USMC Ca2+ activity showing multiple Ca2+ firing sites along the length of the cell, 4 of which are indicated by the black, blue, red and green arrows. B, colour coded plot profiles of the Ca2+ activity at each of the corresponding colour coded Ca2+ firing sites indicated in A. C, image from a FOV of USMCs in situ recorded with a 60× objective showing 2 adjacent cells illustrated by the green and red ROIs. The activity of these adjacent cells is plotted below the image. D, ST maps of cell 1 and cell 2 represented in C which have been uniformly coloured to show all Ca2+ activity in the cell as either red (cell 1) or green (cell 2). These ST maps are then merged at the bottom of the panel.
Figure 4
Figure 4. The effects of TTX and carbachol on USMC Ca2+ transients
Aa and b, representative ST maps of Ca2+ transient firing within a single USMC recorded in situ during control conditions (a) and after incubation with 1 μm TTX (b). Ba–d, summary data showing the effect of 1 μm TTX on USMC Ca2+ transient frequency (a), amplitude (b), duration (c) and spatial spread (d) (c = 18, n = 6). C, relative expression of cellular identification genes in FACS sorted and unsorted urethral cells from SMC‐eGFP mice determined by qPCR analysis, normalized to Gapdh expression (n = 4). Genes examined are Kit (tyrosine kinase receptor, found in interstitial cells of Cajal), Pdgfra found in PDGFRα+ interstitial cells, Myh11 (smooth muscle myosin), Uch11 (neural marker encoding PGP 9.5) and Tpsab1 (mast cell tryptase). D, relative expression of muscarinic receptor genes in FACS sorted and unsorted urethral cells from SMC‐eGFP mice determined by qPCR analysis, normalized to Gapdh expression (n = 4). Ea and b, representative ST maps of Ca2+ transient firing within a single USMC recorded in situ during control conditions (a) and after incubation with 10 μm CCh (b). Fa–d, summary data showing the effect of 10 μm CCh on USMC Ca2+ transient frequency (a), amplitude (b), duration (c) and spatial spread (d) (c = 13, n = 4). ns, not significant.
Figure 5
Figure 5. Phenylephrine increases USMC Ca2+ transient firing
A, relative expression of adrenergic α1 receptor genes in FACS sorted and unsorted urethral cells from SMC‐eGFP mice determined by qPCR analysis, normalized to Gapdh expression (n = 4). Ba and b, representative ST maps of Ca2+ transient firing within a single USMC recorded in situ during control conditions (a) and after incubation with 10 μm phenylephrine (b). C, 3‐D plots of the ST maps shown in A. Da–d, summary data showing the effect of 10 μm phenylephrine on USMC Ca2+ transient frequency (a), amplitude (b), duration (c) and spatial spread (d) (c = 34, n = 10). ns, not significant, ** p < 0.01, *** p < 0.001, **** p < 0.0001.
Figure 6
Figure 6. Nitric oxide decreases USMC Ca2+ transient firing
A, relative expression of guanylate cyclase and protein kinase G genes in FACS sorted and unsorted urethral cells from SMC‐eGFP mice determined by qPCR analysis, normalized to Gapdh expression (n = 4). Ba and b, representative ST maps of Ca2+ transient firing within a single USMC recorded in situ during control conditions (a) and after incubation with 10 μm DEA NONOate (b). C, 3‐D plots of the ST maps shown in A. Da–d, summary data showing the effect of 10 μm DEA NONOate on USMC Ca2+ transient frequency (a), amplitude (b), duration (c) and spatial spread (d) (c = 19, n = 6). ** p < 0.01, **** p < 0.0001.
Figure 7
Figure 7. The effects of purines on USMC Ca2+ transients
A, relative expression of P2X receptor genes in FACS sorted and unsorted urethral cells from SMC‐eGFP mice determined by qPCR analysis, normalized to Gapdh expression (n = 4). B, relative expression of P2Y receptor genes in FACS sorted and unsorted urethral cells from SMC‐eGFP mice determined by qPCR analysis, normalized to Gapdh expression (n = 4). C, representative ST map showing the effect of 10 μm ATP on Ca2+ transient firing in USMCs. Da–d, summary data showing the effect of 10 μm ATP on USMC Ca2+ transient frequency (a), amplitude (b), duration (c) and spatial spread (d) (c = 5, n = 3). ns, not significant, ** p < 0.01, **** p < 0.0001.
Figure 8
Figure 8. Ca2+ transients in USMCs rely on functional SR stores
Aa and b, representative ST maps showing the effect of 10 μm thapsigargin on Ca2+ transient firing in USMCs. Ba–d, summary data showing the effect of 10 μm thapsigargin on USMC Ca2+ transient frequency (a), amplitude (b), duration (c) and spatial spread (d) (c = 4, n = 3). Ca and b, representative ST maps showing the effect of 10 μm CPA on Ca2+ transient firing in USMCs. Da–d, summary data showing the effect of 10 μm CPA on USMC Ca2+ transient frequency (a), amplitude (b), duration (c) and spatial spread (d) (c = 13, n = 5). E, relative expression of IP3R genes in FACS sorted and unsorted urethral cells from SMC‐eGFP mice determined by qPCR analysis, normalized to Gapdh expression (n = 4). F, relative expression of RyR genes in FACS sorted and unsorted urethral cells from SMC‐eGFP mice determined by qPCR analysis, normalized to Gapdh expression (n = 4). * p < 0.05, ** p < 0.01, **** p < 0.0001.
Figure 9
Figure 9. The effect of blocking IP3Rs on USMC Ca2+ waves
Aa and b, representative ST maps showing the effect of 100 μm 2‐APB on Ca2+ transient firing in USMCs. Ba–d, summary data showing the effect of 100 μm 2‐APB on USMC Ca2+ transient frequency (a), amplitude (b), duration (c) and spatial spread (d) (c = 19, n = 6). Ca and b, representative ST maps showing the effect of 1 μm xestospongin C (XeC) on Ca2+ transient firing in USMCs. Da–d, summary data showing the effect of XeC on USMC Ca2+ transient frequency (a), amplitude (b), duration (c) and spatial spread (d) (c = 20, n = 5). ns, not significant, * p < 0.05, ** p < 0.01, *** p < 0.001, **** p < 0.0001.
Figure 10
Figure 10. The effect of blocking RyRs on USMC Ca2+ waves
Aa and b, representative ST maps showing the effect of 100 μm tetracaine on Ca2+ transient firing in USMCs. Ba–d, summary data showing the effect of 100 μm tetracaine on USMC Ca2+ transient frequency (a), amplitude (b), duration (c) and spatial spread (d) (c = 18, n = 6). Ca and b, representative ST maps showing the effect of 100 μm ryanodine on Ca2+ transient firing in USMCs. Da–d, summary data showing the effect of 100 μm ryanodine on USMC Ca2+ transient frequency (a), amplitude (b), duration (c) and spatial spread (d) (c = 5, n = 14). * p < 0.01, *** p < 0.001, **** p < 0.0001.
Figure 11
Figure 11. Generation of USMC Ca2+ transients requires extracellular Ca2+ influx to replenish SR stores
Aa and b, representative ST maps showing the effect of Ca2+ free solution on Ca2+ transient firing in USMCs. Ba–d, summary data showing the effect of Ca2+ free solution on USMC Ca2+ transient frequency (a), amplitude (b), duration (c) and spatial spread (d) (c = 19, n = 5). Ca–d, dose–response graphs showing the effect of lowering or increasing extracellular Ca2+ on USMC Ca2+ transients (c = 7, n = 4). Da and b, representative ST maps showing the effect of Ca2+ free solution on 10 mm caffeine‐induced Ca2+ transients in USMCs. Summary data are shown in Dc (c = 7, n = 4). * p < 0.01, **** p < 0.0001.
Figure 12
Figure 12. Spontaneous Ca2+ transients in USMCs are insensitive to L‐type Ca2+ channel blockers
Aa and b, representative ST maps showing the effect of 1 μm nifedipine on Ca2+ transient firing in USMCs. Ba–d, summary data showing the effect of 1 μm nifedipine on USMC Ca2+ transient frequency (a), amplitude (b), duration (c) and spatial spread (d) (c = 22, n = 6). Ca and b, representative ST maps showing the effect of 1 μm nicardipine on Ca2+ transient firing in USMCs. Da–d, summary data showing the effect of 1 μm nicardipine on USMC Ca2+ transient frequency (a), amplitude (b), duration (c) and spatial spread (d) (c = 15, n = 5). ns, not significant.
Figure 13
Figure 13. The effect of FPL 64176 and isradipine on USMC Ca2+ transients
Aa and b, representative ST maps showing the effect of 1 μm FPL 64176 on Ca2+ transient firing in USMCs. Ba–d, summary data showing the effect of 1 μm FPL 64176 on USMC Ca2+ transient frequency (a), amplitude (b), duration (c) and spatial spread (d) (c = 18, n = 6). C, representative ST map showing the effect of rapidly applying 1 μm FPL 64176 to USMC Ca2+ transients. Da and b, representative ST maps showing the effect of 1 μm isradipine on Ca2+ transient firing in USMCs. Ea–d, summary data showing the effect of 1 μm isradipine on USMC Ca2+ transient frequency (a), amplitude (b), duration (c) and spatial spread (d) (c = 14, n = 4). ns, not significant.
Figure 14
Figure 14. PE excitatory response is insensitive to L‐type Ca2+ channel inhibition
Aa–c, representative ST maps showing Ca2+ transient firing in USMCs during control conditions (a), in the presence of 10 μm phenylephrine (b) and in the presence of 10 μm phenylephrine + 1 μm nifedipine (c). Ba–d, summary data showing the effect of 1 μm nifedipine on the phenylephrine response on USMC Ca2+ transient frequency (a), amplitude (b), duration (c) and spatial spread (d) (c = 12, n = 4). C, representative contractile data showing the effect of 1 μm nifedipine on urethral contractions induced by phenylephrine and 90 mm extracellular K+. D, summary data showing the effect of 1 μm nifedipine on urethral tone (a) and contractions induced by phenylephrine (b) and 90 mm extracellular K+ (c) (n = 6). ns, not significant, ** p < 0.01, *** p < 0.001.
Figure 15
Figure 15. USMC Ca2+ waves are insensitive to T‐type Ca2+ channel blockers
Aa and b , representative ST maps showing the effect of 1 μm TTA‐A2 on Ca2+ transient firing in USMCs. Ba–d, summary data showing the effect of 1 μm TTA‐A2 on USMC Ca2+ transient frequency (a), amplitude (b), duration (c) and spatial spread (d) (c = 16, n = 5). Ca and b, representative ST maps showing the effect of 1 μm NNC‐550396 on Ca2+ transient firing in USMCs. Da–d, summary data showing the effect of 1 μm NNC‐550396 on USMC Ca2+ transient frequency (a), amplitude (b), duration (c) and spatial spread (d) (c = 13, n = 4). ns, not significant, * p < 0.05.
Figure 16
Figure 16. Store operated Ca2+ entry (SOCE) in USM
A, relative expression of TRPC genes in FACS sorted and unsorted urethral cells from SMC‐eGFP mice determined by qPCR analysis, normalized to Gapdh expression (n = 4). B, relative expression of Orai channel genes in FACS sorted and unsorted urethral cells from SMC‐eGFP mice determined by qPCR analysis, normalized to Gapdh expression (n = 4). C, representative contractile data showing a protocol to induce SOCE in USM. Basal USM contraction is shown at the start of the trace when intracellular Ca2+ stores were passively depleted by incubating the tissue in 0 mm Ca2+ solution and thapsigargin (10 μm). Reintroduction of [Ca2+]o (2.5 mm) in the continued presence of thapsigargin led to development of a sustained tonic contraction that was insensitive to nifedipine. D, contractile trace showing the effect of GSK 7975A (1–10 μm) on SOCE induced tonic contraction of USM. E, summary data showing the effects of nifedipine and GSK 7975A on the sustained tonic contraction induced in USM using the SOCE protocol described in C and D. Contractions are expressed as fold changes normalized to contractile level in 0 mm Ca2+ + thapsigargin (10 μm; n = 8). ns, not significant, * p < 0.05, ** p < 0.01.
Figure 17
Figure 17. SOCE blockers inhibit Ca2+ transients in USMCs
Aa and b , representative ST maps showing the effect of 10 μm SKF 96365 on Ca2+ transient firing in USMCs. Ba–d, summary data showing the effect of 10 μm SKF 96365 on USMC Ca2+ transient frequency (a), amplitude (b), duration (c) and spatial spread (d) (c = 20, n = 5). Ca and b, representative ST maps showing the effect of 1 μm GSK 7975A on Ca2+ transient firing in USMCs. Da–d, summary data showing the effect of 1 μm GSK 7975A on USMC Ca2+ transient frequency (a), amplitude (b), duration (c) and spatial spread (d) (c = 17, n = 6). * p < 0.05, ** p < 0.01, *** p < 0.001, **** p < 0.0001.
Figure 18
Figure 18. SOCE can influence PE induced contractions in USM
A, representative contractile data showing the effect of 1–10 μm GSK 7975A on urethral contractions induced by increasing concentration of PE (0.1–30 μm). B, summary data showing the effect of 1–10 μm GSK 7975A on urethral contractions induced by increasing concentration of PE (0.1–30 μm, n = 6). * p < 0.05, ** p < 0.01, **** p < 0.0001.

Similar articles

Cited by

References

    1. Alexandre EC, Kiguti LR, Calmasini FB, Silva FH, da Silva KP, Ferreira R, Ribeiro CA, Mónica FZ, Pupo AS & Antunes E (2016). Mirabegron relaxes urethral smooth muscle by a dual mechanism involving β3‐adrenoceptor activation and α1‐adrenoceptor blockade. Br J Pharmacol 173, 415–428. - PMC - PubMed
    1. Amundson J & Clapham D (1993). Calcium waves. Curr Biol 3, 375–382. - PubMed
    1. Andersson KE (2001). Neurotransmission and drug effects in urethral smooth muscle. Scand J Urol Nephrol Suppl 207, 26–34. - PubMed
    1. Andersson KE, Larsson B & Sjögren C (1984). Characterisation of the α‐adrenoceptors in the female rabbit urethra. Br J Pharmacol 81, 293–300. - PMC - PubMed
    1. Baker SA, Drumm BT, Saur D, Hennig GW, Ward SM & Sanders KM (2016). Spontaneous Ca2+ transients in interstitial cells of Cajal located within the deep muscular plexus of the murine small intestine. J Physiol 594, 3317–3338. - PMC - PubMed

Publication types

LinkOut - more resources