. 2018 Apr;47(7):845-857.
doi: 10.1111/ejn.13850. Epub 2018 Feb 19.

Circadian expression and functional characterization of PEA-15 within the mouse suprachiasmatic nucleus

Affiliations

Circadian expression and functional characterization of PEA-15 within the mouse suprachiasmatic nucleus

Kelin Wheaton et al. Eur J Neurosci. 2018 Apr.

Abstract

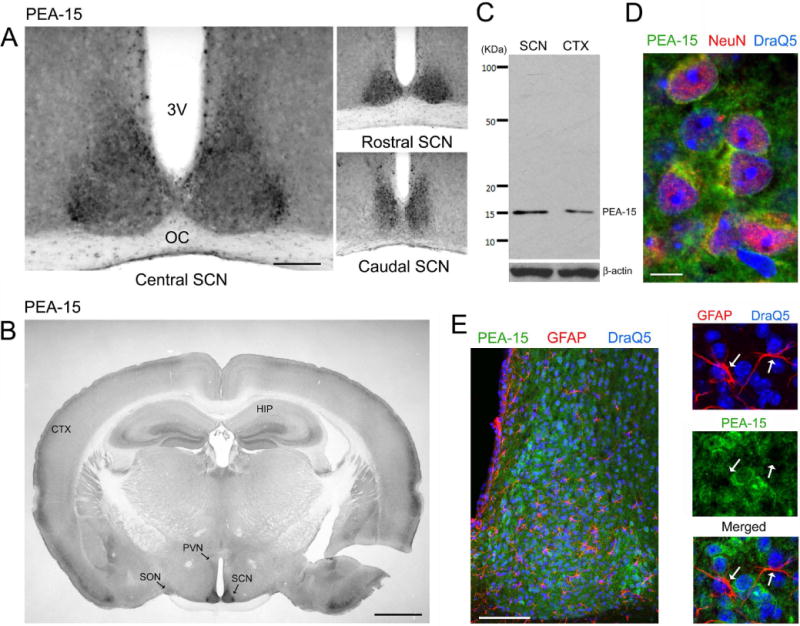
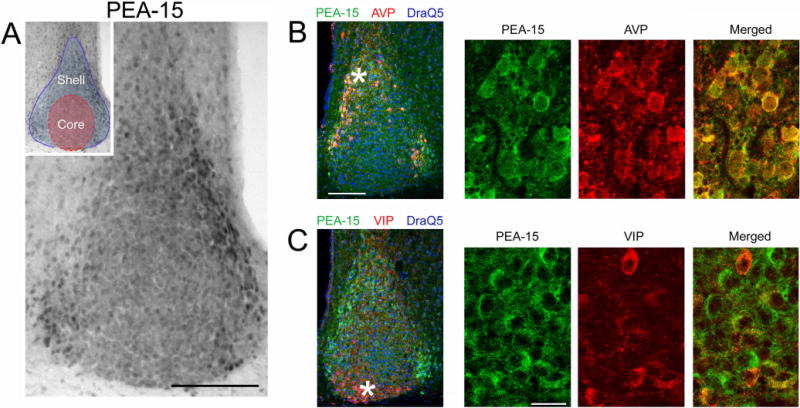
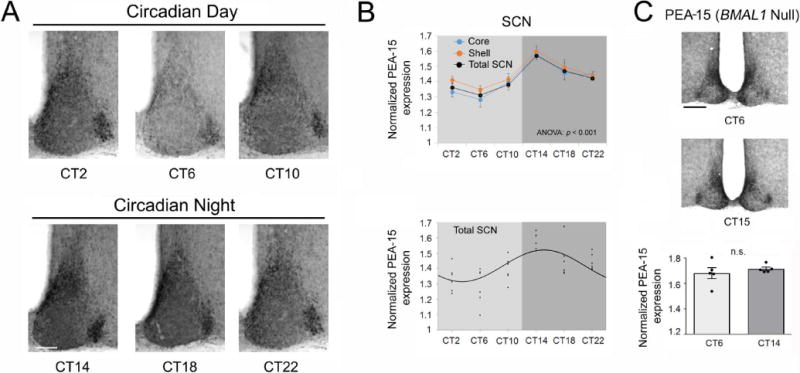
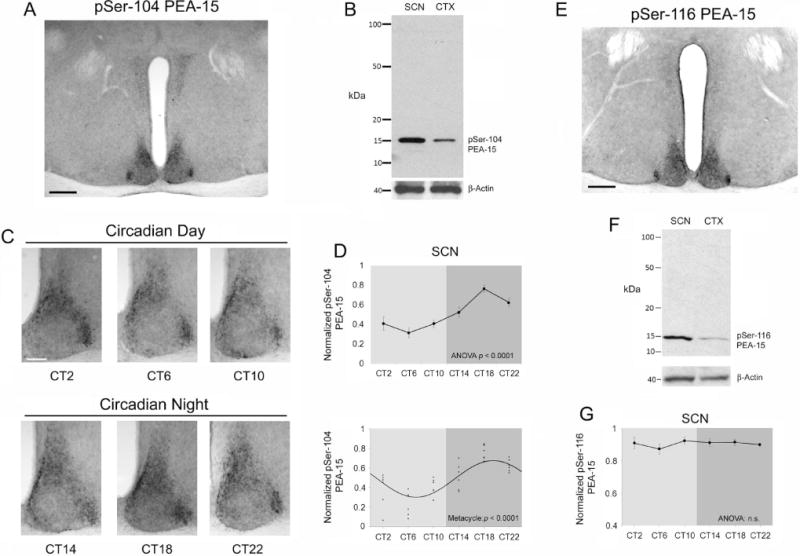
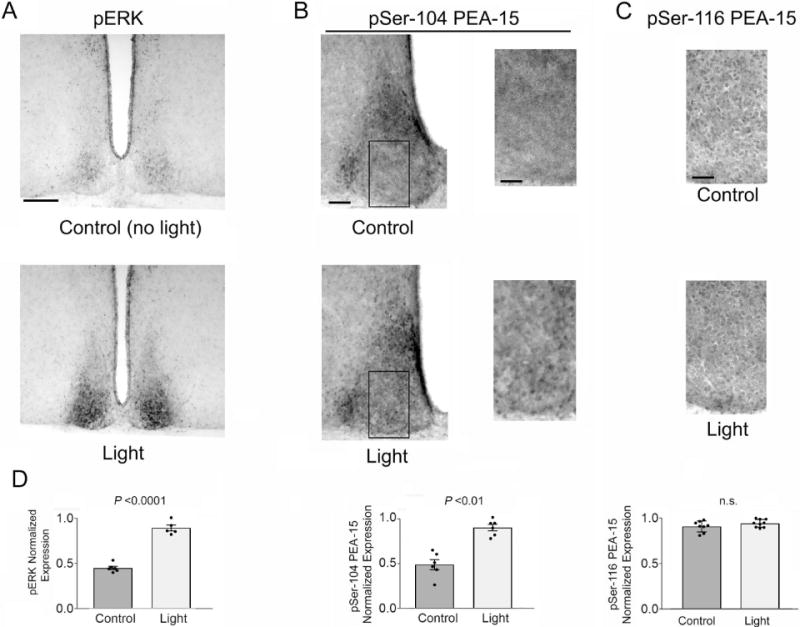
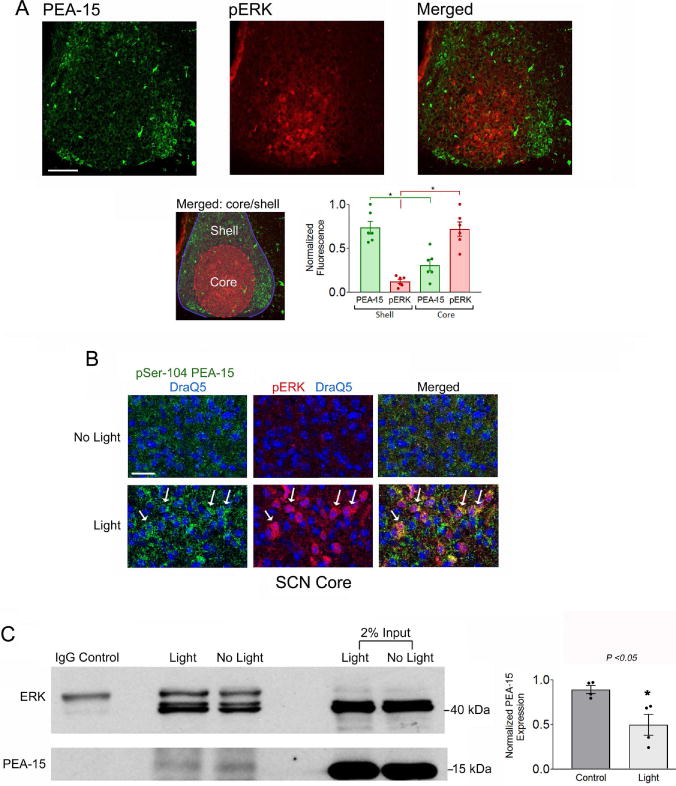
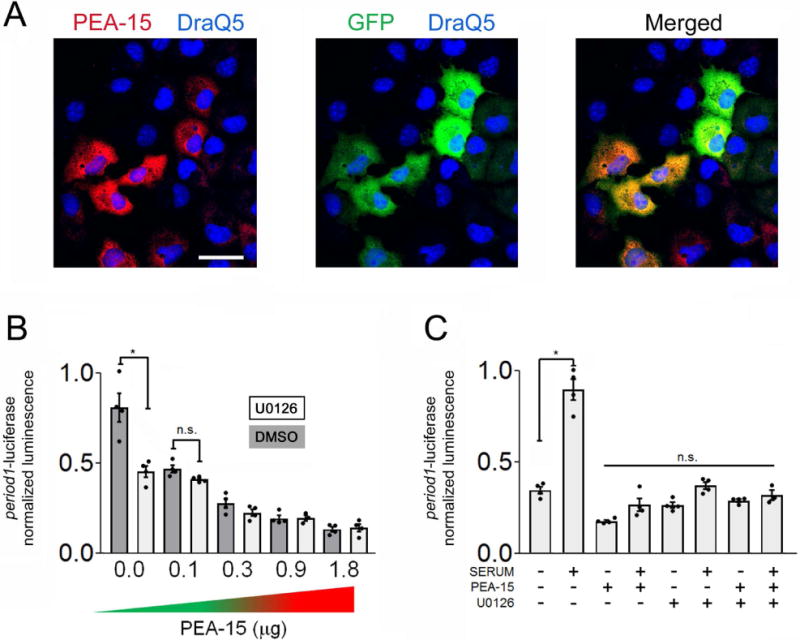
The circadian timing system influences the functional properties of most, if not all, physiological processes. Central to the mammalian timing system is the suprachiasmatic nucleus (SCN) of the hypothalamus. The SCN functions as a 'master clock' that sets the phasing of ancillary circadian oscillator populations found throughout the body. Further, via an entraining input from the retina, the SCN ensures that the clock oscillators are synchronized to the daily light/dark cycle. A critical component of the SCN timing and entrainment systems is the p44/42 mitogen-activated protein kinase (ERK/MAPK) pathway. Here, we examined the expression and function of phosphoprotein-enriched in astrocytes (PEA-15), an ERK scaffold protein that serves as a key regulator of MAPK signaling. A combination of immunolabeling and Western blotting approaches revealed high levels of PEA-15 within the SCN. PEA-15 expression was enriched in distinct subpopulations of SCN neurons, including arginine vasopressin (AVP)-positive neurons of the SCN shell region. Further, expression profiling detected a significant circadian oscillation in PEA-15 expression within the SCN. Brief photic stimulation during the early subjective night led to a significant increase in PEA-15 phosphorylation, an event that can trigger ERK/PEA-15 dissociation. Consistent with this, co-immunoprecipitation assays revealed that PEA-15 is directly bound to ERK in the SCN and that photic stimulation leads to their dissociation. Finally, we show that PEA-15 regulates ERK/MAPK-dependent activation of the core clock gene period1. Together, these data raise the prospect that PEA-15 functions as a key regulator of the SCN timing system.

Keywords: ERK; C57Bl/6; PEA-15; circadian; suprachiasmatic nucleus.


Conflict of interest statement

CONFLICT OF INTEREST

The authors declare no competing financial interests.

Figures

Figure 1
Figure 1. PEA-15 expression in the SCN
A) Representative PEA-15 immunolabeling within the central, rostral and caudal SCN. 3V, Third ventricle; OC, Optic chiasm Bar: 200 microns. B) Low magnification (4×) image of PEA-15. Marked expression of PEA-15 was observed in the SCN, with a lower level of expression observed in the paraventricular nucleus (PVN) and supraoptic nucleus (SON). HIP: hippocampus; CTX: cortex. Bar = 1 mm. C) Western blotting of cortical (CTX) and SCN lysates for PEA-15. As a loading control, the membrane was re-probed for β-actin. D) High magnification confocal image of PEA-15 (green), the neuronal nuclear marker NeuN (red) and the nuclear stain DraQ5 (blue) in the central SCN. PEA-15 was detected within the neuronal cytoplasm and perinuclear regions. Bar: 10 microns. E) Left panel: Low magnification image of the SCN immunolabeled for PEA-15 (green), the astrocytic marker, GFAP (red) and DraQ5 (blue). Right panels: magnified region from the central SCN: the three channels were overlaid in different combinations to aid in analyzing astrocytic PEA-15 expression. Arrows denote the locations of two astrocytes, as assessed using GFAP labeling. Of note, limited PEA-15 was detected in astrocytes. Bar = 100 microns.
Figure 2
Figure 2. Cellular phenotype-specific expression of PEA-15 in the SCN
A) Immunohistochemical (IHC) labeling for PEA-15 in the SCN. Enriched PEA-15 was detected in the lateral and dorsal regions of the SCN. Inset: two functionally- and phenotypically-defined regions of the SCN are noted. Red shading corresponds to the core region; the blue outline and shading defines the shell region. Bar = 100 microns. B) Left panel: Fluorescent immunolabeling for PEA-15 (green channel), AVP (red channel) and DraQ5 (blue channel) in the SCN. Asterisk denotes the approximate location of the high magnification images shown in the rightward panels. Bar = 100 microns. C) Left panel: Fluorescent immunolabeling for PEA-15 (green), VIP (red) and DraQ5 (blue) in the SCN. Asterisk denotes the approximate location of the high magnification images shown in the rightward panels. Bar = 20 microns.
Figure 3
Figure 3. Profiling PEA-15 expression across the circadian cycle
A) Representative IHC labeling for PEA-15; tissue was profiled at 4-hr intervals over a 24-hr period. Bar = 100 microns. B) Top graph: Densitometric analysis of PEA-15 IHC labeling over the circadian cycle in the SCN; profiling was also performed on core and shell subregions (n = 6 animals/time point). Significant time-of-day expression was observed in the SCN and within the noted subregions. Data were analyzed by one-way ANOVA (p < 0.001 for the SCN and for regional analyses). Bottom graph: Scatter-plot of the normalized PEA-15 data for the SCN. Each data point represents the mean value from an individual mouse. Data were fitted to a cosine curve, as described in the Methods section. C) Top: Representative images of PEA-15 expression in BMAL1 null mice. Animals were sacrificed at circadian time 6 (CT 6) and CT 15 (n = 5 animals/time point/genotype). Bar = 175 microns. Bottom: Densitometric analysis (both mean values and scatterplot data from individual mice) of PEA-15 IHC labeling in the SCN of BMAL1 null mice. PEA-15 expression was not significantly different at the two noted circadian times: Data were analyzed by Student’s t-test. n.s.: not significant (p >0.05).
Figure 4
Figure 4. Profiling phosphorylated PEA-15 expression across the circadian cycle
A) Representative 4× image of phospho-Serine-104 PEA-15 (pSer-104 PEA-15). Bar = 300 microns. B) Western blot of SCN and cortical (CTX) lysates for pSer-104 PEA-15. As a loading control, the membrane was re-probed for β- actin. C) Circadian profiling of pSer-104 PEA-15 at 4-hr intervals over a 24-hr period. Representative SCN images reveal an increase in Ser104 PEA-15 phosphorylation during the subjective nighttime. Bar = 100 microns. D) Top graph: Quantitative analysis of pSer-104 PEA-15 expression over the circadian cycle in the SCN (top) (n = 6 animals/time point) and analyzed via one-way ANOVA (p < 0.0001). Bottom panel: Scatter-plot of the normalized pSer-104 PEA-15 data. Data were fitted to a cosine curve, as described in the Methods section. E) Representative 4× image of phospho- Serine-116-PEA-15 (pSer-116 PEA-15) expression in the SCN. Bar = 300 microns. F) Western blot of SCN and cortical (CTX) lysates probed for pSer-116 PEA-15. As a loading control, the membrane was re-probed for β-actin (shown at the bottom). G) Quantitative analysis of pSer-116 PEA-15 expression over the circadian cycle in the SCN (n = 5 animals/time point). One-way ANOVA did not detect a time-of-day change in pSer-116 PEA-15 in the SCN. n.s.: not significant (p>0.05).
Figure 5
Figure 5. Light regulates PEA-15 phosphorylation in the SCN
Mice were dark-adapted two days prior to a 30-second light pulse at CT 15, and then immediately sacrificed. A) IHC labeling was used to detect a light-evoked increase in ERK phospho-activation, relative to the control, no light, condition. Bar = 225 microns. B) Left panels: Representative 20× images of the SCN immunolabeled for the expression of pSer-104 PEA-15. Boxed regions are magnified (right panels), and used to highlight the increase in Ser104 phosphorylation in response to light. Bar = 100 microns. C) Representative high magnification images of pSer-116 PEA-15 in the SCN core region following the 30 sec light-pulse paradigm described in A. Note the consistent number of Ser-116 phosphorylated cells in the control and light-pulsed animal. Bar = 30 microns. D) Quantification of pERK-expression (left panel), pSer-104 PEA-15- positive cells within the SCN core (middle panel) and pSer-116 PEA-15-positive cells within the SCN core (right panel) in control and light-pulsed mice. Analysis was performed on 5–9 mice/group. Data were analyzed via the Student’s t-test. n.s.: not significant.
Figure 6
Figure 6. pERK and PEA-15 expression patterns and functional interactions
A) Top panels: Mice were dark-adapted for two days, pulsed with light (30 seconds, 100 lux) at CT15 and the SCN tissue was immunolabeled for PEA-15 and phospho-ERK (pERK). Light trigged marked ERK activation within the SCN core, a region that exhibited low levels of PEA-15, relative to the shell region. Bar = 75 microns. Bottom left panel: the merged image was color-coded to delineate the two noted regions; Red shading corresponds to the core region; the blue outline and shading defines the shell region. Bottom right panel: Densitometric analysis of PEA-15 and pERK expression in the core and shell regions of the SCN: data were analyzed by Student’s t-test. *: p < 0.0001. B) Representative confocal images of pSer-104 PEA-15 (green channel), pERK (red channel) and DraQ5 (blue channel) from the SCN core region. Relative to the no light condition, light triggered a marked increase in PEA-15 phosphorylation and ERK activation. Arrows denote cells with relatively high levels of pSer-104 PEA-15 and pERK. Bar = 40 microns. C) Left panel: Co-immunoprecipitation of SCN tissue from control and light-treated animals sacrificed at CT15. Total ERK was immunoprecipitated and probed via Western blotting for ERK and PEA-15. Relative to the control condition, the amount of immunoprecipitated PEA- 15 was reduced following light treatment. Tissue was pooled from 8 SCN samples for each condition, and the experimental results were performed using four separate trials. Right panel: Quantitative analysis of PEA-15 expression in the immunoprecipitated lysates from control and light-treated mice. Data were averaged from quadruplicate determinations and presented as normalized values and were analyzed by Student’s t-test *: p < 0.05.
Figure 7
Figure 7. PEA-15 regulates period1 expression
A) Cos7 cells were transfected with a PEA-15 reporter construct that also expresses the transfection marker GFP. Representative images of PEA-15 (red channel), GFP (green channel) and DraQ5 labeling (blue channel). Bar = 20 microns. B) The period1-luciferase reporter was cotransfected with increasing concentrations of the PEA-15 expression vector, or an empty expression vector. Note the concentration dependent reduction in period1-dependent transcription. Further, pretreatment with U0126 (10 μM) reduced period1-dependent transcription, but it did not markedly affect the suppressive effects of transgenic PEA-15. C) Serum-evoked period1 transcription was suppressed by transfection with PEA-15 (1.0 μg). Pretreatment with U0126 (10 μM) reduced serum-induced period1-dependent transcription, but it did not have additive suppressive effects with transgenic PEA- 15. For all experiments, data were averaged from triplicate determinations and are representative of 3 independent trials analyzed by a one-way ANOVA followed by Bonferroni multiple comparison tests *: p < 0.001; n.s: not significant (p > 0.05).

Similar articles

Cited by

References

    1. Agostino PV, Ferreyra GA, Murad AD, Watanabe Y, Golombek DA. Diurnal, circadian and photic regulation of calcium/calmodulin-dependent kinase II and neuronal nitric oxide synthase in the hamster suprachiasmatic nuclei. Neurochem Int. 2004;44:617–625. - PubMed
    1. Akashi M, Hayasaka N, Yamazaki S, Node K. Mitogen-activated protein kinase is a functional component of the autonomous circadian system in the suprachiasmatic nucleus. J Neurosci. 2008;28:4619–4623. - PMC - PubMed
    1. Akiyama M, Kouzu Y, Takahashi S, Wakamatsu H, Moriya T, Maetani M, Watanabe S, Tei H, Sakaki Y, Shibata S. Inhibition of light- or glutamate-induced mPer1 expression represses the phase shifts into the mouse circadian locomotor and suprachiasmatic firing rhythms. J Neurosci. 1999;19:1115–1121. - PMC - PubMed
    1. Albrecht U, Sun ZS, Eichele G, Lee CC. A differential response of two putative mammalian circadian regulators, mper1 and mper2, to light. Cell. 1997;91:1055–1064. - PubMed
    1. Araujo H, Danziger N, Cordier J, Glowinski J, Chneiweiss H. Characterization of PEA-15, a major substrate for protein kinase C in astrocytes. J Biol Chem. 1993;268:5911–5920. - PubMed

Publication types