

Increased FXYD1 and PGC-1α mRNA after blood flow-restricted running is related to fibre type-specific AMPK signalling and oxidative stress in human muscle
- PMID: 29383885
- PMCID: PMC5969286
- DOI: 10.1111/apha.13045
Increased FXYD1 and PGC-1α mRNA after blood flow-restricted running is related to fibre type-specific AMPK signalling and oxidative stress in human muscle
Abstract
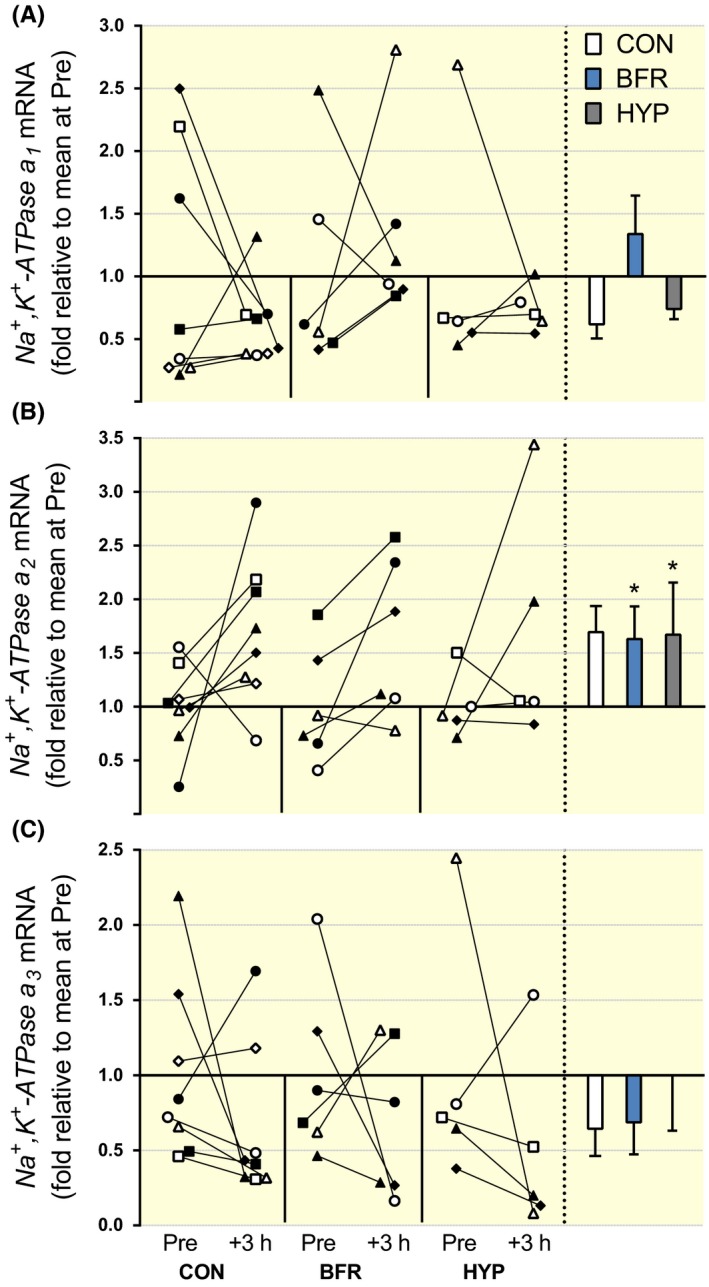
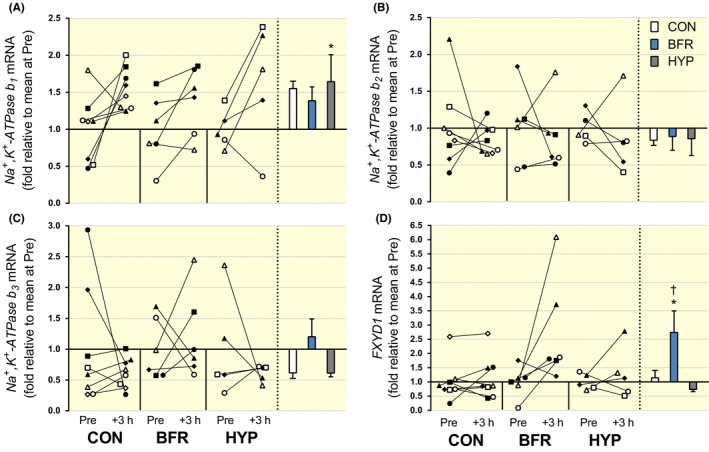
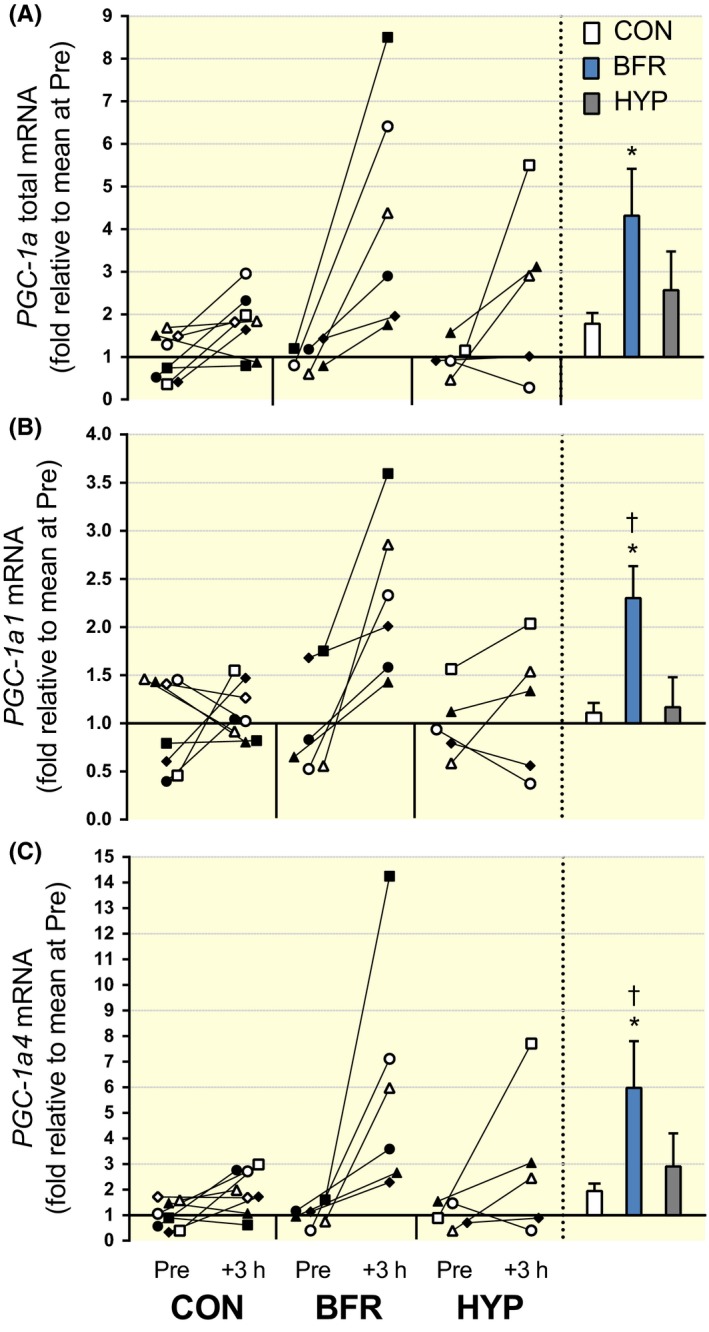
Aim: This study explored the effects of blood flow restriction (BFR) on mRNA responses of PGC-1α (total, 1α1, and 1α4) and Na+ ,K+ -ATPase isoforms (NKA; α1-3 , β1-3 , and FXYD1) to an interval running session and determined whether these effects were related to increased oxidative stress, hypoxia, and fibre type-specific AMPK and CaMKII signalling, in human skeletal muscle.
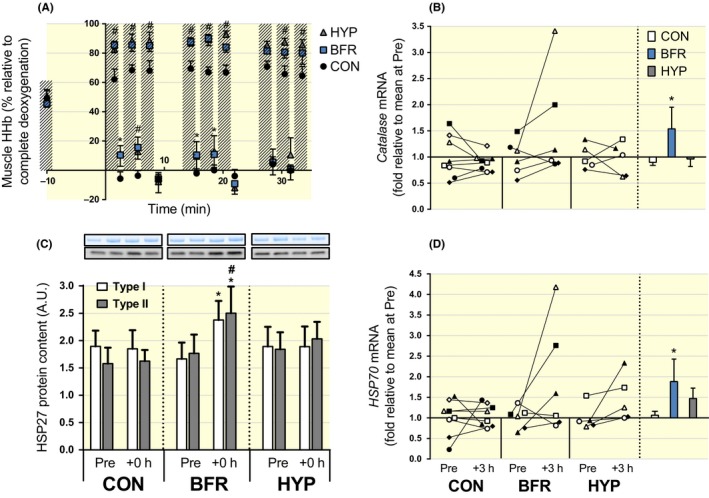
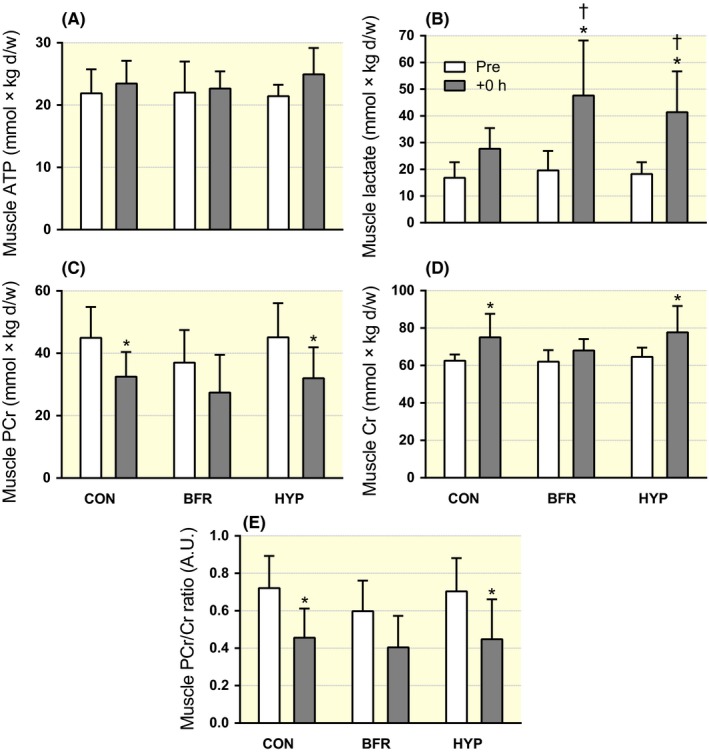
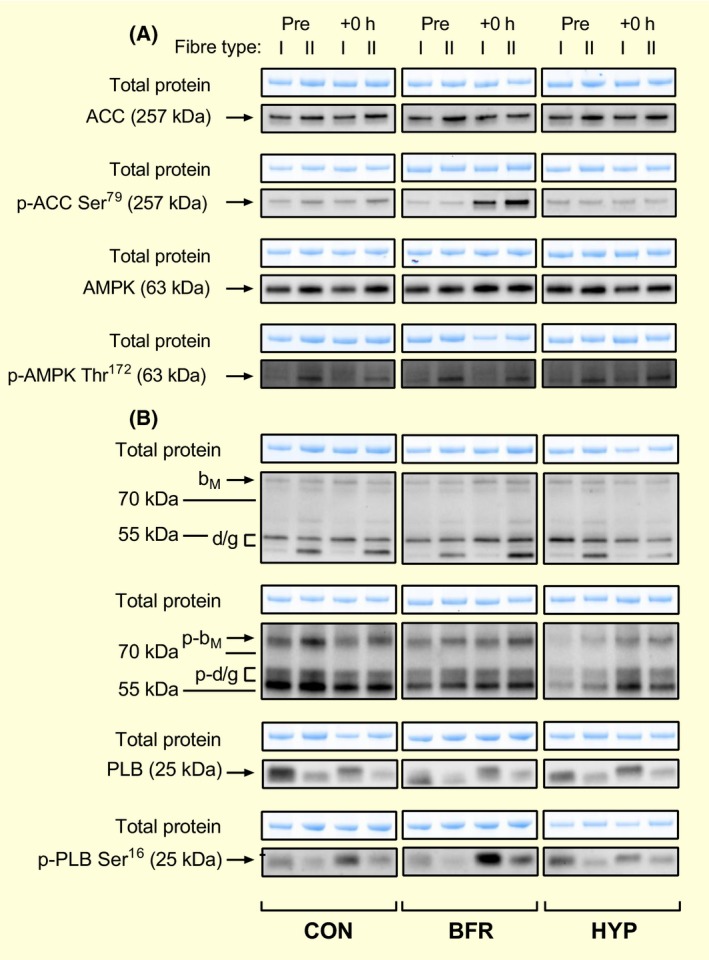
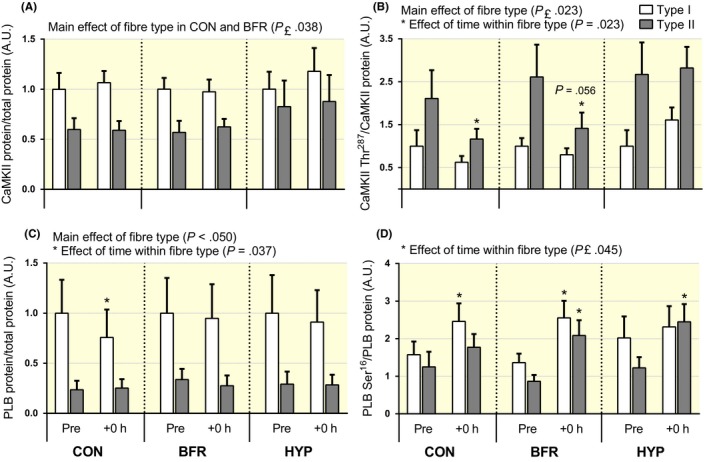
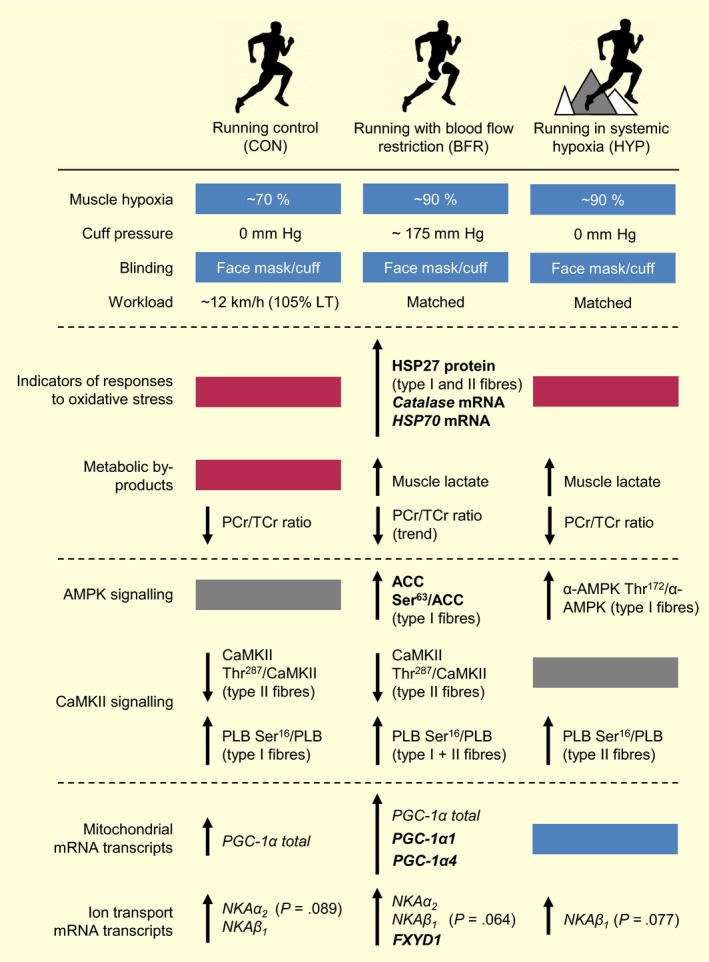
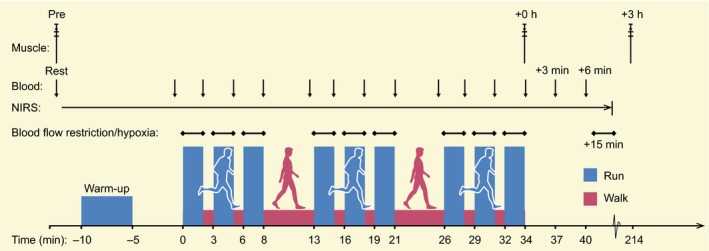
Methods: In a randomized, crossover fashion, 8 healthy men (26 ± 5 year and 57.4 ± 6.3 mL kg-1 min-1 ) completed 3 exercise sessions: without (CON) or with blood flow restriction (BFR), or in systemic hypoxia (HYP, ~3250 m). A muscle sample was collected before (Pre) and after exercise (+0 hour, +3 hours) to quantify mRNA, indicators of oxidative stress (HSP27 protein in type I and II fibres, and catalase and HSP70 mRNA), metabolites, and α-AMPK Thr172 /α-AMPK, ACC Ser221 /ACC, CaMKII Thr287 /CaMKII, and PLBSer16 /PLB ratios in type I and II fibres.
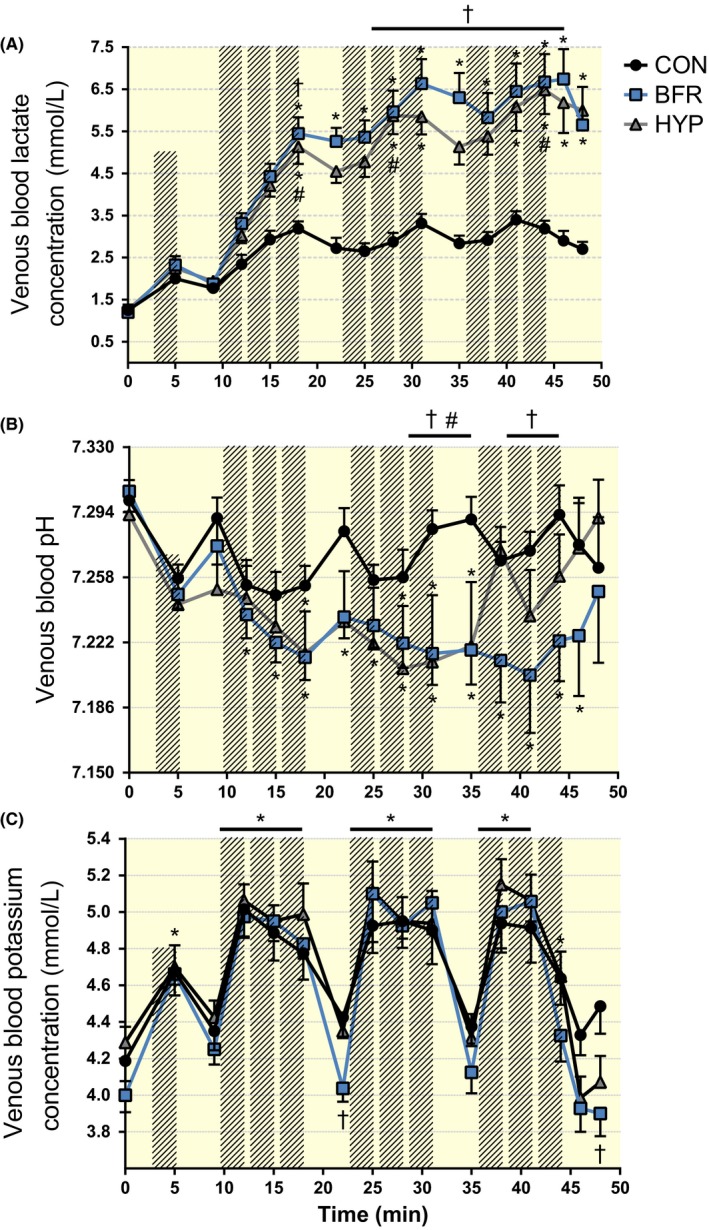
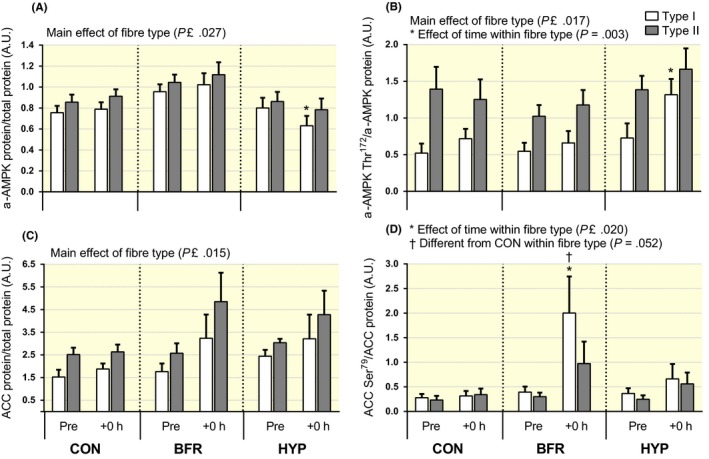
Results: Muscle hypoxia (assessed by near-infrared spectroscopy) was matched between BFR and HYP, which was higher than CON (~90% vs ~70%; P < .05). The mRNA levels of FXYD1 and PGC-1α isoforms (1α1 and 1α4) increased in BFR only (P < .05) and were associated with increases in indicators of oxidative stress and type I fibre ACC Ser221 /ACC ratio, but dissociated from muscle hypoxia, lactate, and CaMKII signalling.
Conclusion: Blood flow restriction augmented exercise-induced increases in muscle FXYD1 and PGC-1α mRNA in men. This effect was related to increased oxidative stress and fibre type-dependent AMPK signalling, but unrelated to the severity of muscle hypoxia, lactate accumulation, and modulation of fibre type-specific CaMKII signalling.
Keywords: AMP-activated protein kinase; Na+-K+-ATPase; PGC-1α; blood flow restriction; oxidative stress; reactive oxygen species.
© 2018 The Authors. Acta Physiologica published by John Wiley & Sons Ltd on behalf of Scandinavian Physiological Society.
Figures
Comment in
-
Blood flow-restricted exercise: Providing more bang for buck in trained athletes?Acta Physiol (Oxf). 2018 Jun;223(2):e13065. doi: 10.1111/apha.13065. Epub 2018 Apr 16. Acta Physiol (Oxf). 2018. PMID: 29575714 No abstract available.
Similar articles
-
A novel gravity-induced blood flow restriction model augments ACC phosphorylation and PGC-1α mRNA in human skeletal muscle following aerobic exercise: a randomized crossover study.Appl Physiol Nutr Metab. 2020 Jun;45(6):641-649. doi: 10.1139/apnm-2019-0641. Epub 2019 Nov 28. Appl Physiol Nutr Metab. 2020. PMID: 31778310 Clinical Trial.
-
Cycling with blood flow restriction improves performance and muscle K+ regulation and alters the effect of anti-oxidant infusion in humans.J Physiol. 2019 May;597(9):2421-2444. doi: 10.1113/JP277657. Epub 2019 Mar 28. J Physiol. 2019. PMID: 30843602 Free PMC article.
-
AMPK and PGC-α following maximal and supramaximal exercise in men and women: a randomized cross-over study.Appl Physiol Nutr Metab. 2024 Apr 1;49(4):526-538. doi: 10.1139/apnm-2023-0256. Epub 2023 Dec 19. Appl Physiol Nutr Metab. 2024. PMID: 38113478 Clinical Trial.
-
Molecular regulation of skeletal muscle mitochondrial biogenesis following blood flow-restricted aerobic exercise: a call to action.Eur J Appl Physiol. 2021 Jul;121(7):1835-1847. doi: 10.1007/s00421-021-04669-6. Epub 2021 Apr 8. Eur J Appl Physiol. 2021. PMID: 33830325 Review.
-
Adaptation of Skeletal Muscles to Contractile Activity of Varying Duration and Intensity: The Role of PGC-1α.Biochemistry (Mosc). 2018 Jun;83(6):613-628. doi: 10.1134/S0006297918060019. Biochemistry (Mosc). 2018. PMID: 30195320 Review.
Cited by
-
[Application and effects of blood flow restriction training].Unfallchirurg. 2020 Mar;123(3):170-175. doi: 10.1007/s00113-020-00774-x. Unfallchirurg. 2020. PMID: 32095904 Review. German.
-
Acute physiological responses of blood flow restriction between high-intensity interval repetitions in trained cyclists.Eur J Sport Sci. 2024 Jun;24(6):777-787. doi: 10.1002/ejsc.12107. Epub 2024 Apr 11. Eur J Sport Sci. 2024. PMID: 38874956 Free PMC article. Clinical Trial.
-
Mitochondrial and cardiovascular responses to aerobic exercise training in supine and upright positions in healthy young adults: a randomized parallel arm trial.Transl Exerc Biomed. 2025 Mar 26;2(1):9-20. doi: 10.1515/teb-2025-0002. eCollection 2025 May. Transl Exerc Biomed. 2025. PMID: 40224168 Free PMC article.
-
Mitochondrial 8-hydroxy-2'-deoxyguanosine and coronary artery disease in patients with type 2 diabetes mellitus.Cardiovasc Diabetol. 2020 Feb 19;19(1):22. doi: 10.1186/s12933-020-00998-6. Cardiovasc Diabetol. 2020. PMID: 32075646 Free PMC article.
-
AMPK and glucose deprivation exert an isoform-specific effect on the expression of Na+,K+-ATPase subunits in cultured myotubes.J Muscle Res Cell Motil. 2024 Sep;45(3):139-154. doi: 10.1007/s10974-024-09673-9. Epub 2024 May 6. J Muscle Res Cell Motil. 2024. PMID: 38709429 Free PMC article.
References
-
- Eiken O, Bjurstedt H. Dynamic exercise in man as influenced by experimental restriction of blood flow in the working muscles. Acta Physiol Scand. 1987;131:339‐345. - PubMed
-
- McKenna MJ. The roles of ionic processes in muscular fatigue during intense exercise. Sports Med. 1992;13:134‐145. - PubMed
-
- Sjogaard G, Adams RP, Saltin B. Water and ion shifts in skeletal muscle of humans with intense dynamic knee extension. Am J Physiol. 1985;248:R190‐R196. - PubMed
-
- Overgaard K, Nielsen OB, Clausen T. Effects of reduced electrochemical Na+ gradient on contractility in skeletal muscle: role of the Na+‐K+ pump. Pflugers Arch. 1997;434:457‐465. - PubMed
-
- McKenna MJ. Effects of training on potassium homeostasis during exercise. J Mol Cell Cardiol. 1995;27:941‐949. - PubMed
Publication types
MeSH terms
Substances
LinkOut - more resources
Full Text Sources
Other Literature Sources
Molecular Biology Databases
Research Materials
Miscellaneous
