Review
. 2018 Feb 28;118(4):1917-1950.
doi: 10.1021/acs.chemrev.7b00534. Epub 2018 Jan 31.

New Technologies for Analysis of Extracellular Vesicles

Affiliations
Review

New Technologies for Analysis of Extracellular Vesicles

Huilin Shao et al. Chem Rev. .

Abstract

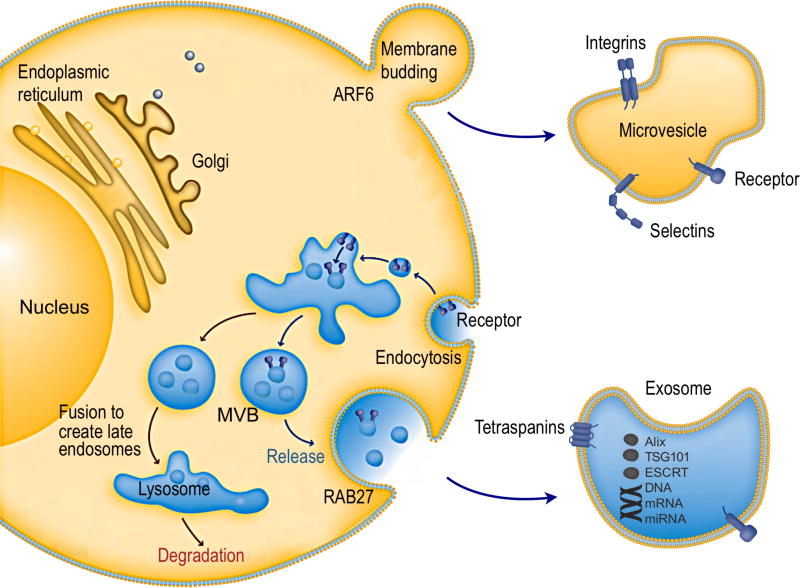
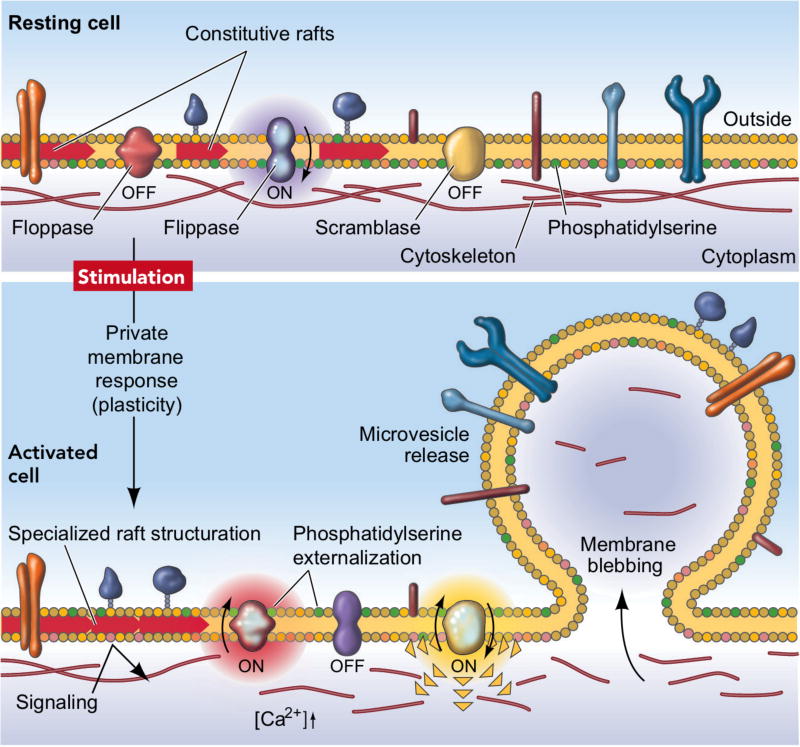
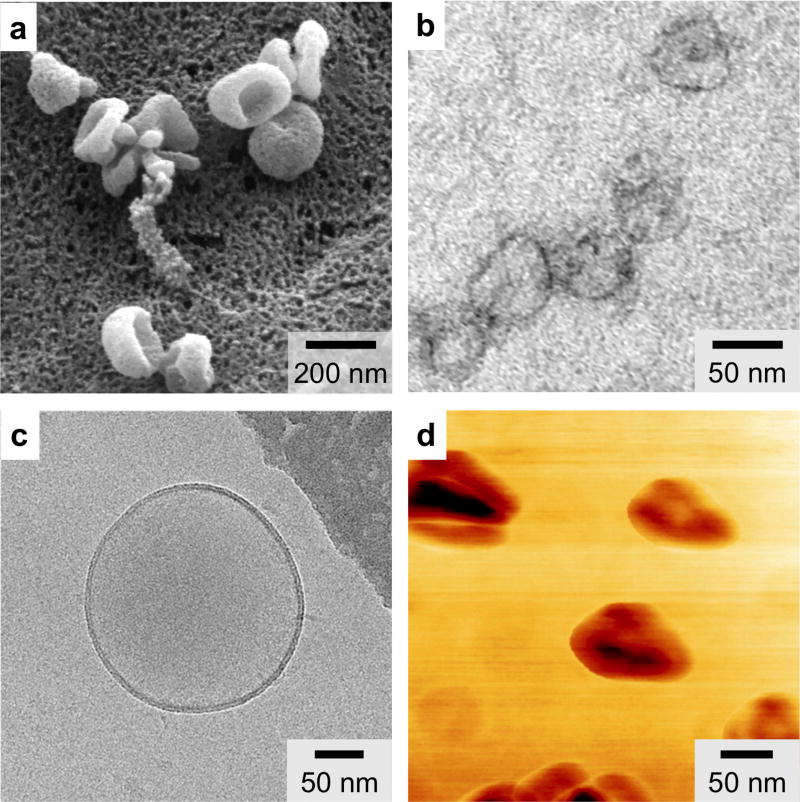
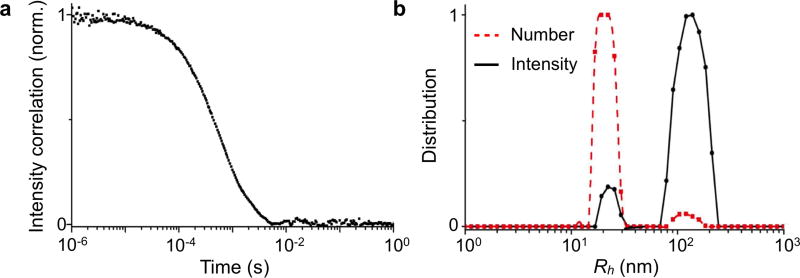
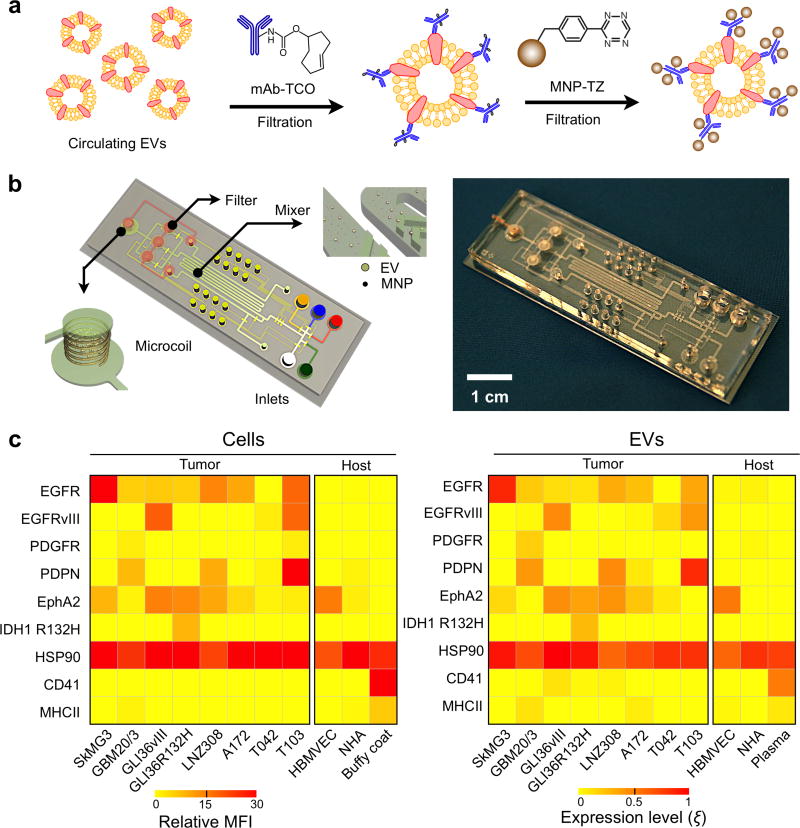
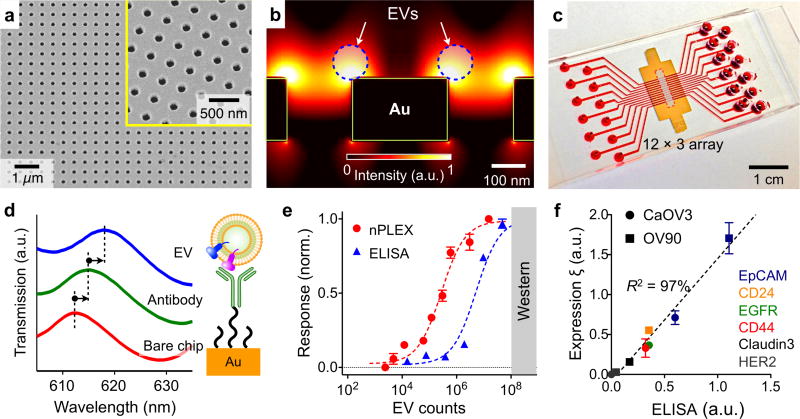
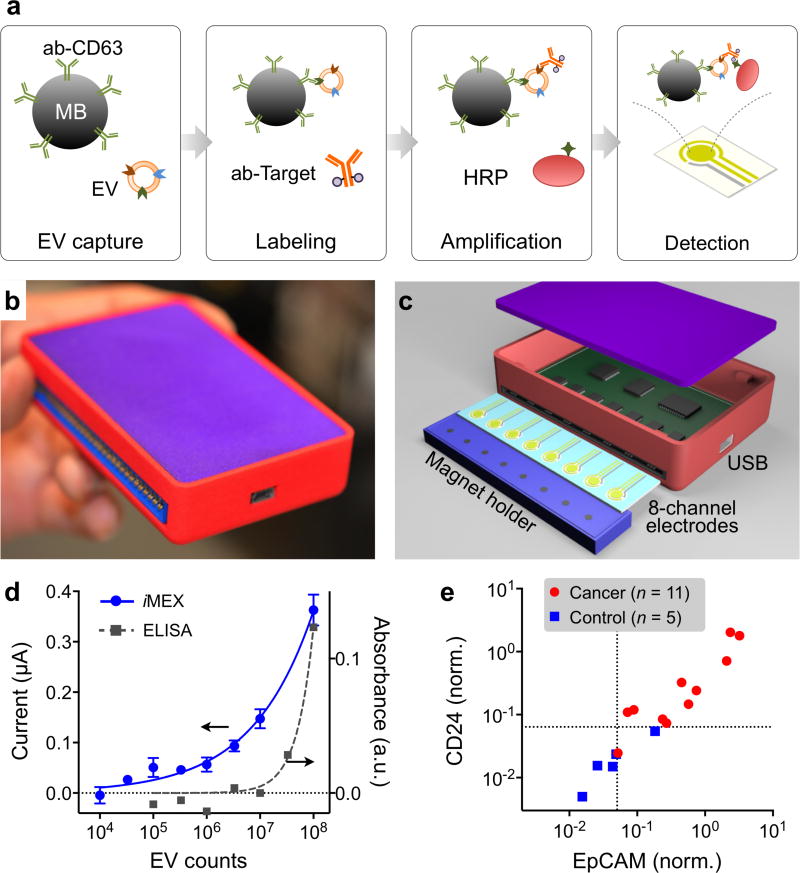
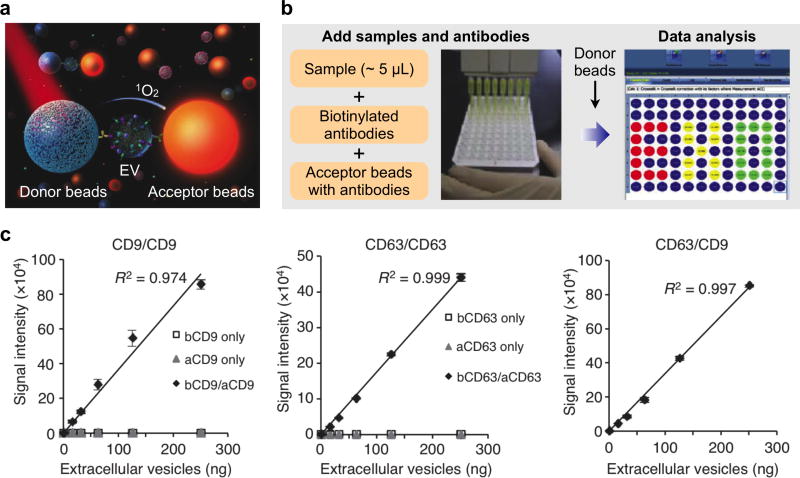
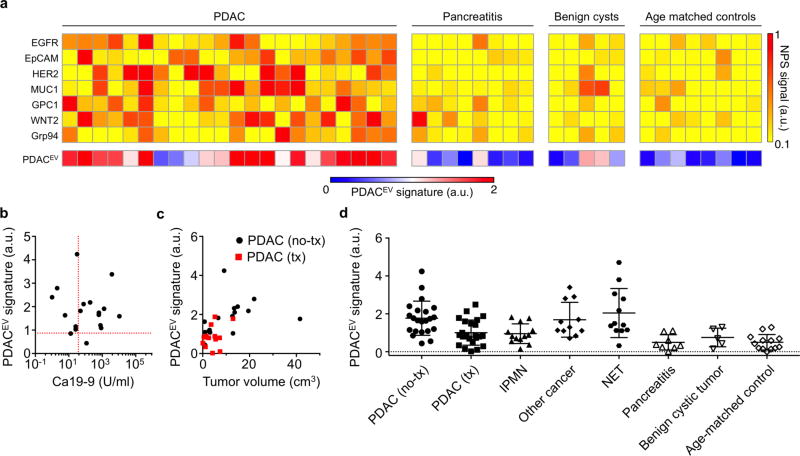
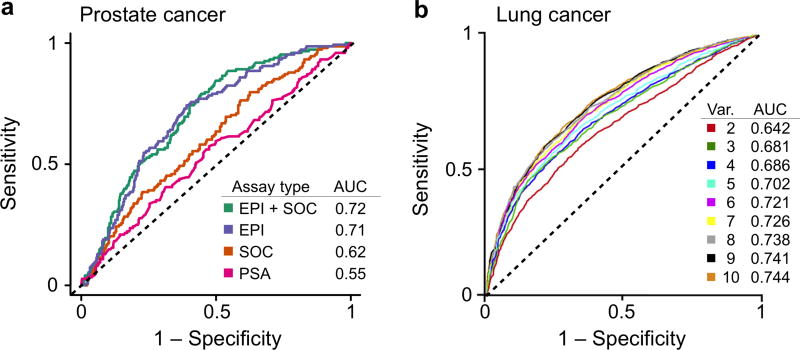
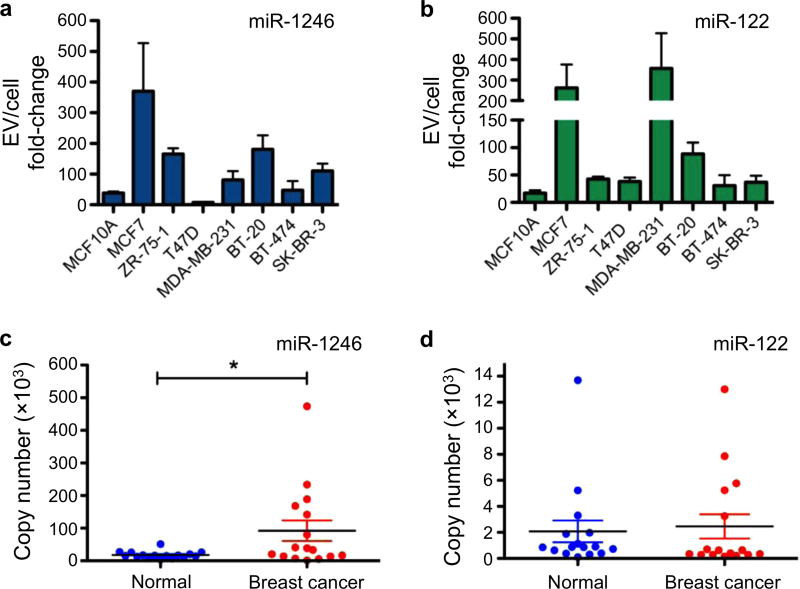
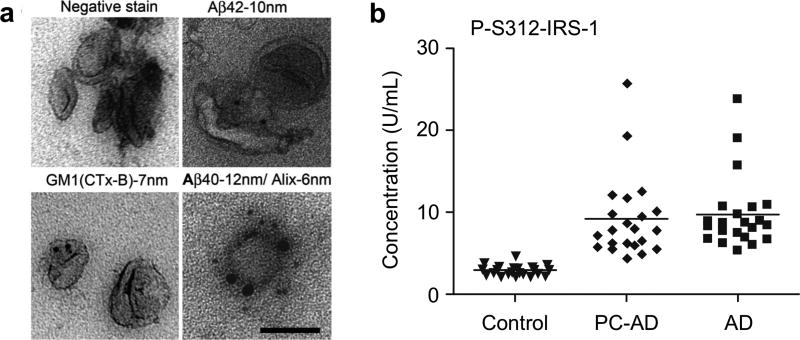
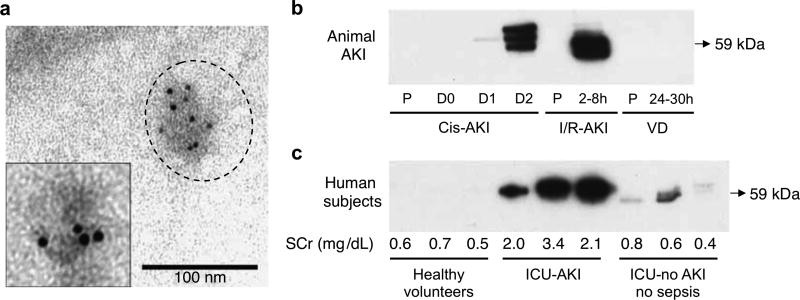
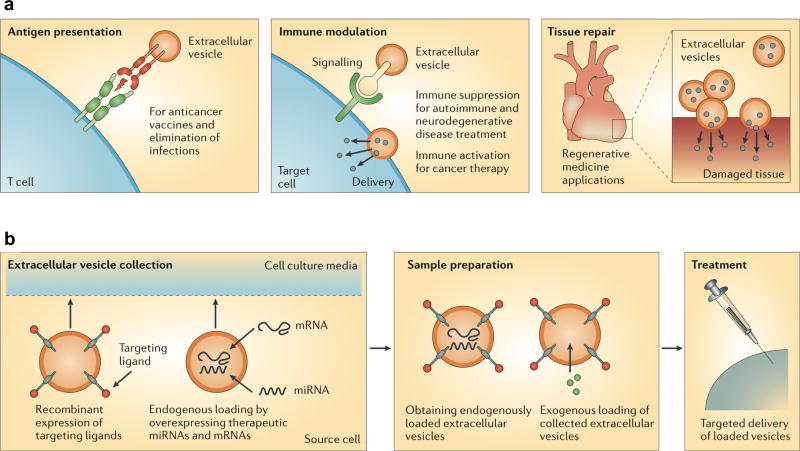
Extracellular vesicles (EVs) are diverse, nanoscale membrane vesicles actively released by cells. Similar-sized vesicles can be further classified (e.g., exosomes, microvesicles) based on their biogenesis, size, and biophysical properties. Although initially thought to be cellular debris, and thus under-appreciated, EVs are now increasingly recognized as important vehicles of intercellular communication and circulating biomarkers for disease diagnoses and prognosis. Despite their clinical potential, the lack of sensitive preparatory and analytical technologies for EVs poses a barrier to clinical translation. New analytical platforms including molecular ones are thus actively being developed to address these challenges. Recent advances in the field are expected to have far-reaching impact in both basic and translational studies. This article aims to present a comprehensive and critical overview of emerging analytical technologies for EV detection and their clinical applications.


Figures

Figure 1
Figure 1. Intracellular pathways of EV biogenesis and secretion
Cellular release of EVs occurs either through outward budding of plasma membrane (microvesicle pathway) or through the inward budding of endosomal membrane (exosome pathway). Exosomes are vesicles of endocytic origin. Following the inward invagination of the plasma membrane to form the early endosome, exosomes are formed as intraluminal vesicles due to further inward budding of the limiting membrane of endosome (now known as multivesicular body; MVB). Finally, exosomes are secreted by fusion of the MVB with the plasma membrane. Several machineries are involved regulating the cargo sorting and exocytosis of exosomes. Reprinted with permission from Ref . Copyright 2011 abcam.
Figure 2
Figure 2. Formation of microvesicles
The plasma membrane bilayer has an asymmetric distribution of phospholipids. The distribution is controlled by three major proteins: an inwarddirected pump, a flippase, specific for phosphatidylserine and phosphatidylethanolamine; an outward-directed pump, a floppase; and a lipid scramblase that promotes bidirectional redistribution of lipids across the bilayer. Following cell stimulation, a redistribution of lipids occurs, leading to microvesicle formation and its release. Reprinted with permission from Ref . Copyright 2005 Int. Union Physiol. Sci./Am. Physiol. Soc.
Figure 3
Figure 3. Various micrographs of EVs
(a) Scanning electron microscopy (SEM) provides three dimensional surface topology information. (b) Transmission electron microscopy (TEM) has superior image resolution and can be used with immunogold labeling to provide molecular characterization. (c) Cryo-electron microscopy (cryo-EM) enables analysis of EV morphology without extensive processing. (d) Atomic force microscopy (AFM) can provide information on both surface topology and local material properties (e.g., stiffness, adhesion). Reprinted with permission from Ref . Copyright 2012 Nature Publishing Group. Reprinted with permission from Ref . Copyright 2013 Yuana et al. Reprinted with permission from Ref . Copyright 2010 American Chemical Society.
Figure 4
Figure 4. Dynamic light scattering
(a) Dynamic light scattering (DLS) measures bulk scattered light from EVs as the vesicles undergo continuous Brownian motion. The dynamic information of the vesicles is derived from an autocorrelation of the scattered intensity and could be used to determine vesicle size. (b) As the original size distribution measured by DLS is intensity-weighted, the data is dominated by large vesicles, even if these exist in small quantities, as the intensity is proportional to Rh6, where Rh is the effective vesicle size. Reprinted with permission from Ref . Copyright 2015 American Chemical Society.
Figure 5
Figure 5. Nanoparticle tracking analysis
(a) Nanoparticle tracking analysis (NTA) tracks individual vesicle scattering over time, as they diffuse and scatter under light illumination. (b) This information is then used to mathematically determine vesicle concentration and size distribution. Reprinted with permission from Ref . Copyright 2012 Nature Publishing Group.
Figure 6
Figure 6. Tunable resistive pulse sensing (TRPS)
(a) Two fluidic reservoirs, each connected to an electrode, are separated by a membrane with a pore. The ionic current between reservoirs is then measured. When a vesicle passes through the pore, it blocks the current flow, leading to a transient current decrease. (b) Exosomes and microvesicles derived from patient cerebrospinal fluids were compared. For EVs < 150 nm in diameter, NTA consistently detected more EVs than TRPS. The reverse was true for bigger EVs (>150 nm). Reprinted with permission from Ref . Copyright 2016 Akers et al.
Figure 7
Figure 7. Single EV analysis (SEA)
(a) EVs are biotinylated and captured on a flat surface coated with neutravidin (Av). EVs are then stained with fluorescent antibodies and imaged. Subsequently, fluorophores are quenched and the staining process is repeated for a different set of markers. (b) Example SEA image. EVs from Gli36-WT cell line were biotinylated and captured. Individual EV were detected through staining with fluorescent streptavidin StAv (top left). For molecular profiling, EVs were stained for pan-EV markers (tetraspanins; CD9, CD63, CD81) as well as tumor markers (EGFR, EGFRvIII, IDH1, IDH1R132). Spots with circles indicate individual EVs. (c) 2-dimensional tSNE mapping of individual EVs analyzed for protein markers. The original map was redrawn for EVs from a single cell line. Data from other cell lines are shaded light gray. EVs from Gli36-WT and Gli36-IDH1R132 cells lines clustered similarly, whereas EVs from Gli36-EGFRvIII cells showed distinct clusters. Reprinted with permission from Ref . Copyright 2017 American Chemical Society.
Figure 8
Figure 8. Microfluidic filtering methods for EV isolation and sorting
(a) A microfluidic device that uses membrane filters to isolate EVs from unprocessed blood sample. The device consists of size-selective filters (< 1 µm) and capillary guide, and is assembled by a magnetic sandwich. (b) Filtered blood sample revealed a single EV population with an average size of 167 nm. (c) A nanoscale lateral displacement array that sorts differentially-sized vesicles through displacement trajectories. (d) The device was fabricated with advanced silicon processes to produce an pillar array with uniform gap size of 25 nm. (e) Due to the differential vesicle trajectories, larger vesicles would be displaced to the right channel (fully bumped) while small vesicles followed a zigzag path. (f) When sorted in the device, fluorescent-labelled human urine-derived EVs confirmed the differential displacement trajectories. Reprinted with permission from Ref . Copyright 2013 American Chemical Society. Reprinted with permission from Ref . Copyright 2016 Nature Publishing Group.
Figure 9
Figure 9. Contact-free sorting of EVs
(a) Schematic of the acoustic wave sorter. The device consists of a pair of interdigitated transducers to generate standing ultrasound wave to exert differential forces on vesicles of different sizes. (b) During operation, vesicles in an acoustic region experience radiation pressure that is proportional to the vesicle size and move towards the pressure node. Larger vesicles move faster than smaller vesicle, thereby forming differential separation trajectories. (c) By in situ tuning of cut-off size, vesicles could be separated with versatile size selection and a good separation yield. Reprinted with permission from Ref . Copyright 2015 American Chemical Society.
Figure 10
Figure 10. Immunoaffinity enrichment
(a) Schematics of a microfluidic chip that enables continuous mixing and isolation of EVs using immunomagnetic beads. EVs are enriched by immunomagnetic selection and retained as tight aggregates by magnetic force. The retained clusters could be subsequently probed with secondary markers for optical detection. Microscopy images of the device: (b) Y-shaped injector, (c) serpentine fluidic mixer for immunomagnetic binding, (d) magnetic aggregates and (e) bound EVs on immunomagnetic beads. Reprinted with permission from Ref . Copyright 2016 The Royal Society of Chemistry.
Figure 11
Figure 11. Conventional EV protein analysis
(a) Western blotting. EV protein lysate is separated by sodium dodecyl sulfate polyacrylamide gel electrophoresis (SDS-PAGE), before being transferred over to a membrane for immunoblotting of specific EV protein targets (e.g., HSP70, Flotillin-1, CD61). (b) Enzyme-linked immunosorbent assay (ELISA). In the specific “sandwich” configuration, vesicles or lysates could be applied to a solid support that has been pre-treated with an immobilized capturing antibody. Captured vesicle targets are then exposed to an detecting target antibody. Reprinted with permission from Ref . Copyright 2015 Lobb et al. Reprinted with permission from Ref . Copyright 2014 Nature Publishing Group.
Figure 12
Figure 12. Small particle flow cytometry
(a) To discriminate vesicles as small as 100 nm in diameter, a highly sensitive flow cytometry instrument, termed vesicle flow cytometry, was developed. (b) Fluorescent intensity from liposomes, labeled with di-8-ANEPPS, were calibrated for the vesicle diameter. The surface area of liposomes were estimated from NTA analysis. The linear regression provided coefficients for calibration of vesicle size. (c) EVs were isolated from platelet-rich plasma samples, and labeled with di-8-ANEPPS (vesicle size measurements) and fluorescent (DyLight488) antibodies against CD61 (platelet-specific). Vesicle flow cytometer detected EVs in plasma, and resolved EV sub-populations expressing cell surface markers. Reprinted with permission from Ref . Copyright 2015 International Society for Advancement of Cytometry.
Figure 13
Figure 13. Micro-nuclear magnetic resonance
(a) Assay schematics to maximize magnetic nanoparticle (NMP) binding onto EVs. A two-step bio-orthogonal click chemistry was used to label EVs with MNPs. (b) The microfluidic system for on-chip detection of circulating EVs is designed to detect MNP-targeted vesicles, concentrate MNP-tagged vesicles (while removing unbound MNPs) and provide in-line NMR detection. (c) GBM markers (EGFR, EGFRvIII, PDGFR, PDPN, EphA2 and IDH1 R132H), a positive EV control marker (HSP90), as well as host cell markers (CD41, MHCII) were profiled in both parental cells (left) and their corresponding EVs (right). Using a four-GBM marker combination (EGFR, EGFRvIII, PDPN and IDH1 R132H), GBM derived EVs could be distinguished from host cell–derived EVs. MFI, mean fluorescence intensity; HBMVEC, human brain microvascular endothelial cell; NHA, normal human astrocyte; buffy coat and plasma were isolated from whole blood donated by healthy volunteers. Reprinted with permission from Ref . Copyright 2012 Nature Publishing Group.
Figure 14
Figure 14. Surface plasmon resonance
(a) The nPLEX sensing is based on transmission SPR through periodic nanohole arrays. The hole diameter is 200 nm with a periodicity of 450 nm. The structure was patterned in a gold film (200-nm thick) deposited on a glass substrate. (b) Finite-difference time-domain simulation shows the enhanced electromagnetic fields tightly confined near a periodic nanohole surface. The field distribution overlaps with the size of EVs captured onto the sensing surface, maximizing the detection sensitivity. (c) The sensing array can be integrated with multichannel microfluidics for independent and parallel analyses. (d) Assay schematic of changes in transmission spectra showing EV detection. The gold surface is pre-functionalized by a layer of polyethylene glycol (PEG), and antibody conjugation and specific EV binding were monitored by transmission spectral shifts as measured by sensor. (e) In comparison to gold standard methods, the nPLEX assay demonstrated excellent sensitivity, being 104 and 102 more sensitive than Western blotting and chemiluminescence ELISA, respectively. (f) Correlation between nPLEX and ELISA measurements. The marker protein expression level was determined by normalizing the marker signal with that of anti-CD63, which accounted for variation in exosomal counts across samples. a.u., arbitrary unit. Reprinted with permission from Ref . Copyright 2014 Nature Publishing Group.
Figure 15
Figure 15. Electrochemical detection
(a) Assay schematics of the iMEX platform. EVs are captured on magnetic beads directly in plasma and labeled with HRP enzyme for electrochemical detection. The magnetic beads are coated with antibodies against CD63, an enriched surface marker in exosomes. (b) A photograph of the developed iMEX platform. (c) Sensor schematic. The sensor can simultaneously measure signals from eight electrodes. Small cylindrical magnets are located below the electrodes to concentrate immunomagnetically captured EVs. (d) Varying number of EVs were spiked into human plasma and assayed by iMEX and ELISA. The detection limits were 3 × 10⁴ (iMEX) and 3 × 10⁷ (ELISA). (e) Plasma samples from ovarian cancer patients (n = 11) and healthy controls (n = 5) were analyzed with the iMEX assay. EpCAM and CD24 levels were much higher in cancer patients. The EpCAM and CD24 expression levels (ξEpCAM vs ξCD24) were highly correlated (R2 = 0.870). Reprinted with permission from Ref . Copyright 2016 American Chemical Society.
Figure 16
Figure 16. ExoScreen technology
(a) Assay principle of ExoScreen. This proximity assay requires two types of immunobeads: 1) donor beads, which are excited at 680 nm to release singlet oxygen, and 2) acceptor beads, which can be only excited by the released singlet oxygen when they are situated within 200 nm away from the donor beads. (b) Assay workflow. Biological samples are first treated with biotinylated antibodies and acceptor beads conjugated with a second antibody. Streptavidin-coated donor beads were then added to complete the proximity assay for data acquisition. (c) Correlation between ExoScreen measurements for CD9 positive EVs, CD63 positive EVs or CD63/CD9 double-positive EVs and EV protein concentration in a dilution series. The addition of biotinylated antibodies and acceptor beads conjugated antibodies is denoted ‘bCD9/aCD9’ or ‘bCD63/aCD63’. Right panel shows the addition of biotinylated CD63 antibodies and acceptor beads conjugated CD9 antibodies. Reprinted with permission from Ref . Copyright 2014 Nature Publishing Group.
Figure 17
Figure 17. Workflow of RNA extraction using spin column
EV RNA is isolated from whole blood by separating the plasma or serum, pre-filtering the sample to exclude cell-contamination, and loading on the membrane affinity column followed by a brief wash. The bound vesicles are lysed and eluted with QIAzol; the RNA extracted by addition of chloroform, precipitated by ethanol and further purified using an RNeasy column. Reprinted with permission from Ref . Copyright 2015 Enderle et al.
Figure 18
Figure 18. Amplification and sequencing of EV nucleic acids
(a) Amplification and detection of c-Myc, a tumor oncogene, on epidermoid carcinoma (ECT) and medulloblastoma (MBT) xenografted tumors with qPCR. Values were normalized to GAPDH, a housekeeping control. (b) EV RNA were isolated from corresponding serum samples. c-Myc PCR product was amplified using human specific primers. Amplified DNA was resolved by electrophoresis in a 2% agarose gel and visualized with ethidium bromide staining. c-Myc is shown as an 89 bp fragment (arrow). MW, molecular weight; NTC, no template control. (c) Pie chart of RNA species and their distributions in the plasma-derived exosomes. Misc RNAs are the RNA sequences that mapped to the human genome but not in any of the categories listed. The DNA category represents the novel transcripts that have no annotation in the human RNA database. Reprinted with permission from Ref . Copyright 2011 Nature Publishing Group. Reprinted with permission from Ref . Copyright 2013 BioMed Central Ltd.
Figure 19
Figure 19. Application of droplet digital PCR for EV analyses
The workflow consists of three steps: (a) Making PCR droplets. Aqueous PCR reaction mixture is injected through a microfluidic droplet generator along with surfactant-containing fluorocarbon oil to produce five picoliter droplets. (b) PCR amplification. The droplets are loaded into a standard thermal cycler for endpoint PCR amplification, with single-target-molecule-containing droplets resulting in specific probe hydrolysis (PCR+) and bright fluorescence and the majority of droplets, containing no target molecule, resulting in only background probe fluorescence (PCR). (c) Each droplet's fluorescence is detected and processed into a two-dimensional scatter plot display. Reprinted with permission from Ref . Copyright 2013 American Society of Gene & Cell Therapy.
Figure 20
Figure 20. Microfluidics for on-chip EV RNA extraction and detection
(a) Assay schematics of the immuno-magnetic exosome RNA (iMER) analysis. Cancer exosomes in serum are first captured onto magnetic microbeads containing affinity ligands (for example, anti-CD63 and anti-EGFR). The immuno-enriched exosomal population is then lysed and the lysate flows through a glass bead filter, where RNA efficiently adsorbs onto packed glass beads. Finally, the collected RNA is eluted and reverse-transcribed for real-time amplification and quantitation. (b) Scanning electron micrographs of magnetic microbeads after immunoaffinity capture. Microbeads (left, 3 mm) functionalized with antibodies against EGFRvIII, a cancer-specific deletion mutant, captured innumerable tumor vesicles from GLI36vIII conditioned medium. (c) Photograph of the microfluidic iMER prototype. (d) Exosomal MGMT and APNG mRNA levels correlate with in vitro TMZ sensitivity (ED50). Cell lines were treated with varying doses of TMZ to determine their respective drug sensitivities (top panel). iMER analysis revealed that the levels of MGMT, APNG or both were elevated in resistant cell lines, whereas they were both low in sensitive ones (bottom panel). (e) Higher average levels of exosomal MGMT/APNG were observed in resistant cell lines than in sensitive ones. However, there was overlap in exosomal mRNA levels between resistant and sensitive cell lines, demonstrating that a single marker was unable to distinguish drug resistance. Dotted line indicates the mean. Reprinted with permission from Ref . Copyright 2015 Nature Publishing Group.
Figure 21
Figure 21. Ion-exchange nanodetector
(a) Schematic of surface acoustic wave (SAW) device and SAW-induced lysing of exosomes to release RNA for detection. SAWs generated at the transducer refract into the liquid bulk, inducing fluid motion, and electromechanical coupling also generates a complimentary electric wave at the surface of the substrate. (b) Schematic of ion-exchange nano-membrane sensor consisting of two reservoirs separated by the membrane. RNA in the sensing reservoir hybridize to complimentary oligos immobilized on the surface of the membrane. The inset shows the ion transport through the device to generate current. (c) Representative current voltage characteristic (CVC) for nano-membrane sensor. The black, red, and blue curves indicate a CVC taken with the bare membrane, a CVC taken with the probe attached to the membrane, and a CVC taken with the probes on the membrane surface fully saturated with target RNA, respectively. (d) Target RNA concentration as detected by the nano-membrane sensor and determined using the universal calibration curve before and after SAW lysis for two different nano-membrane devices. Reprinted with permission from Ref . Copyright 2015 The Royal Society of Chemistry.
Figure 22
Figure 22. Localized surface plasmonic resonance for detecting EV RNA
(a) Scanning electron microscopy (SEM) image of gold nanoprisms for LSPR-based sensors fabrication. (b) Assay schematic of the LSPR assay. The immobilized nanoprisms are functionalized with capturing DNA probes and polyethylene glycol spacers. Upon hybridization of the miRNA target (miR-10b) with the capturing DNA probes, the LSPR resonant peak shifts. (c) miR-10b detection in clinical samples from pancreatic ductal adenocarcinoma (PDAC; left) or chronic pancreatitis (CP; right) patients. Determination of the miRNA levels was performed in plasma, exosomes and supernatants, respectively. Reprinted with permission from Ref . Copyright 2015 American Chemical Society.
Figure 23
Figure 23. Glioblastoma multiforme detection
(a) Levels of mature miRNAs in EVs and glioblastoma cells from patient (GBM1) were analyzed using quantitative miRNA RT–PCR. (b) Total protein from primary glioblastoma cells and EVs from them was analyzed on a human angiogenesis antibody array. (c) Longitudinal EV MGMT and APNG mRNA analyses were performed in seven GBM patients. Clinical assessments (NR, S, R) were based on radiological findings, clinical examination and lab values. (d) Sequential EV mRNA changes between two time points were analyzed in GBM patients (n = 7) undergoing temozolomide treatment. All changes were normalized to their initial values and plotted according to clinical evaluation at the end of the assessment period (the later time point). All changes were independent of initial tissue MGMT methylation status. Reprinted with permission from Ref . Copyright 2008 Nature Publishing Group. Reprinted with permission from Ref . Copyright 2015 Nature Publishing Group.
Figure 24
Figure 24. Ovarian cancer detection
(a) Putative ovarian cancer markers (EpCAM, CD24, CA19-9, CLDN3, CA-125, MUC18, EGFR, HER2), immune host cell markers (CD41, CD45) and a mesothelial marker (D2-40) were profiled on EVs (left) and their parental ovarian cell lines (right). MFI, mean fluorescence intensity. a.u., arbitrary unit. (b) Exosomal protein levels of EpCAM and CD24 in ascites samples from patients were measured by nPLEX. Ovarian cancer patient samples (n = 20) were associated with elevated EpCAM and CD24 levels, whereas non-cancer patients (n = 10) showed negligible signals. (c) Longitudinal monitoring of treatment responses. Ascites samples were collected from ovarian cancer patients before and after chemotherapy (n = 8) and profiled with nPLEX. The bars represent the changes in CD24 and EpCAM levels per exosome after treatment. Reprinted with permission from Ref . Copyright 2014 Nature Publishing Group.
Figure 25
Figure 25. Pancreatic cancer detection
(a) Heatmap analysis of EV markers for pancreatic cancer detection. The PDACEV signature is defined as a combined marker panel of EGFR, EPCAM, MUC1, GPC1, and WNT2. (b, c) Correlation of the PDACEV signature values with a serum biomarker CA 19-9 (b) and the tumor diameter (c) for patients with PDAC. tx, treatment. The dashed red line in (b) indicates the threshold values for positivity (CA 19-9, 37 U/ml; PDACEV signature, 0.87). (d) EV analyses for patients with different types of pancreatic diseases. The PDACEV signature values were measured for patient cohorts (n = 103) including (i) PDAC without treatment (n = 22), (ii) PDAC treated with neoadjuvant regimen (n = 24), (iii) IPMN (n = 13), (iv) other GI cancers mimicking the symptoms of pancreaticoduodenal cancers (n = 11), (v) pancreatic NET (n = 12), (vi) pancreatitis (n = 8), (vii) benign cystic tumors (n = 5), and (viii) age-matched controls (n = 18). Reprinted with permission from Ref . Copyright 2017 American Association for the Advancement of Science AAAS.
Figure 26
Figure 26. Prostate cancer and lung cancer detection
(a) A urine-based EV gene expression assay, ExoDx™ Prostate IntelliScore (EPI), was used to evaluate high-grade prostate cancer at initial biopsy (n = 512). Area under receiver operating characteristic curve (AUC) analysis indicated the EPI test in combination with standard of care (SOC) significantly outperforms SOC along for predicating high-grade disease. (b) A protein marker panel was developed to diagnose lung cancers. AUC generated for the number of markers is given with the 95% confidence interval for the entire lung cancer cohort. Reprinted with permission from Ref . Copyright 2017 Exosome Diagnostics, Inc. Reprinted with permission from Ref . Copyright 2016 International Association for the Study of Lung Cancer.
Figure 27
Figure 27. Breast cancer detection
(a, b) qPCR analysis of miRNA in exosomes derived from mammary epithelial cells (MCF10A) and breast cancer cell lines (MCF7, ZR-75-1, T47D, MDA-MB-231, BT-20, BT-474, SK-BR-3). Fold change in expression is shown for the exosome miRNA relative to their cellular miRNA levels and normalized against spike-in miRNA control. (c, d) qPCR analysis of exosome miRNA expression in normal plasma and plasma from breast cancer patients (n =16). Exosomes were isolated from the plasma samples using commercial reagents and total RNA was extracted for qPCR analysis. Reprinted with permission from Ref . Copyright 2016 Hannafon et al.
Figure 28
Figure 28. Detection of neurodegenerative diseases
(a) EVs obtained from Alzheimer’s disease (AD) model cell line (N2A) were negatively stained with 1% uranyl acetate and immunolabeled with antibodies for the exosomal marker Alix. Exosomes also were immunolabeled for Aβ40 or Aβ42 and cholera toxin B subunit (CTx-B), which binds to the ganglioside GM1. (b) Longitudinal analysis of the development of altered levels of phosphorylated IRS-1 in AD. PC-AD, preclinical values 1 to 10 yr before diagnosis for patients with AD; control, values for cognitively normal healthy subjects matched by age and gender with each patient with AD at the time of diagnosis. Reprinted with permission from Ref . Copyright 2006 The National Academy of Sciences of the USA. Reprinted with permission from Ref . Copyright 2015 FASEB.
Figure 29
Figure 29. Detection of acute kidney injury
(a) Fetuin-A, a novel kidney injury marker, could be found inside rat urinary vesicles after cisplatin-induced acute kidney injury (AKI). Inset shows a magnified image of a urinary vesicle labeled with gold-conjugated anti-Fetuin-A. (b) Temporal secretion of urinary exosomal Fetuin-A in different AKI animal models. Western blotting analysis of urinary vesicles obtained from three rat models: one rat pre-, day 0, day 1, and day 2 after cisplatin injection; one rat from pre- and 8 h after bilateral ischemia and reperfusion (I/R); one rat from pre- and 24–30 h after volume depletion (VD). (c) Level of Fetuin-A in urinary vesicles of intensive care unit (ICU) patients with and without AKI, as compared to healthy volunteers. Reprinted with permission from Ref . Copyright 2006 International Society of Nephrology.
Figure 30
Figure 30. Therapeutic applications of EVs
(a) EVs could be used as therapeutic agents in antigen presentation, immune modulation, and tissue repair, through the transfer of EV proteins and nucleic acids. (b) As EVs naturally contain regulatory RNAs, they can be utilized for delivering oligonucleotide drugs of choice. EVs can be engineered to have targeting ligands present on their surface. Drug loading can be carried out either endogenously or exogenously, before being purified and applied for treatment. Reprinted with permission from Ref . Copyright 2013 Nature Publishing Group.

References

    1. Théry C, Zitvogel L, Amigorena S. Exosomes: Composition, Biogenesis and Function. Nat. Rev. Immunol. 2002;2:569–79. - PubMed
    1. Théry C, Ostrowski M, Segura E. Membrane Vesicles as Conveyors of Immune Responses. Nat. Rev. Immunol. 2009;9:581–93. - PubMed
    1. Raposo G, Stoorvogel W. Extracellular Vesicles: Exosomes, Microvesicles, and Friends. J. Cell Biol. 2013;200:373–83. - PMC - PubMed
    1. Colombo M, Raposo G, Théry C. Biogenesis, Secretion, and Intercellular Interactions of Exosomes and Other Extracellular Vesicles. Annu. Rev. Cell Dev. Biol. 2014;30:255–89. - PubMed
    1. Johnstone RM, Adam M, Hammond JR, Orr L, Turbide C. Vesicle Formation During Reticulocyte Maturation. Association of Plasma Membrane Activities With Released Vesicles (Exosomes) J. Biol. Chem. 1987;262:9412–20. - PubMed

Publication types