. 2018 Jan 31:7:e30839.
doi: 10.7554/eLife.30839.

Activity-induced Ca2+ signaling in perisynaptic Schwann cells of the early postnatal mouse is mediated by P2Y1 receptors and regulates muscle fatigue

Affiliations

Activity-induced Ca2+ signaling in perisynaptic Schwann cells of the early postnatal mouse is mediated by P2Y1 receptors and regulates muscle fatigue

Dante J Heredia et al. Elife. .

Abstract

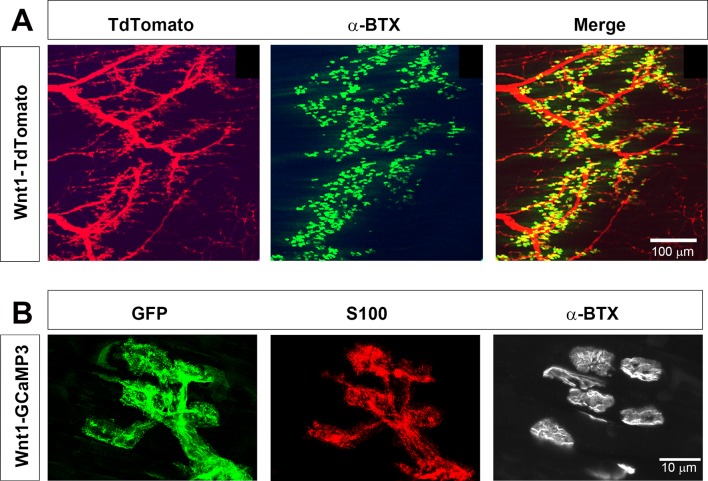
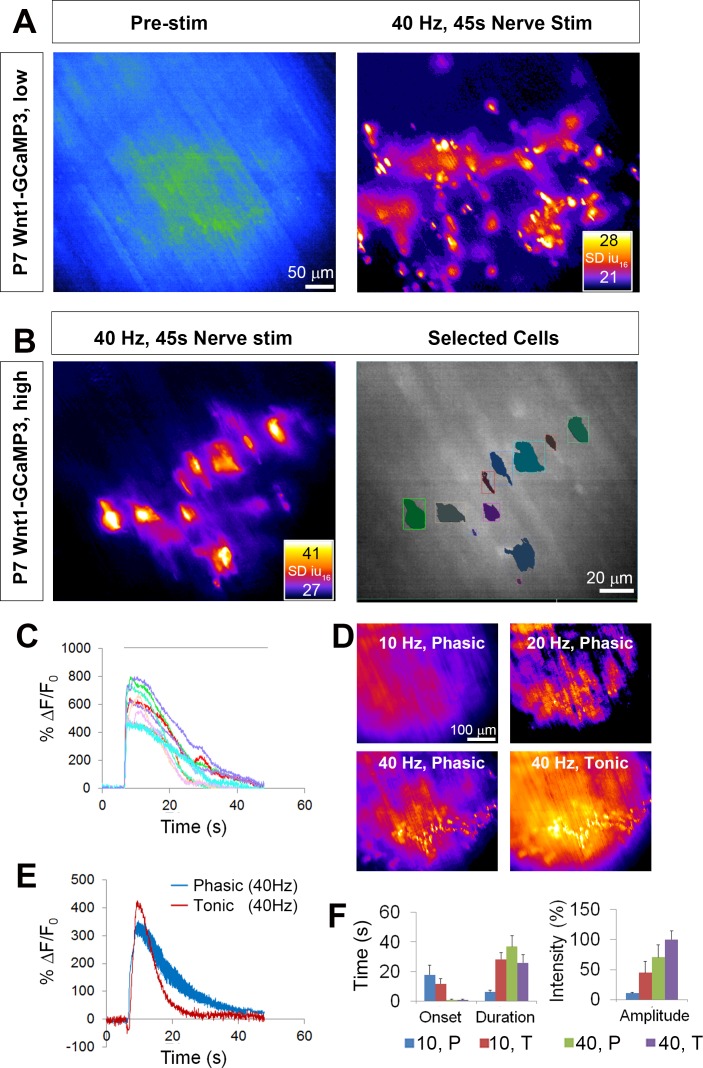
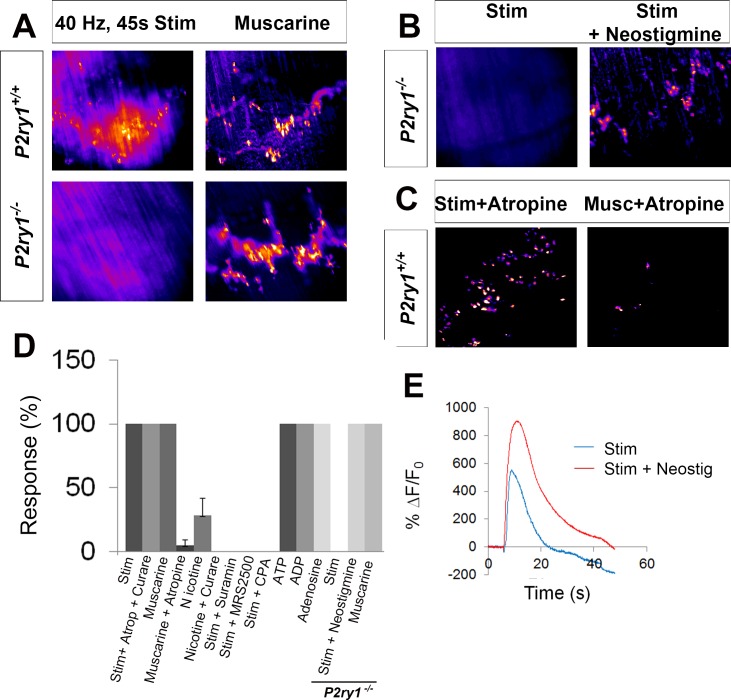
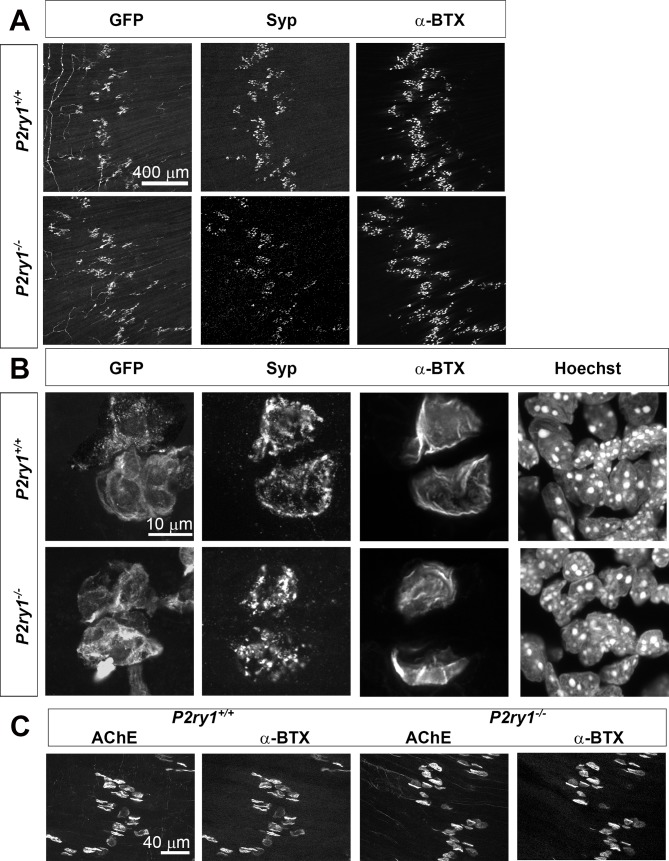
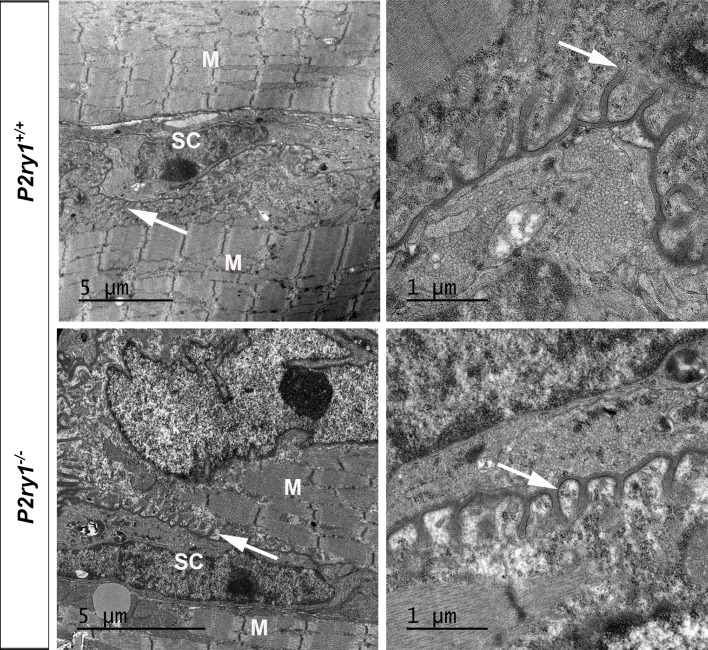
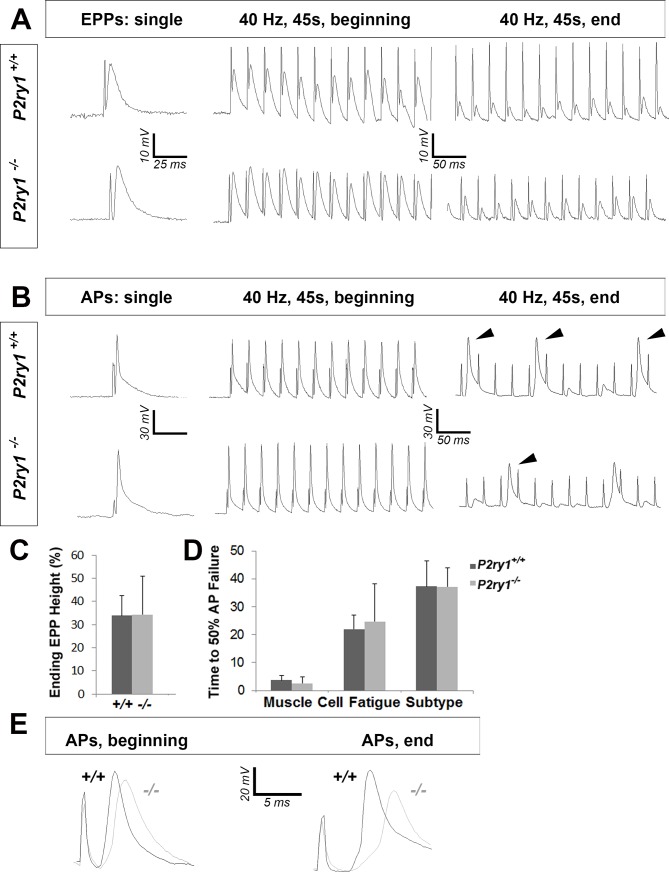
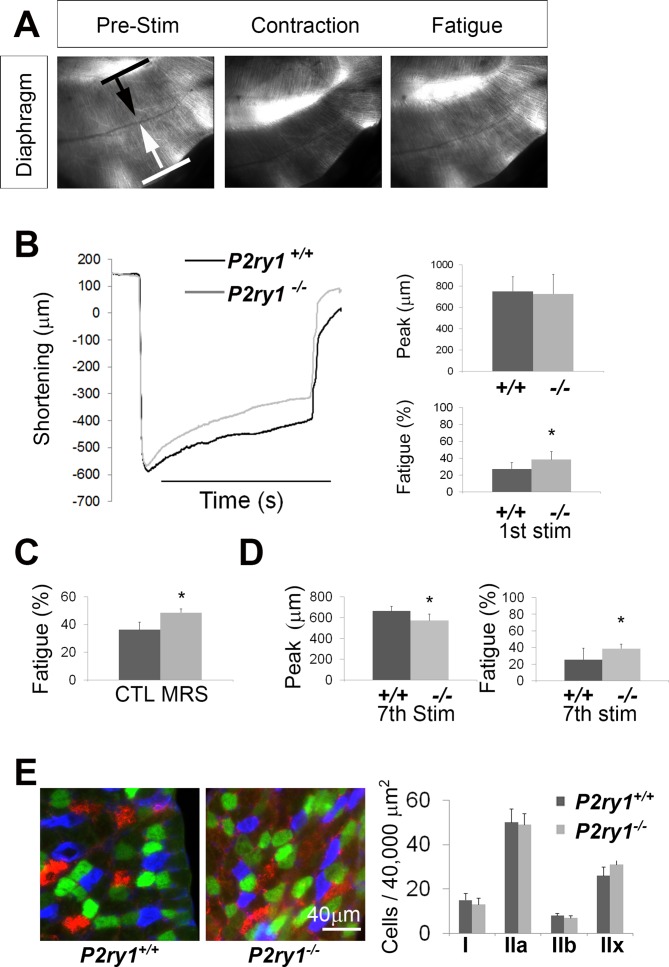
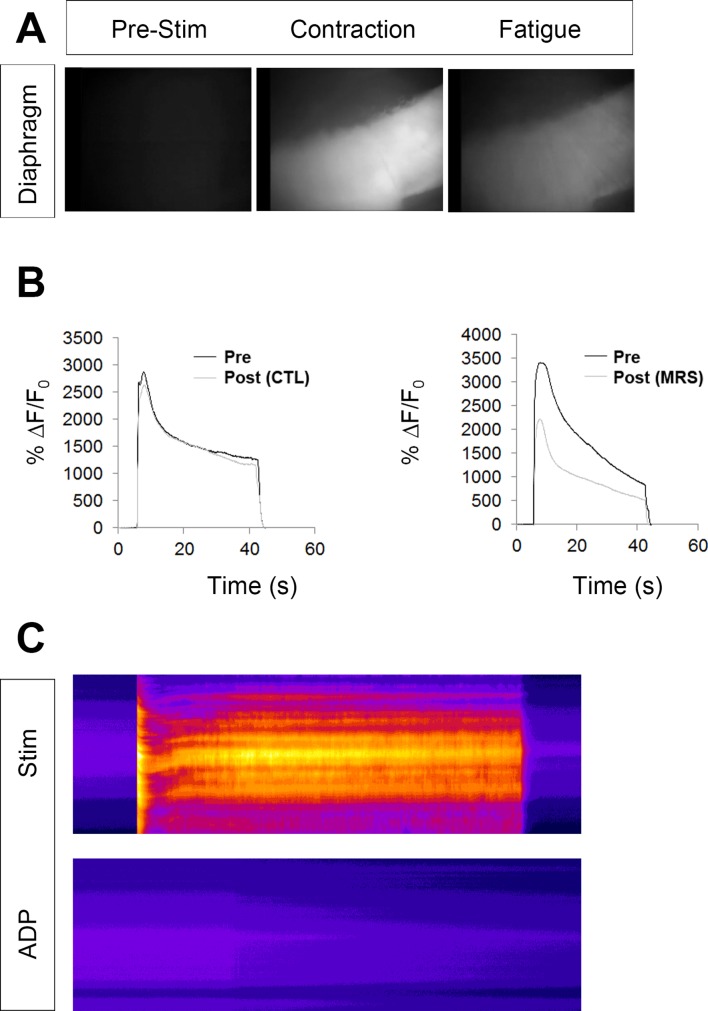
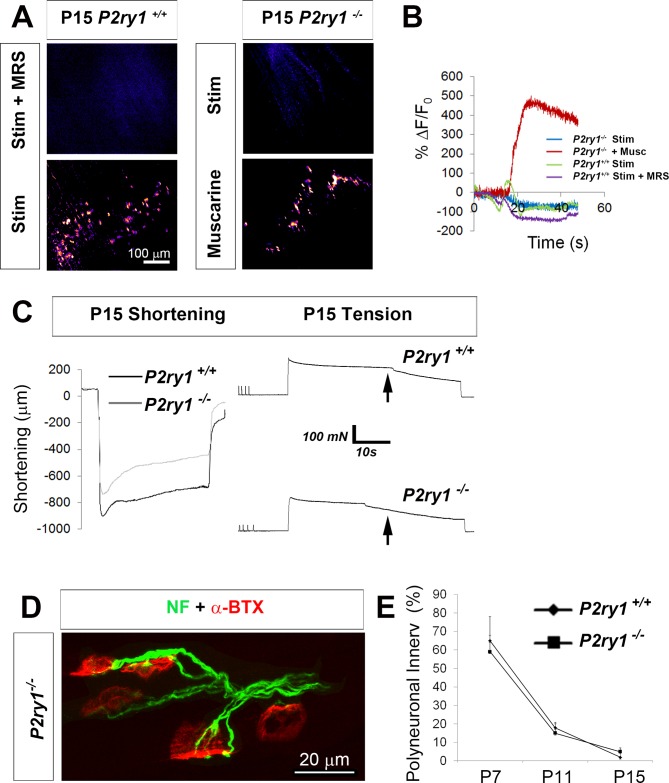
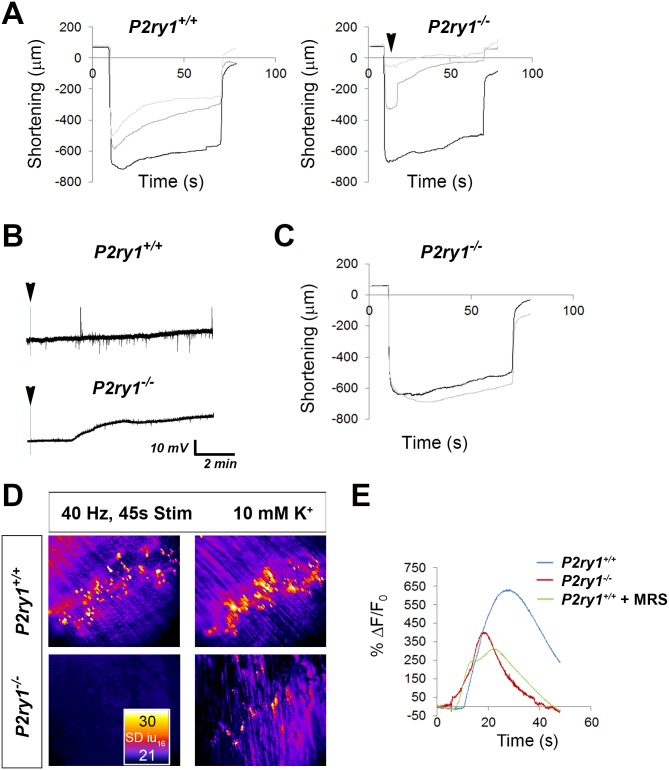
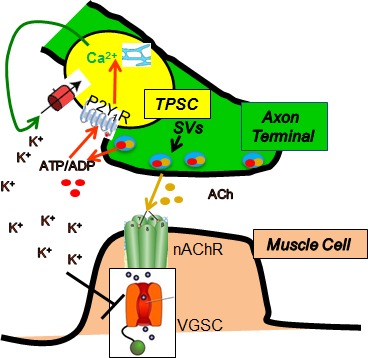
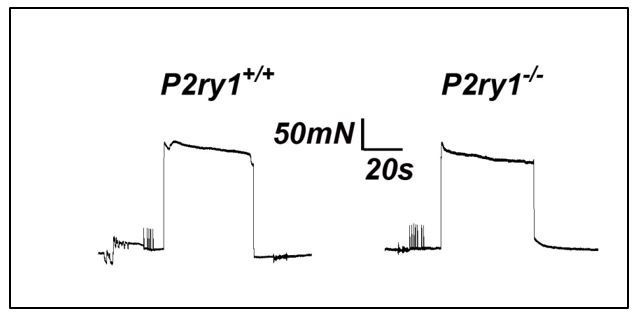
Perisynaptic glial cells respond to neural activity by increasing cytosolic calcium, but the significance of this pathway is unclear. Terminal/perisynaptic Schwann cells (TPSCs) are a perisynaptic glial cell at the neuromuscular junction that respond to nerve-derived substances such as acetylcholine and purines. Here, we provide genetic evidence that activity-induced calcium accumulation in neonatal TPSCs is mediated exclusively by one subtype of metabotropic purinergic receptor. In P2ry1 mutant mice lacking these responses, postsynaptic, rather than presynaptic, function was altered in response to nerve stimulation. This impairment was correlated with a greater susceptibility to activity-induced muscle fatigue. Interestingly, fatigue in P2ry1 mutants was more greatly exacerbated by exposure to high potassium than in control mice. High potassium itself increased cytosolic levels of calcium in TPSCs, a response which was also reduced P2ry1 mutants. These results suggest that activity-induced calcium responses in TPSCs regulate postsynaptic function and muscle fatigue by regulating perisynaptic potassium.

Keywords: Schwann; calcium; fatigue; mouse; neuromuscular; neuroscience; perisynaptic; potassium.


Conflict of interest statement

DH, CF, GH, RR, TG No competing interests declared

Figures

Figure 1.
Figure 1.. Wnt1-Cre drives expression of reporters and activity sensors to Schwann cells of the neonatal diaphragm.
(A) Whole mounts of P7 Wnt1-TdTomato diaphragm were labeled with 488-conjugated α-bungarotoxin (α-BTX). Myelinating Schwann cells along phrenic nerve branches as well as terminal/perisynaptic Schwann cells at α−BTX-labeled neuromuscular junctions (NMJs; green) exhibit tdTomato epifluorescence (red). (B) Higher magnification of whole mounts of P7 Wnt1-GCaMP3 diaphragm labeled with GFP, S100, and 633-conjugated α-BTX. All NMJ-associated, S100-immunostained TPSCs express GFP and thus GCaMP3.
Figure 2.
Figure 2.. Wnt1-GCaMP3 mice exhibit activity-induced Ca2+responses in all perisynaptic glia cells of the neonatal diaphragm.
(A) (Left panel) An average intensity image generated before application of a stimulus (Pre-stim) shows the overall structure of GCaMP3-expressing Schwann cell elements. (Right panel) Map of standard deviation of 16-bit fluorescence intensity units (SD iu16) of a population of TPSCs imaged in response to high-frequency nerve stimulation at low magnification; fire CLUT heatmap in SD iu16. (B) Same muscle imaged at higher power showing these fluorescence responses in individual TPSCs (left panel) were color coded (right panel). (C) These cells in B were plotted as color-coded transients. Note the relatively higher signals in this graph, compared to other graphs in this study, as a result of imaging at 60X, vs. 20X in others. (D) SD maps resulting from tonic vs. phasic HFS. (E) Transients elicited by 40 Hz tonic (red) or (blue) phasic stimulation. Peak transient intensities were statistically non-significant (14.7 ± 0.4 vs. 13.5 ± 1.3 dB; p=0.21; n = 3; c = 18), and duration was longer (time to 50% decay = 15.4 ± 0.7 vs. 22.3 ± 3.7 s; p<0.05) in response to phasic vs. tonic stimulation. (F) Slower onsets and lower amplitudes of Ca2+ transients in TPSCs stimulated with 10 vs. 40 Hz stimulation (10 Hz phasic onset = 17.92 ± 6.3; 10 Hz tonic onset = 11.78 ± 3.4 s; 40 Hz phasic onset = 0.99 ± 0.34 s; 40 Hz tonic onset = 1.0 ± 0.38 s; p<5.3*10−19, 1-way ANOVA; every individual comparison significant except 40 Hz phasic onset vs. 40 Hz tonic onset, based on q, qcrit comparisons). 10 = 10 Hz; 40 = 40 Hz; T = tonic; p=phasic.
Figure 3.
Figure 3.. Activity-induced responses in perisynaptic glia at the NMJ are completely dependent on P2Y1R signaling.
(A) SD maps of activity-induced (left panels) or muscarine-induced (right panels) Ca2+ responses in TPSCs of P2ry1 wild-type (WT; top panels) or mutant (bottom panels) diaphragm. Note the complete absence of activity-induced Ca2+ responses in TPSCs of P2ry1 mutants; fire CLUT heatmap in SD iu16. (B) Addition of neostigmine restores this response. (C) Atropine largely blocks muscarine-induced, but not nerve stimulation-induced, TPSC Ca2+ responses. (D) Graph representing the relative number of α-BTX-associated TPSCs exhibiting Ca2+ responses in response to activity or drug treatment. p<5.3*10−19, 1-way ANOVA; Nicotine treatment induced a variable response (28.3 + 13.3% of stim-activated cells activated by nicotine; variance = 176.3). (E) WT mice exhibit elevated Ca2+ responses to activity in the presence of the cholinesterase-blocking drug neostigmine (peak TPSC Ca2+ intensities, 16.3 ± 1.4 vs. 20 ± 2.3 dB, stim vs. stim + neostigmine, p<0.05; n = 4; c = 22).
Figure 3—figure supplement 1.
Figure 3—figure supplement 1.. Normal expression of pre-, peri- and post-synaptic elements at the NMJ of P2ry1 mutant mice lacking activity-induced Ca2+responses in perisynaptic glia.
(A) Low-power micrographs of confocal images generated from P7 diaphragms of P2ry1 WT (top row) and mutant (bottom row) diaphragm stained with antibodies against GFP (to label GCaMP3-expressing perisynaptic Schwann cells), synaptophysin (Syp; to label presynaptic nerve terminals) and 633-conjugated α-BTX (to label postsynaptic ACh receptor clusters). All NMJs are innervated and display terminal/perisynaptic Schwann cells (TPSCs). (B) High-power micrographs of the same tissue also stained with bisbenzamide (Hoechst) exhibit similar patterns of synaptic staining between genotypes. Synaptophysin-immunoreactive presynaptic terminal area, 267 ± 43 vs. 272 ± 47 μm2, p=0.85, P2ry1 WT vs. mutant, terminals = 7, n = 3. (C) α-BTX-labeled NMJs in both P2ry1 WT (left panels) and mutant (right panels) exhibit robust AChE staining.
Figure 3—figure supplement 2.
Figure 3—figure supplement 2.. Normal ultrastructural appearance of the NMJ of P2ry1 mutant mice lacking activity-induced Ca2+responses in perisynaptic glia.
Low-power (left) and high-power (right) photomicrographs of NMJs from the diaphragm of P7 P2ry1 WT (top panels) and mutant (bottom panels). Junctional folds indicated by arrows; TPSCs (SC) and muscle cells (M). Individual fold depth, 0.49 ± 0.15 vs. 0.43 ± 0.07 μm, p=0.31, P2ry1 WT vs. mutant, folds = 8, n = 3.
Figure 4.
Figure 4.. The loss of activity-induced Ca2+responses in perisynaptic glia disrupts postsynaptic but not presynaptic function at the NMJ.
(A) Phrenic nerve-evoked endplate potentials (EPPs) were measured in P7 diaphragm muscle from P2ry1 WT and mutant mice in response to basal (left panel) and high-frequency stimulation (HFS; middle and right panels). There was no difference in the amplitudes (24 ± 2.6 vs. 26.7 ± 1.5 mV; p=0.13; WT vs. mutant; n = 4; c = 16) of basal EPPs or in the amplitudes of EPPs at the end of a period of HFS. Up and downward deflections preceding each EPP are stimulation artifacts. (B) Phrenic nerve-evoked muscle action potentials (APs) were measured in P7 diaphragm muscle from P2ry1 WT and mutant mice in response to basal (left panel) and HFS (middle and right panels). There was no difference in the amplitudes (67.7 ± 7.1 vs. 67.8 ± 7.1 mV; p=0.49), the rise to peak (1.16 ± 0.2 vs. 1.07 ± 0.2 ms; p=0.33), or the time to 50% decay (2.42 ± 0.53 vs. 2.16 ± 0.82 ms; p=0.43) of basal APs, or in the percentage of successfully transmitted muscle APs at the end of a period of HFS (note the three successful APs in the WT and 2 APs in the mutant, at the end of HFS; arrowheads). (C) As shown in right panel of A, ending EPP heights are similar between genotypes (34 ± 8.6 vs. 34.3 ± 16.6% initial EPP; p=0.96; WT vs. mutant; n = 4; c = 20). (D) As shown in right panel of B, the time to 50% failure in response to HFS is similar between genotypes, in all subtypes of fatiguability (3.7 ± 1.6 vs. 2.5 ± 2.4 s for quick fatiguability; p=0.23; 22 ± 15.1 vs. 24.7 ± 13.5 s for intermediate fatiguability; p=0.67; 37.3 ± 9 vs. 37.2 ± 6.8 s for slow fatiguability; p=0.75; WT vs. mutant; n = 4; c = 27). (E) Muscle APs from the beginning (left) or end of a train of HFS from P2ry1 WT (black; +/+) or mutant (gray; -/-) mice. Muscle AP rise-to-peak was lengthened (2.0 ± 0.6 vs. 2.7 ± 0.7 ms; WT vs. mutant, p<0.05) and amplitude was reduced (58.1 ± 3.23 vs. 53.7 ± 4.5 mV; WT vs. mutant, n = 4, c = 13; p<0.05) at the end of a train of HFS.
Figure 5.
Figure 5.. The loss of activity-induced Ca2+responses in perisynaptic glia leads to enhanced muscle fatigue.
(A) Images of a P7 hemi-diaphragm before phrenic nerve stimulation, at peak contraction, and during fatigue. Black and white arrows indicate sites used to compare fiber length changes. (B) The shortening of muscle fibers, as measured by the change in distance between the two sites indicated by arrows in A, is represented as a negative number. Peak length changes (shortening) are similar between genotypes (751.6 ± 136 μm vs. 726 ± 182 μm; p=0.75), but are maintained significantly less over time in P2ry1 mutants (ending length change = 72.6 ± 7.3 vs. 61.5 ± 9.5% peak length change; n = 9; P2ry1 WT vs. mutant; *p<0.05). (C) Fatigue is also enhanced by acute blockade of TPSC Ca2+ responses with the P2Y1R antagonist MRS2500 (ending length change = 63.7 ± 10.8 vs. 51.4 ± 5.3% peak length change; n = 4; untreated vs. MRS2500-treated; *p<0.05; data in graph presented as the failure to maintain peak shortening or 100% minus these values). (D) Peak length changes in response to the seventh bout of HFS are reduced in P2ry1 mutants (664.6 ± 43.7 μm vs. 564.4 ± 64.1 μm; *p<0.05), as is fatigue (ending length change = 74.5 ± 13.6 vs. 61.3 ± 5.8% peak length change; n = 4; P2ry1 WT vs. mutant; *p<0.05). (E) Image of transverse section of P7 diaphragm from P2ry1 WT and mutant mice, stained with antibodies against myosin heavy chain (MHC) Type I (blue), MHC Type IIA (green) and MHC Type IIB (red) antibodies (left panel). No difference between genotypes was observed in the number of each MHC muscle fiber subtype (15 ± 3 vs. 13 ± 3, p=0.46; Type I; 50 ± 6 vs. 49 ± 5, p=0.83; Type IIa; 8 ± 2 vs. 7 ± 2, p=0.59; Type IIb; 26 ± 4 vs. 31 ± 5, p=0.36; Type IIx; all values are P2ry1 WT vs. mutant; n = 3).
Figure 5—figure supplement 1.
Figure 5—figure supplement 1.. The loss of activity-induced Ca2+responses in perisynaptic glia leads to greater and quicker loss of peak muscle Ca2+transient intensity.
(A) Images of a P7 hemi-diaphragm from a Myf5-GCaMP3 mouse before phrenic nerve stimulation, at peak contraction, and during fatigue. (B) Left graph: Peak intensities (28.8 ± 0.4 vs. 29.5 ± 1.3 vs. dB, p=0.2), time to 50% decay (32.8 ± 8.7 vs. 26.7 ± 8.2 s, p=0.2), and ending relative to peak intensities (ending intensity = 45.0 ± 5.4 vs. 43.8 ± 3.1% peak intensity; second vs. first HFS; p=0.38, n = 3) are unchanged in response to a second HFS bout, vs. a first one. Right graph: peak intensities are reduced (27.3 ± 0.8 vs. 30.9 ± 0.8 dB p<0.005), time to 50% decay is enhanced (18.7 ± 1.9 vs. 23.7 ± 2.6 s; p<0.05), and ending relative to peak intensities are unchanged (ending intensity = 27.3 ± 4.3 vs. 24.3 ± 3% peak intensity; p<0.05; second vs. first HFS; p=0.18, n = 3), in response to a second HFS bout in the presence of MRS2500, vs. a first one in the absence of this drug. (C) In contrast to nerve stimulation of the same diaphragm (stim), treatment with 100 μM ATP fails to elicit a Ca2+ response in muscle cells expressing GCaMP3 (15.52 ± 4.1 vs. 0.01 ± 0.12 dB; p<0.005, n = 3).
Figure 6.
Figure 6.. The loss of activity-induced Ca2+responses in perisynaptic glia does not affect the rate or magnitude of polyneuronal synapse elimination.
(A) Pharmacological or genetic disruption of P2Y1R signaling completely blocks activity-induced TPSC Ca2+ responses at P15: P2ry1 WT mice exhibited nerve stimulation-induced responses that were blocked after treatment with 1 μM MRS2500 (left images). P2ry1 mutant mice failed to exhibit nerve stimulation-induced Ca2+ responses in TPSCs but exhibited robust responses to bath-applied muscarine (right images). (B) Peak TPSC Ca2+ intensities in response to these manipulations: (5.4 ± 1.2 vs. 1.5 ± 0.56 dB, WT stim vs. mutant stim, p<0.005; 5.4 ± 1.2 vs. 0.1 ± 0.04 dB, WT stim vs. WT stim +MRS2500, p<0.0001; 15.6 ± 0.7 vs. 1.5 ± 0.56 dB, mutant stim vs. mutant +muscarine, p<0.0001, Student’s t with Bonferonni correction; c > 10 per n; n = 3–4; fluorescence units from fire CLUT heatmap in SD iu16. (C) Fatigue is enhanced in P15 P2ry1 mutants using optical measures (ending length change = 75.9 ± 8 vs. 58.6 ± 11.6% peak length change; n = 3; P2ry1 WT vs. mutant; p<0.05) or tension recording (ending force = 39.2 ± 5.1 vs. 32.3 ± 4.3% peak force; n = 3; P2ry1 WT vs. mutant; p<0.05). Drop in force occurs earlier in mutant vs. WT (arrows). (D) Polyneuronally innervated NMJs from a P7 P2ry1 mutant diaphragm; red = AlexaFluor 594-labeled α-BTX to label AChRs; green = neurofilament immunostaining to label presynaptic nerve terminals. (E) The number of polyneuronally innervated NMJs is similar between P2ry1 WT and mutant mice (P7: 65 ± 9 vs. 59 ± 13%, p=0.41; P11: 18 ± 5 vs. 15 ± 3%, p=0.34; P15: 2 ± 2 vs. 5 ± 3%, p=0.19 polyneuronally innervated NMJs; n = 5; P2ry1 WT vs. mutant).
Figure 7.
Figure 7.. High [K+o] triggers greater muscle fatigue, greater muscle membrane depolarization, and reduced Ca2+responses in the absence of activity-induced Ca2+responses in perisynaptic glia.
(A) Muscle length changes from P7 diaphragm of P2ry1 WT (left) and mutant (right) mice were first recorded in response to HFS in normal or 5 mM [K+]o (black traces), and then recorded in response to 2 bouts of HFS (60 Hz, 45 s) in 10 mM [K+]o (dark and light grey traces = 1st and 2nd HFS, respectively). Peak length changes and fatigue are dramatically affected in P2ry1 mutants by high [K+o]: peak length in response to first HFS in 10 mM [K+]o as a percentage of peak length in response to control HFS in 5 mM [K+]o = 93 ± 20.7 vs. 53.8 ± 24%; n = 3; P2ry1 WT vs. mutant mice, p<0.05; peak length change in response to second HFS in 10 mM [K+]o = 74.2 ± 15.5 vs. 20.9 ± 11% control HFS; n = 3; P2ry1 WT vs. mutant mice; p<0.005; asterisk indicates this almost complete failure to contract; fatigue, or ending length change of second HFS in high 10 mM [K+]o = 41.3 ± 17.8 vs. 7.4 ± 6.8 peak length change of first HFS in 5 mM [K+]o; n = 3; P2ry1 WT vs. mutant mice, p<0.05). (B) Muscle length changes in P2ry1 mutants in response to HFS in lowered [K+]o show a statistically non-significant trend toward less fatigue (ending length change, 2.5 mM [K+]o (grey trace) vs. 5 mM [K+]o (black trace)=75.1 ± 6.2 vs. 83.9 ± 12.9% peak length change; n = 3, p=0.17). (C) Effect of high [K+]o on resting membrane potential (RMP). Representative muscle cell recording before and after (arrowhead) [K+]o was changed from 5 to 10 mM in P7 diaphragm from P2ry1 WT (left) and mutant (right). (D) SD intensity maps of TPSCs in response to HFS (left panels) in P2ry1 WT (upper) and mutant (lower) mice and in response to subsequent treatment with 10 mM [K+]o (right panels). Markedly fewer TPSCs responded to elevated [K+]o in P2ry1 mutants. (E) Peak Ca2+ transient intensities of TPSCs responding to 10 mM [K+]o after 3 bouts of HFS were significantly reduced in P2ry1 mutants or in WT mice treated with the P2Y1R antagonist MRS2500 (18.6 ± 2.5 vs. 14.5 ± 1.5 dB, WT vs. mutant, p<0.05, c > 10 per n; n = 4, Student’s t with Bonferonni correction; 18.6 ± 2.5 vs. 13.8 ± 0.8 dB, WT vs. WT + MRS2500, p<0.01, c > 10 per n; n = 4, Student’s t with Bonferonni correction; fluorescence units from fire CLUT heatmap in SD iu16).
Figure 8.
Figure 8.. Proposed model by which nerve stimulation-induced Ca2+responses in TPSCs regulate muscle fatigue.
Upon stimulation, presynaptic motor axon terminals (green) release acetylcholine (ACh) from synaptic vesicles (SVs), which elicits endplate potentials via postsynaptic nicotinic ACh receptors (nAChR), followed by activation of voltage-gated sodium channels (VGSC), leading to action potentials and contraction of muscle (brown). Nerve terminals also release ATP, which as itself or ADP stimulates in TPSCs (yellow) the release of calcium (Ca2+) from intracellular stores via P2Y1 receptors (P2Y1R). This signal leads to the movement into TPSCs of perisynaptic potassium (K+), produced by both neurons and muscle cells in response to stimulation. This regulation of perisynaptic K+ levels by TPSCs is proposed to reduce the inactivation of VGSCs by K+ in the neuromuscular synapse during repetitive stimulation, thus reducing muscle fatigue.
Author response image 1.
Author response image 2.
Author response image 3.

Similar articles

Cited by

References

    1. Adler M, Sweeney RE, Hamilton TA, Lockridge O, Duysen EG, Purcell AL, Deshpande SS. Role of acetylcholinesterase on the structure and function of cholinergic synapses: insights gained from studies on knockout mice. Cellular and Molecular Neurobiology. 2011;31:909–920. doi: 10.1007/s10571-011-9690-5. - DOI - PMC - PubMed
    1. Agulhon C, Boyt KM, Xie AX, Friocourt F, Roth BL, McCarthy KD. Modulation of the autonomic nervous system and behaviour by acute glial cell Gq protein-coupled receptor activation in vivo. The Journal of Physiology. 2013;591:5599–5609. doi: 10.1113/jphysiol.2013.261289. - DOI - PMC - PubMed
    1. Agulhon C, Fiacco TA, McCarthy KD. Hippocampal short- and long-term plasticity are not modulated by astrocyte Ca2+ signaling. Science. 2010;327:1250–1254. doi: 10.1126/science.1184821. - DOI - PubMed
    1. Akerboom J, Carreras Calderón N, Tian L, Wabnig S, Prigge M, Tolö J, Gordus A, Orger MB, Severi KE, Macklin JJ, Patel R, Pulver SR, Wardill TJ, Fischer E, Schüler C, Chen TW, Sarkisyan KS, Marvin JS, Bargmann CI, Kim DS, Kügler S, Lagnado L, Hegemann P, Gottschalk A, Schreiter ER, Looger LL. Genetically encoded calcium indicators for multi-color neural activity imaging and combination with optogenetics. Frontiers in Molecular Neuroscience. 2013;6:2. doi: 10.3389/fnmol.2013.00002. - DOI - PMC - PubMed
    1. Allen DG, Lamb GD, Westerblad H. Skeletal muscle fatigue: cellular mechanisms. Physiological Reviews. 2008;88:287–332. doi: 10.1152/physrev.00015.2007. - DOI - PubMed

Publication types

Substances

LinkOut - more resources