

Coordination of olfactory receptor choice with guidance receptor expression and function in olfactory sensory neurons
- PMID: 29385124
- PMCID: PMC5809090
- DOI: 10.1371/journal.pgen.1007164
Coordination of olfactory receptor choice with guidance receptor expression and function in olfactory sensory neurons
Abstract
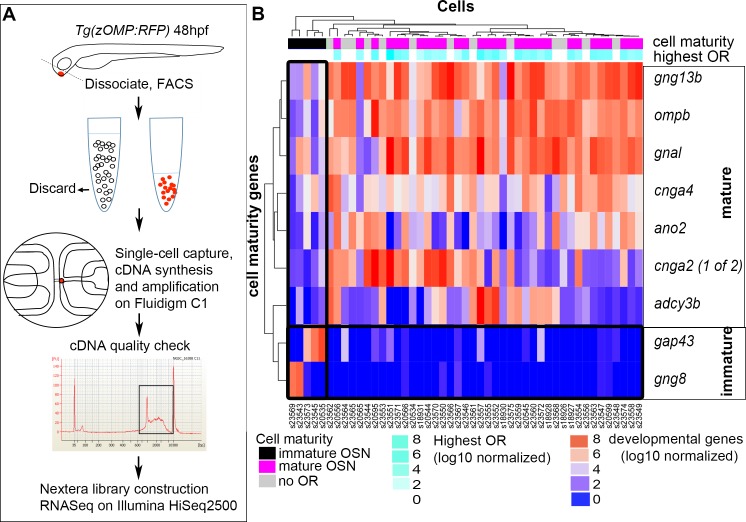
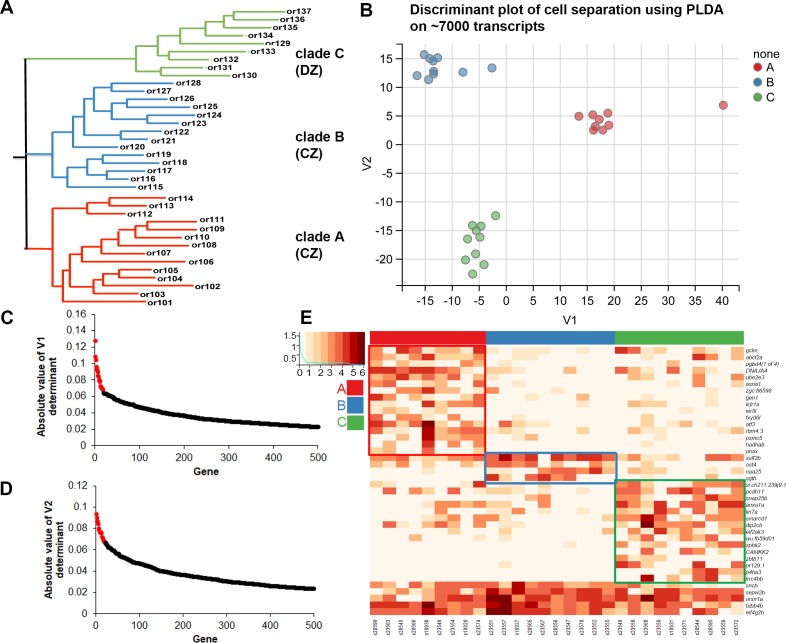
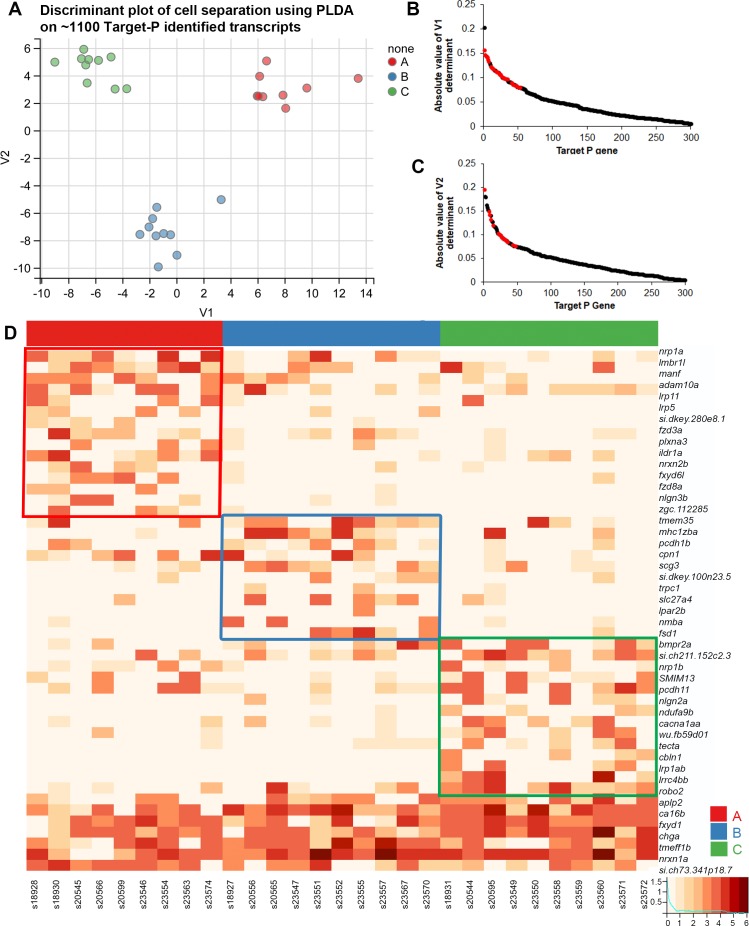
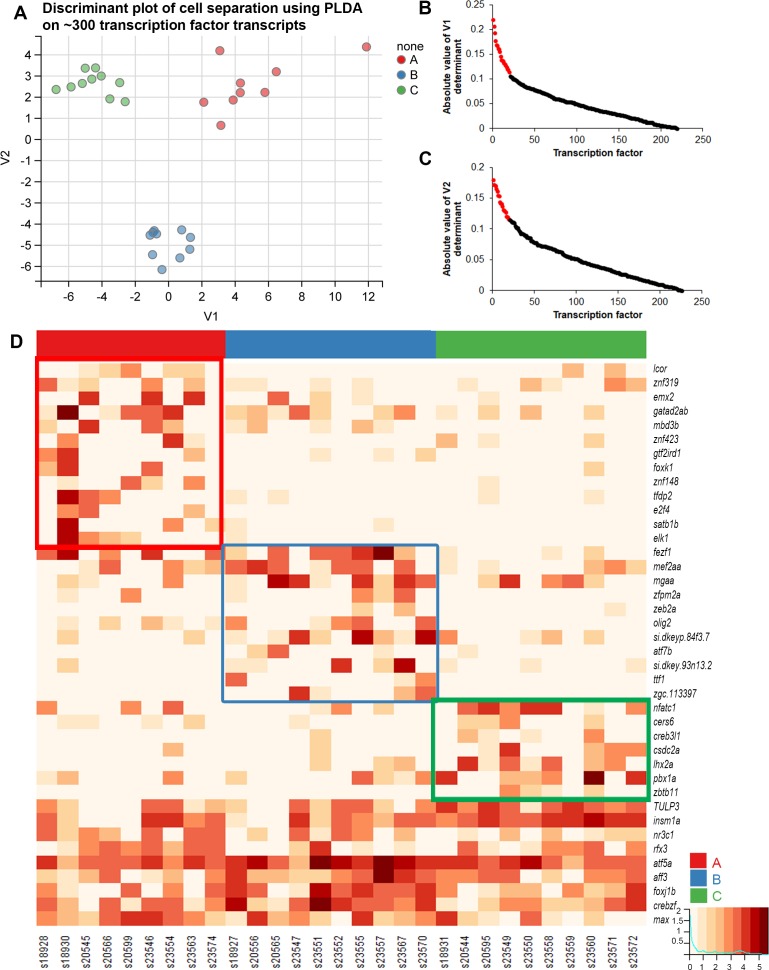
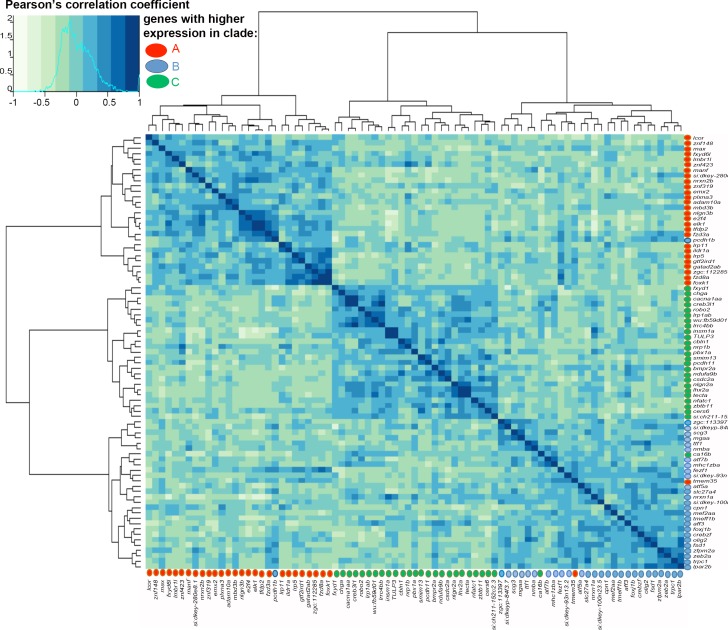
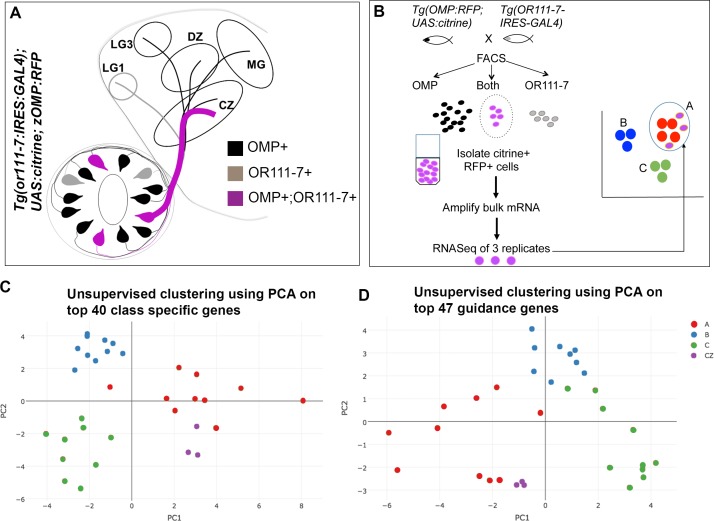
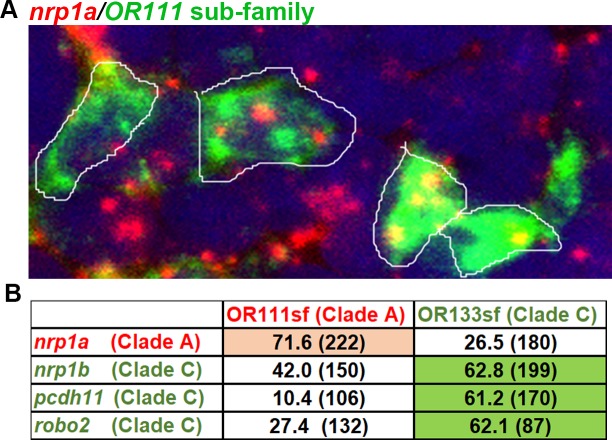
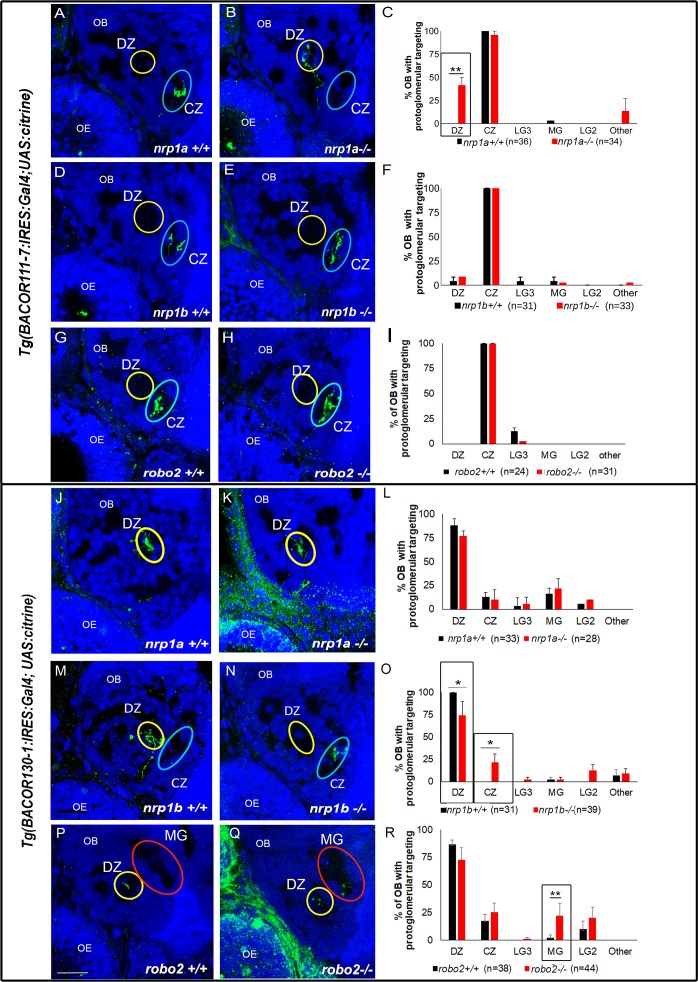
Olfactory sensory neurons choose to express a single odorant receptor (OR) from a large gene repertoire and extend axons to reproducible, OR-specific locations within the olfactory bulb. This developmental process produces a topographically organized map of odorant experience in the brain. The axon guidance mechanisms that generate this pattern of connectivity, as well as those that coordinate OR choice and axonal guidance receptor expression, are incompletely understood. We applied the powerful approach of single-cell RNA-seq on newly born olfactory sensory neurons (OSNs) in young zebrafish larvae to address these issues. Expression profiles were generated for 56 individual Olfactory Marker Protein (OMP) positive sensory neurons by single-cell (SC) RNA-seq. We show that just as in mouse OSNs, mature zebrafish OSNs typically express a single predominant OR transcript. Our previous work suggests that OSN targeting is related to the OR clade from which a sensory neuron chooses to express its odorant receptor. We categorized each of the mature cells based on the clade of their predominantly expressed OR. Transcripts expressed at higher levels in each of three clade-related categories were identified using Penalized Linear Discriminant Analysis (PLDA). A genome-wide approach was used to identify membrane-associated proteins that are most likely to have guidance-related activity. We found that OSNs that choose to express an OR from a particular clade also express specific subsets of potential axon guidance genes and transcription factors. We validated our identification of candidate axon guidance genes for one clade of OSNs using bulk RNA-seq from a subset of transgene-labeled neurons that project to a single protoglomerulus. The differential expression patterns of selected candidate guidance genes were confirmed using fluorescent in situ hybridization. Most importantly, we observed axonal mistargeting in knockouts of three candidate axonal guidance genes identified in this analysis: nrp1a, nrp1b, and robo2. In each case, targeting errors were detected in the subset of axons that normally express these transcripts at high levels, and not in the axons that express them at low levels. Our findings demonstrate that specific, functional, axonal guidance related genes are expressed in subsets of OSNs that that can be categorized by their patterns of OR expression.
Conflict of interest statement
The authors have declared that no competing interests exist.
Figures
Similar articles
-
Olfactory sensory axons target specific protoglomeruli in the olfactory bulb of zebrafish.Neural Dev. 2017 Oct 11;12(1):18. doi: 10.1186/s13064-017-0095-0. Neural Dev. 2017. PMID: 29020985 Free PMC article.
-
Hierarchical regulation of odorant receptor gene choice and subsequent axonal projection of olfactory sensory neurons in zebrafish.J Neurosci. 2007 Feb 14;27(7):1606-15. doi: 10.1523/JNEUROSCI.4218-06.2007. J Neurosci. 2007. PMID: 17301169 Free PMC article.
-
Mutually exclusive glomerular innervation by two distinct types of olfactory sensory neurons revealed in transgenic zebrafish.J Neurosci. 2005 May 18;25(20):4889-97. doi: 10.1523/JNEUROSCI.0679-05.2005. J Neurosci. 2005. PMID: 15901770 Free PMC article.
-
Odorant receptor gene choice and axonal projection in the mouse olfactory system.Results Probl Cell Differ. 2009;47:57-75. doi: 10.1007/400_2008_3. Results Probl Cell Differ. 2009. PMID: 19083127 Review.
-
Maturation of the Olfactory Sensory Neuron and Its Cilia.Chem Senses. 2020 Dec 5;45(9):805-822. doi: 10.1093/chemse/bjaa070. Chem Senses. 2020. PMID: 33075817 Free PMC article. Review.
Cited by
-
Larval Zebrafish Use Olfactory Detection of Sodium and Chloride to Avoid Salt Water.Curr Biol. 2021 Feb 22;31(4):782-793.e3. doi: 10.1016/j.cub.2020.11.051. Epub 2020 Dec 17. Curr Biol. 2021. PMID: 33338431 Free PMC article.
-
Warming affects routine swimming activity and novel odour response in larval zebrafish.Sci Rep. 2023 Nov 29;13(1):21075. doi: 10.1038/s41598-023-48287-y. Sci Rep. 2023. PMID: 38030737 Free PMC article.
-
Loss of Neuropilin2a/b or Sema3fa alters olfactory sensory axon dynamics and protoglomerular targeting.Neural Dev. 2022 Jan 3;17(1):1. doi: 10.1186/s13064-021-00157-x. Neural Dev. 2022. PMID: 34980234 Free PMC article.
-
Transcriptome Analysis of Zebrafish Olfactory Epithelium Reveal Sexual Differences in Odorant Detection.Genes (Basel). 2020 May 27;11(6):592. doi: 10.3390/genes11060592. Genes (Basel). 2020. PMID: 32471067 Free PMC article.
-
Transcriptomics-Based Study of Differentially Expressed Genes Related to Fat Deposition in Tibetan and Yorkshire Pigs.Front Vet Sci. 2022 Jun 9;9:919904. doi: 10.3389/fvets.2022.919904. eCollection 2022. Front Vet Sci. 2022. PMID: 35754534 Free PMC article.
References
-
- Chess A, Simon I, Cedar H, Axel R. Allelic inactivation regulates olfactory receptor gene expression. Cell. 1994. September 9;78(5):823–34. - PubMed
-
- Mombaerts P. Odorant receptor gene choice in olfactory sensory neurons: the one receptor–one neuron hypothesis revisited. Current opinion in neurobiology. 2004. February 29;14(1):31–6. doi: 10.1016/j.conb.2004.01.014 - DOI - PubMed
-
- Zhang X, Firestein S. The olfactory receptor gene superfamily of the mouse. Nature neuroscience. 2002. February 1;5(2):124 doi: 10.1038/nn800 - DOI - PubMed
-
- Ressler KJ, Sullivan SL, Buck LB. Information coding in the olfactory system: evidence for a stereotyped and highly organized epitope map in the olfactory bulb. Cell. 1994. December 30;79(7):1245–55. - PubMed
Publication types
MeSH terms
Substances
Grants and funding
LinkOut - more resources
Full Text Sources
Other Literature Sources
Molecular Biology Databases
Research Materials
