

Increased survival of honeybees in the laboratory after simultaneous exposure to low doses of pesticides and bacteria
- PMID: 29385177
- PMCID: PMC5791986
- DOI: 10.1371/journal.pone.0191256
Increased survival of honeybees in the laboratory after simultaneous exposure to low doses of pesticides and bacteria
Abstract
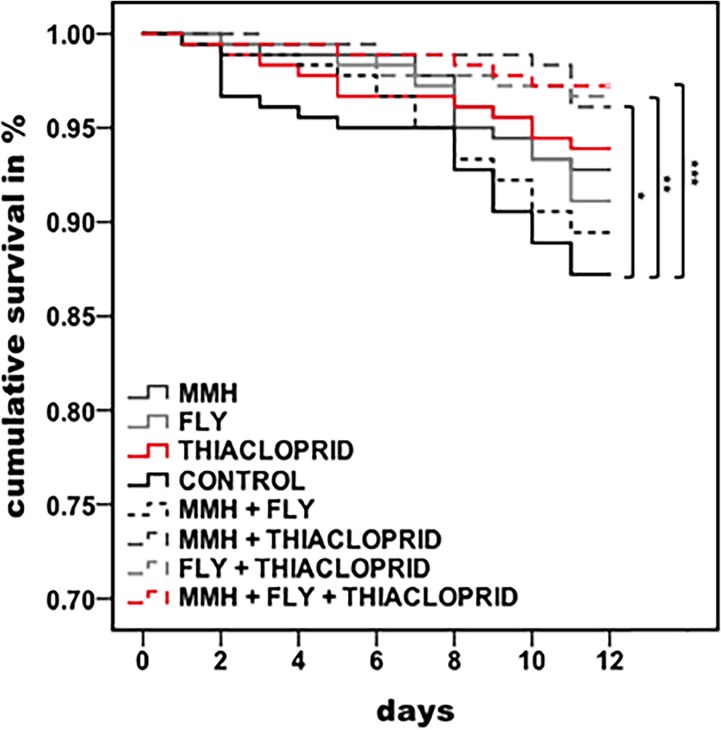
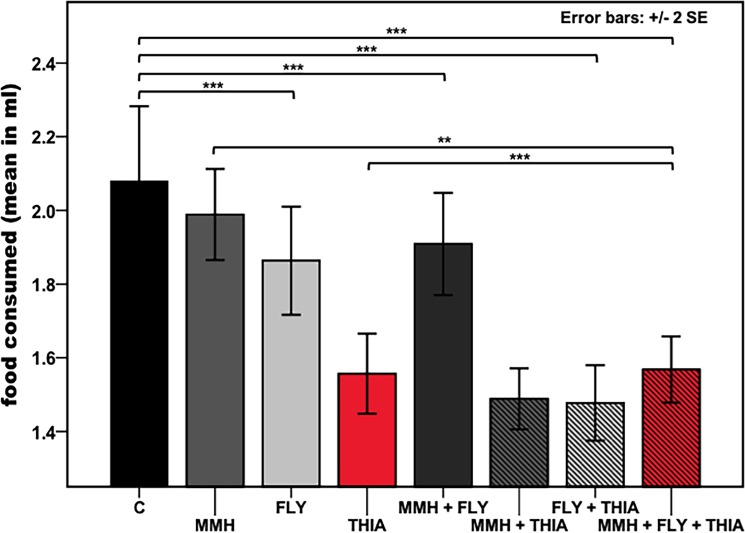
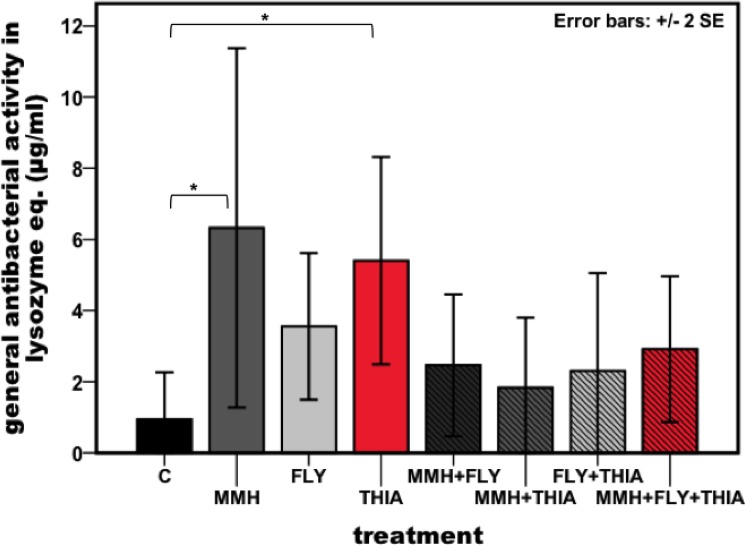
Recent studies of honeybees and bumblebees have examined combinatory effects of different stressors, as insect pollinators are naturally exposed to multiple stressors. At the same time the potential influences of simultaneously occurring agricultural agents on insect pollinator health remain largely unknown. Due to different farming methods, and the drift of applied agents and manure, pollinators are most probably exposed to insecticides but also bacteria from organic fertilizers at the same time. We orally exposed honeybee workers to sub-lethal doses of the insecticide thiacloprid and two strains of the bacterium Enterococcus faecalis, which can occur in manure from farming animals. Our results show that under laboratory conditions the bees simultaneously exposed to the a bacterium and the pesticide thiacloprid thiacloprid had significant higher survival rates 11 days post exposure than the controls, which surprisingly showed the lowest survival. Bees that were exposed to diet containing thiacloprid showed decreased food intake. General antibacterial activity is increased by the insecticide and the bacteria, resulting in a higher immune response observed in treated individuals compared to control individuals. We thus propose that caloric restriction through behavioural and physiological adaptations may have mediated an improved survival and stress resistance in our tests. However, the decreased food consumption could in long-term also result in possible negative effects at colony level. Our study does not show an additive negative impact of sub-lethal insecticide and bacteria doses, when tested under laboratory conditions. In contrast, we report seemingly beneficial effects of simultaneous exposure of bees to agricultural agents, which might demonstrate a surprising biological capacity for coping with stressors, possibly through hormetic regulation.
Conflict of interest statement
Figures
References
-
- Klein A- M, Vaissière BE, Cane JH, Steffan-Dewenter I, Cunningham SA, Kremen C, et al. Importance of pollinators in changing landscapes for world crops. Proc Biol Sci. 2007;274: 303–313. doi: 10.1098/rspb.2006.3721 - DOI - PMC - PubMed
-
- Rose T, Kremen C, Thrupp A, Gemmill-Herren B, Graub B, Azzu N. Policy Anlaysis Paper: Mainstreaming of biodiversity and ecosystem services with a focus on pollination [Internet]. 2016. Available: http://www.fao.org/3/a-i4242e.pdf
-
- Gallai N, Salles J-M, Settele J, Vaissière BE. Economic valuation of the vulnerability of world agriculture confronted with pollinator decline. Ecol Econ. Elsevier B.V.; 2009;68: 810–821. doi: 10.1016/j.ecolecon.2008.06.014 - DOI
-
- Schreinemachers P, Tipraqsa P. Agricultural pesticides and land use intensification in high, middle and low income countries. Food Policy. 2012; doi: 10.1016/j.foodpol.2012.06.003 - DOI
-
- Potts SG, Biesmeijer JC, Kremen C, Neumann P, Schweiger O, Kunin WE. Global pollinator declines: trends, impacts and drivers. Trends Ecol Evol. 2010;25: 345–53. doi: 10.1016/j.tree.2010.01.007 - DOI - PubMed
Publication types
MeSH terms
Substances
LinkOut - more resources
Full Text Sources
Other Literature Sources
