

The proteomic response of the reef coral Pocillopora acuta to experimentally elevated temperatures
- PMID: 29385204
- PMCID: PMC5792016
- DOI: 10.1371/journal.pone.0192001
The proteomic response of the reef coral Pocillopora acuta to experimentally elevated temperatures
Abstract
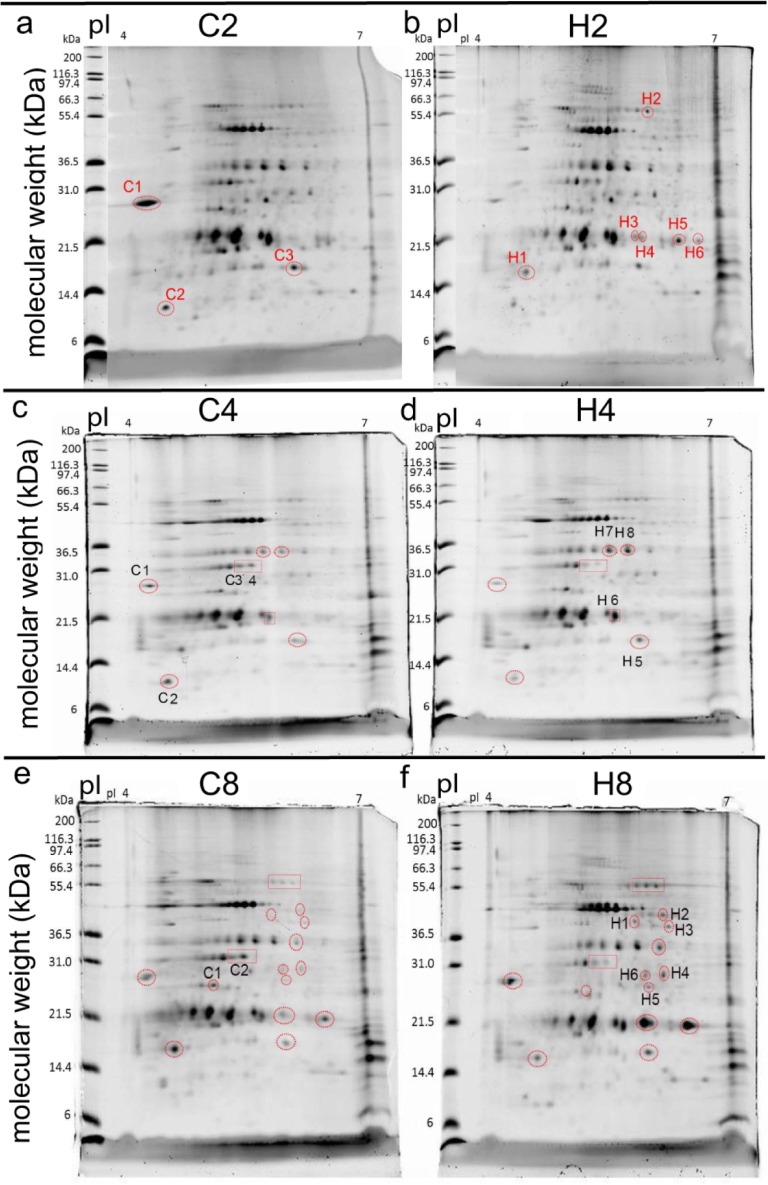
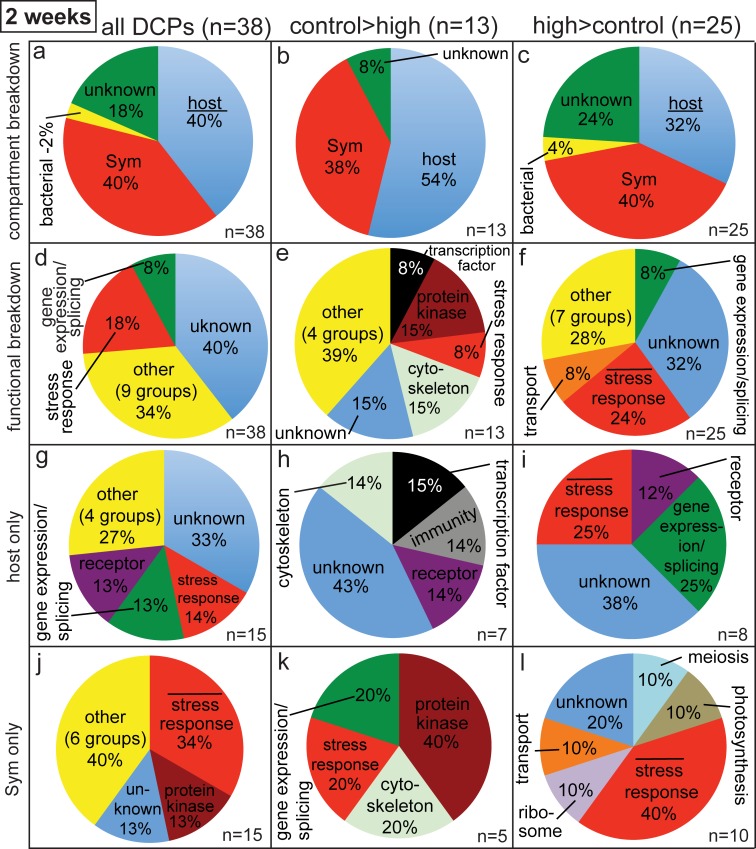
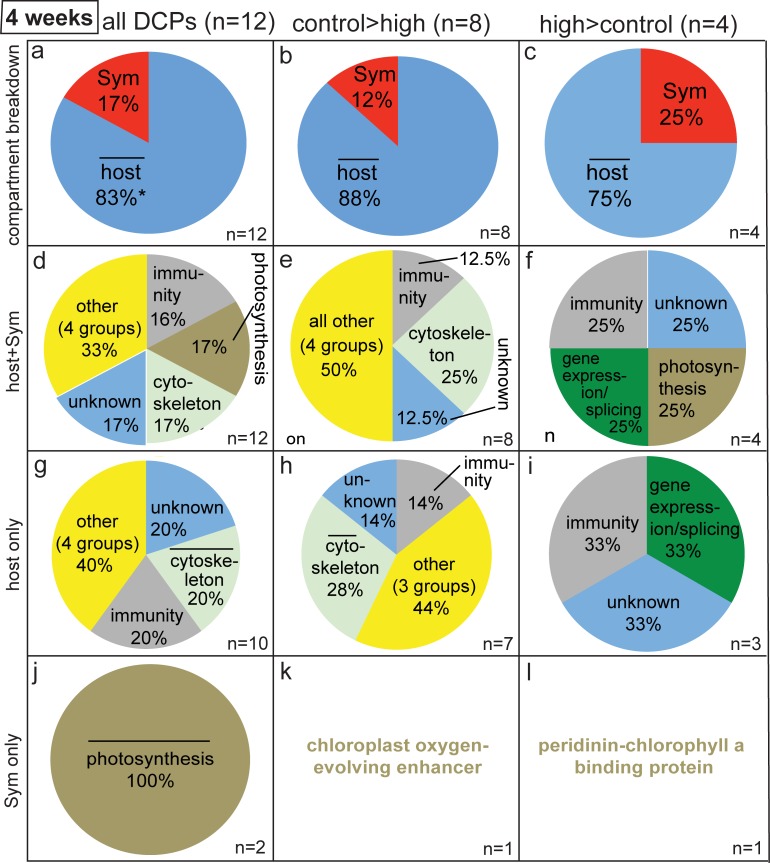
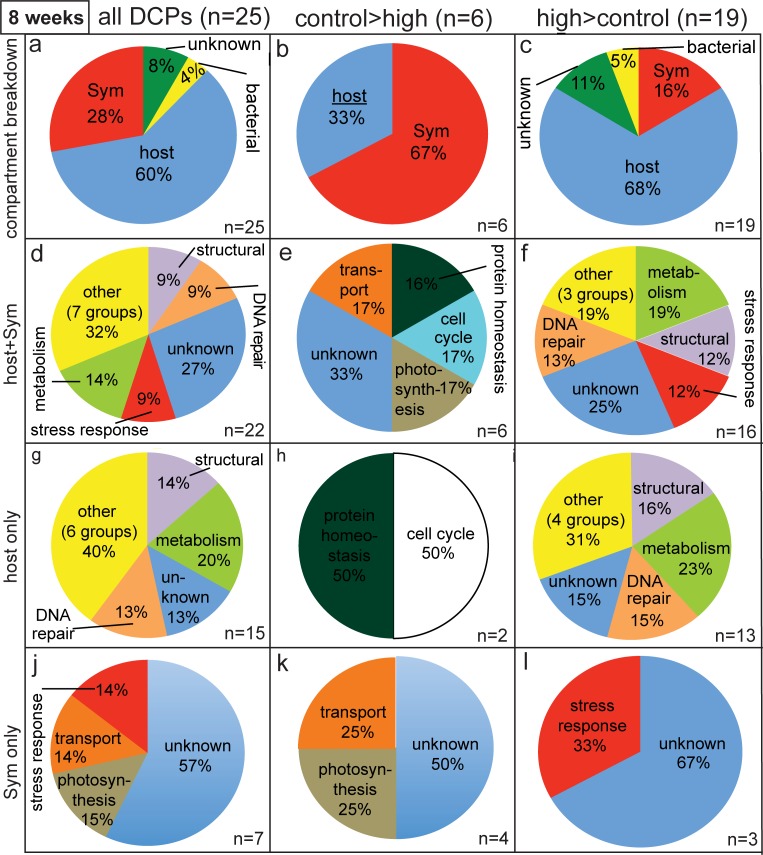
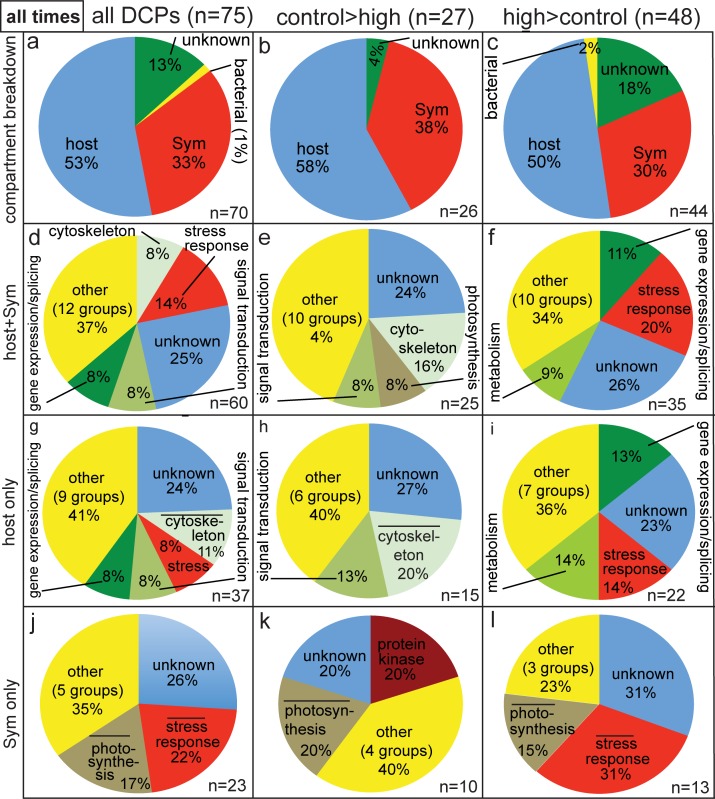
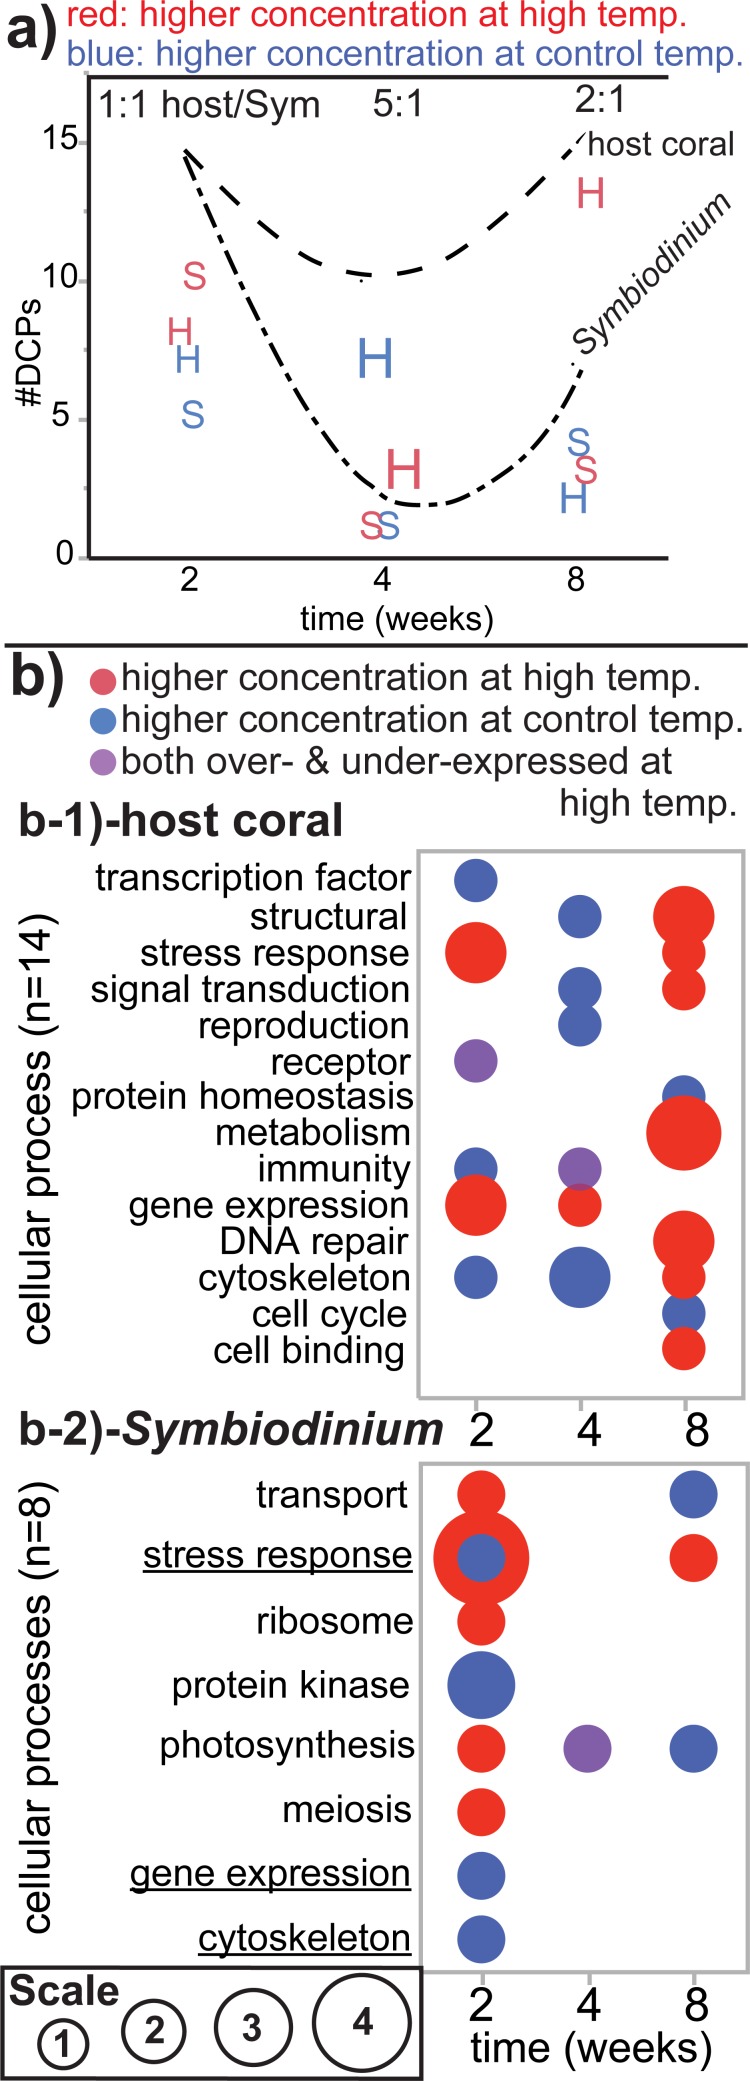
Although most reef-building corals live near the upper threshold of their thermotolerance, some scleractinians are resilient to temperature increases. For instance, Pocillopora acuta specimens from an upwelling habitat in Southern Taiwan survived a nine-month experimental exposure to 30°C, a temperature hypothesized to induce stress. To gain a greater understanding of the molecular pathways underlying such high-temperature acclimation, the protein profiles of experimental controls incubated at 27°C were compared to those of conspecific P. acuta specimens exposed to 30°C for two, four, or eight weeks, and differentially concentrated proteins (DCPs) were removed from the gels and sequenced with mass spectrometry. Sixty unique DCPs were uncovered across both eukaryotic compartments of the P. acuta-dinoflagellate (genus Symbiodinium) mutualism, and Symbiodinium were more responsive to high temperature at the protein-level than the coral hosts in which they resided at the two-week sampling time. Furthermore, proteins involved in the stress response were more likely to be documented at different cellular concentrations across temperature treatments in Symbiodinium, whereas the temperature-sensitive host coral proteome featured numerous proteins involved in cytoskeletal structure, immunity, and metabolism. These proteome-scale data suggest that the coral host and its intracellular dinoflagellates have differing strategies for acclimating to elevated temperatures.
Conflict of interest statement
Figures
Similar articles
-
Compartment-specific transcriptomics in a reef-building coral exposed to elevated temperatures.Mol Ecol. 2014 Dec;23(23):5816-30. doi: 10.1111/mec.12982. Mol Ecol. 2014. PMID: 25354956 Free PMC article.
-
The physiological response of the reef coral Pocillopora damicornis to elevated temperature: results from coral reef mesocosm experiments in Southern Taiwan.Mar Environ Res. 2013 May;86:1-11. doi: 10.1016/j.marenvres.2013.01.004. Epub 2013 Feb 10. Mar Environ Res. 2013. PMID: 23453047
-
Lineage-specific transcriptional profiles of Symbiodinium spp. unaltered by heat stress in a coral host.Mol Biol Evol. 2014 Jun;31(6):1343-52. doi: 10.1093/molbev/msu107. Epub 2014 Mar 20. Mol Biol Evol. 2014. PMID: 24651035
-
Metabolomic signatures of corals thriving across extreme reef habitats reveal strategies of heat stress tolerance.Proc Biol Sci. 2023 Feb 8;290(1992):20221877. doi: 10.1098/rspb.2022.1877. Epub 2023 Feb 8. Proc Biol Sci. 2023. PMID: 36750192 Free PMC article.
-
The Occurrence of Mixed Infections of Symbiodinium (Dinoflagellata) within Individual Hosts.J Phycol. 2012 Dec;48(6):1306-16. doi: 10.1111/j.1529-8817.2012.01220.x. Epub 2012 Sep 17. J Phycol. 2012. PMID: 27009983 Review.
Cited by
-
Synergistic response to climate stressors in coral is associated with genotypic variation in baseline expression.Proc Biol Sci. 2024 Mar 27;291(2019):20232447. doi: 10.1098/rspb.2023.2447. Epub 2024 Mar 27. Proc Biol Sci. 2024. PMID: 38531406 Free PMC article.
-
Pooled resequencing of larvae and adults reveals genomic variations associated with Ostreid herpesvirus 1 resistance in the Pacific oyster Crassostrea gigas.Front Immunol. 2022 Aug 19;13:928628. doi: 10.3389/fimmu.2022.928628. eCollection 2022. Front Immunol. 2022. PMID: 36059443 Free PMC article.
-
Comparative Proteomic Analysis of Non-Bleached and Bleached Fragments of the Hydrocoral Millepora complanata Reveals Stress Response Signatures Following the 2015-2016 ENSO Event in the Mexican Caribbean.Biology (Basel). 2025 Aug 13;14(8):1042. doi: 10.3390/biology14081042. Biology (Basel). 2025. PMID: 40906361 Free PMC article.
-
Global host molecular perturbations upon in situ loss of bacterial endosymbionts in the deep-sea mussel Bathymodiolus azoricus assessed using proteomics and transcriptomics.BMC Genomics. 2019 Feb 6;20(1):109. doi: 10.1186/s12864-019-5456-0. BMC Genomics. 2019. PMID: 30727955 Free PMC article.
-
Gene expression response under thermal stress in two Hawaiian corals is dominated by ploidy and genotype.Ecol Evol. 2024 Jul 24;14(7):e70037. doi: 10.1002/ece3.70037. eCollection 2024 Jul. Ecol Evol. 2024. PMID: 39050655 Free PMC article.
References
-
- Hoegh-Guldberg O, Bruno JF. The impact of climate change on the world’s marine ecosystems. Science. 2010;328: 1523–1528. doi: 10.1126/science.1189930 - DOI - PubMed
-
- Hoegh-Guldberg O, Mumby PJ, Hooten AJ, Steneck RS, Greenfield P, Gomez E, et al. Coral reefs under rapid climate change and ocean acidification. Science. 2007;318: 1737–1742. doi: 10.1126/science.1152509 - DOI - PubMed
-
- Mayfield AB, Wang LH, Tang PC, Hsiao YY, Fan TY, Tsai CL, et al. Assessing the impacts of experimentally elevated temperature on the biological composition and molecular chaperone gene expression of a reef coral. PLoS ONE. 2011;e26529 doi: 10.1371/journal.pone.0026529 - DOI - PMC - PubMed
-
- Brown BE. Coral bleaching: causes and consequences. Coral Reefs. 1997;16: s129–s138.
-
- Putnam HM, Edmunds PJ. The physiological response of reef corals to diel fluctuations in seawater temperature. J Exp Mar Biol Ecol. 2011;396: 216–223.
Publication types
MeSH terms
LinkOut - more resources
Full Text Sources
Other Literature Sources
