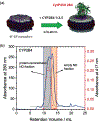
Cytochrome-P450-Induced Ordering of Microsomal Membranes Modulates Affinity for Drugs
- PMID: 29385304
- PMCID: PMC6289274
- DOI: 10.1002/anie.201713167
Cytochrome-P450-Induced Ordering of Microsomal Membranes Modulates Affinity for Drugs
Abstract
Although membrane environment is known to boost drug metabolism by mammalian cytochrome P450s, the factors that stabilize the structural folding and enhance protein function are unclear. In this study, we use peptide-based lipid nanodiscs to "trap" the lipid boundaries of microsomal cytochrome P450 2B4. We report the first evidence that CYP2B4 is able to induce the formation of raft domains in a biomimetic compound of the endoplasmic reticulum. NMR experiments were used to identify and quantitatively determine the lipids present in nanodiscs. A combination of biophysical experiments and molecular dynamics simulations revealed a sphingomyelin binding region in CYP2B4. The protein-induced lipid raft formation increased the thermal stability of P450 and dramatically altered ligand binding kinetics of the hydrophilic ligand BHT. These results unveil membrane/protein dynamics that contribute to the delicate mechanism of redox catalysis in lipid membrane.
Keywords: biophysics; hemeproteins; lipids; membranes; nanodiscs.
© 2018 Wiley-VCH Verlag GmbH & Co. KGaA, Weinheim.
Figures


Similar articles
-
Picturing the Membrane-assisted Choreography of Cytochrome P450 with Lipid Nanodiscs.Chemphyschem. 2018 Oct 19;19(20):2603-2613. doi: 10.1002/cphc.201800444. Epub 2018 Jul 31. Chemphyschem. 2018. PMID: 29995333 Review.
-
Expression, purification, and functional reconstitution of 19F-labeled cytochrome b5 in peptide nanodiscs for NMR studies.Biochim Biophys Acta Biomembr. 2020 May 1;1862(5):183194. doi: 10.1016/j.bbamem.2020.183194. Epub 2020 Jan 15. Biochim Biophys Acta Biomembr. 2020. PMID: 31953231 Free PMC article.
-
Inactivation of ethanol-inducible cytochrome P450 and other microsomal P450 isozymes by trans-4-hydroxy-2-nonenal, a major product of membrane lipid peroxidation.Proc Natl Acad Sci U S A. 1995 Apr 25;92(9):3764-8. doi: 10.1073/pnas.92.9.3764. Proc Natl Acad Sci U S A. 1995. PMID: 7731980 Free PMC article.
-
The Effect of Force-Field Parameters on Cytochrome P450-Membrane Interactions: Structure and Dynamics.Sci Rep. 2020 Apr 29;10(1):7284. doi: 10.1038/s41598-020-64129-7. Sci Rep. 2020. PMID: 32350331 Free PMC article.
-
Functional regulation of hepatic cytochrome p450 enzymes by physicochemical properties of phospholipids in biological membranes.Curr Protein Pept Sci. 2007 Oct;8(5):496-505. doi: 10.2174/138920307782411392. Curr Protein Pept Sci. 2007. PMID: 17979764 Review.
Cited by
-
Homotropic Cooperativity of Midazolam Metabolism by Cytochrome P450 3A4: Insight from Computational Studies.J Chem Inf Model. 2021 May 24;61(5):2418-2426. doi: 10.1021/acs.jcim.1c00266. Epub 2021 Apr 22. J Chem Inf Model. 2021. PMID: 33884878 Free PMC article.
-
The "outsized" role of the I-helix kink in human Cytochrome P450s.Clin Transl Med. 2023 Sep;13(9):e1378. doi: 10.1002/ctm2.1378. Clin Transl Med. 2023. PMID: 37712170 Free PMC article. No abstract available.
-
A Minimal Functional Complex of Cytochrome P450 and FBD of Cytochrome P450 Reductase in Nanodiscs.Angew Chem Int Ed Engl. 2018 Jul 9;57(28):8458-8462. doi: 10.1002/anie.201802210. Epub 2018 Jun 14. Angew Chem Int Ed Engl. 2018. PMID: 29722926 Free PMC article.
-
Polymer nanodiscs: Advantages and limitations.Chem Phys Lipids. 2019 Mar;219:45-49. doi: 10.1016/j.chemphyslip.2019.01.010. Epub 2019 Jan 29. Chem Phys Lipids. 2019. PMID: 30707909 Free PMC article. Review.
-
Lipid-polymer nanoparticles to probe the native-like environment of intramembrane rhomboid protease GlpG and its activity.Nat Commun. 2024 Aug 30;15(1):7533. doi: 10.1038/s41467-024-51989-0. Nat Commun. 2024. PMID: 39215029 Free PMC article.
References
-
- Saliba AE, Vonkova I, Gavin AC, Nat Rev Mol Cell Biol 2015, 16, 753–761. - PubMed
-
- Wymann MP, Schneiter R, Nat Rev Mol Cell Biol 2008, 9, 162–176. - PubMed
-
- De Montellano PRO, Cytochrome P450: structure, mechanism, and biochemistry, Springer, New York, 2005.
-
- Denisov IG, Makris TM, Sligar SG, Schlichting I, Chem Rev 2005, 105, 2253–2277. - PubMed
Publication types
MeSH terms
Substances
Grants and funding
LinkOut - more resources
Full Text Sources
Other Literature Sources

