. 2018 Feb 1;10(2):562-576.
doi: 10.1093/gbe/evy018.

Translational Selection for Speed Is Not Sufficient to Explain Variation in Bacterial Codon Usage Bias

Affiliations

Translational Selection for Speed Is Not Sufficient to Explain Variation in Bacterial Codon Usage Bias

Saurabh Mahajan et al. Genome Biol Evol. .

Abstract

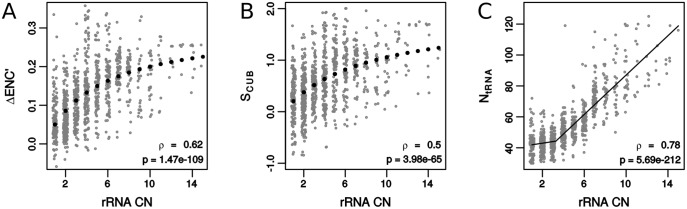
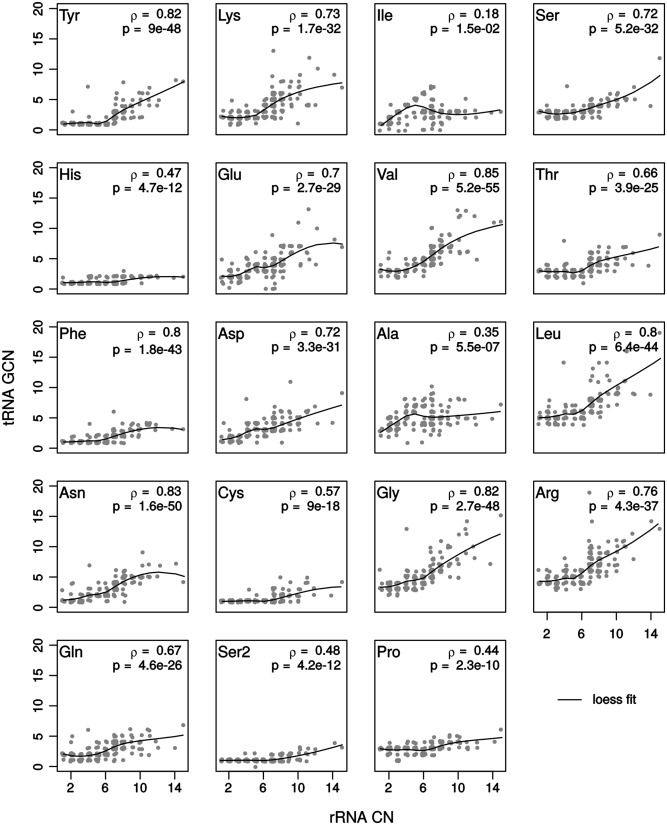
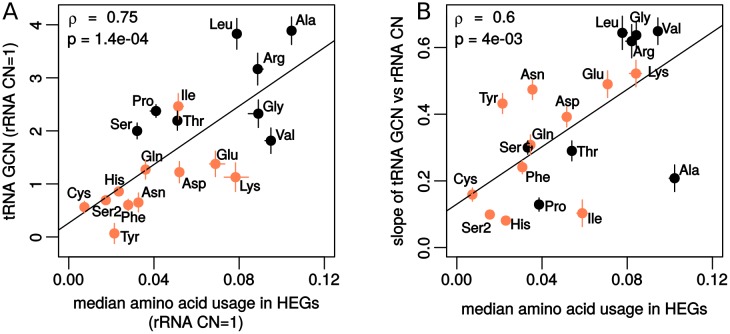
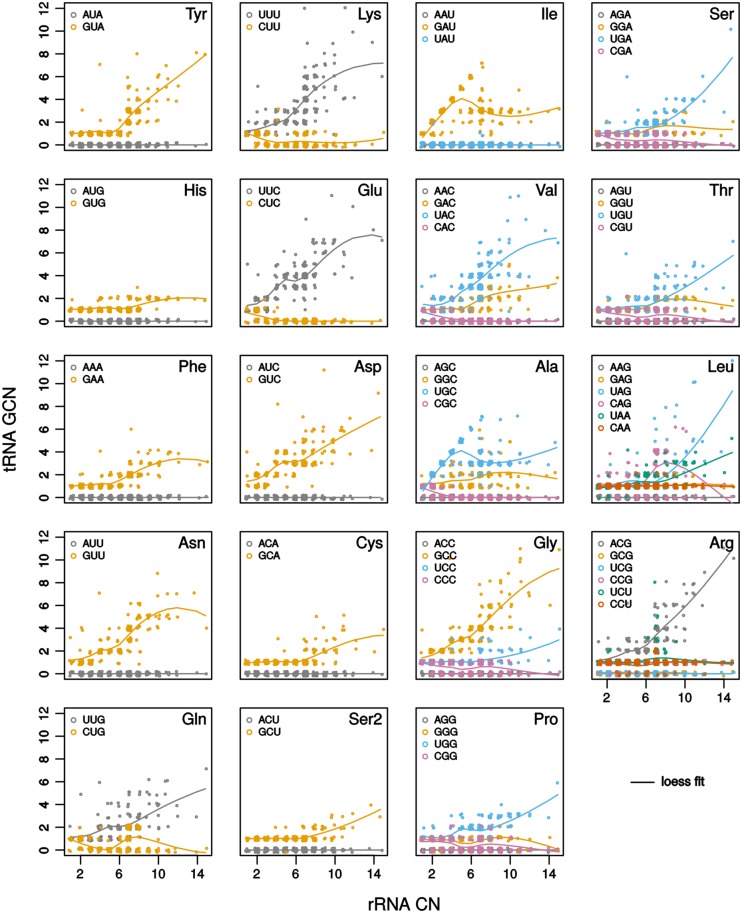
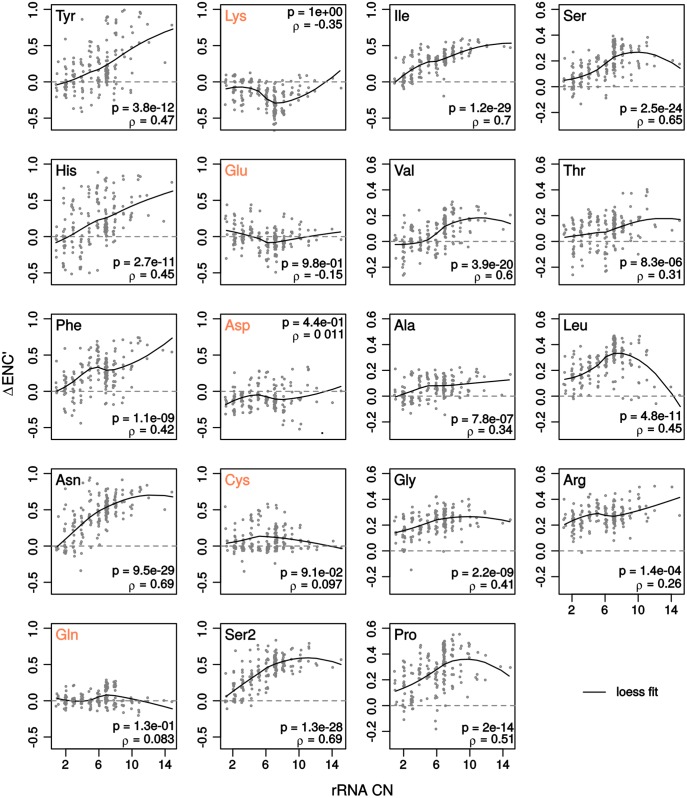
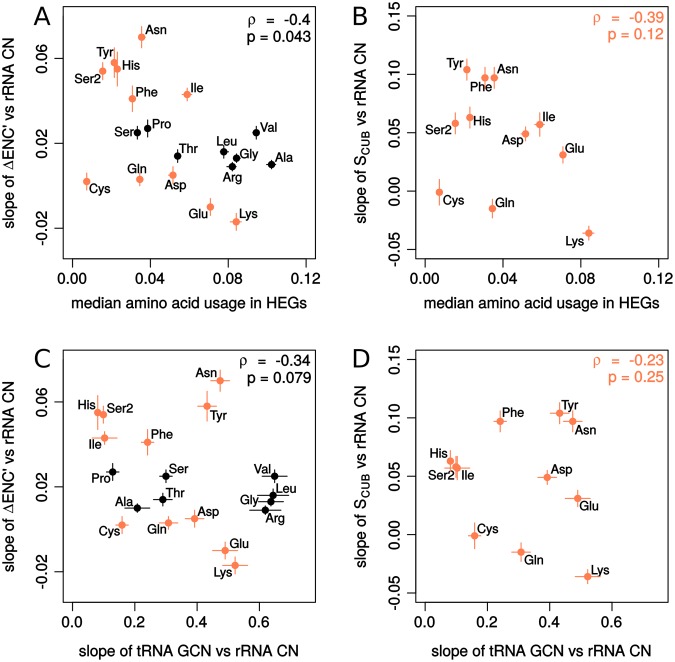
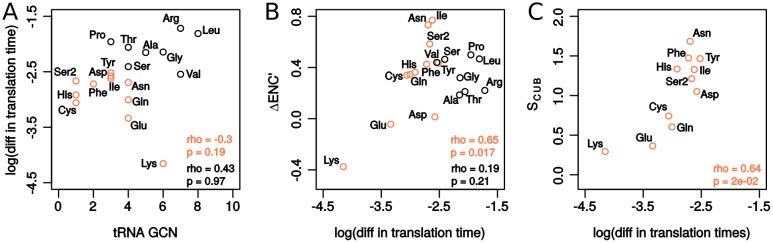
Increasing growth rate across bacteria strengthens selection for faster translation, concomitantly increasing the total number of tRNA genes and codon usage bias (CUB: enrichment of specific synonymous codons in highly expressed genes). Typically, enriched codons are translated by tRNAs with higher gene copy numbers (GCN). A model of tRNA-CUB coevolution based on fast growth-associated selection on translational speed recapitulates these patterns. A key untested implication of the coevolution model is that translational selection should favor higher tRNA GCN for more frequently used amino acids, potentially weakening the effect of growth-associated selection on CUB. Surprisingly, we find that CUB saturates with increasing growth rate across γ-proteobacteria, even as the number of tRNA genes continues to increase. As predicted, amino acid-specific tRNA GCN is positively correlated with the usage of corresponding amino acids, but there is no correlation between growth rate associated changes in CUB and amino acid usage. Instead, we find that some amino acids-cysteine and those in the NNA/G codon family-show weak CUB that does not increase with growth rate, despite large variation in the corresponding tRNA GCN. We suggest that amino acid-specific variation in CUB is not explained by tRNA GCN because GCN does not influence the difference between translation times of synonymous codons as expected. Thus, selection on translational speed alone cannot fully explain quantitative variation in overall or amino acid-specific CUB, suggesting a significant role for other functional constraints and amino acid-specific codon features.

Keywords: amino acid usage; effective number of codons; growth rate; rRNA copy number; tRNA gene copy number.


Figures

<sc>Fig</sc>. 1.
Fig. 1.
—Correlations between codon usage bias (CUB), total tRNA gene copies (NtRNA), and rRNA copy numbers (rRNA CN), across bacterial genomes. CUB was measured either as ΔENC′, the normalized difference in effective number of codons between highly expressed and other genes; or as SCUB, a selection coefficient derived from a population genetics model. (A) ΔENC′ versus rRNA CN. (B) SCUB versus rRNA CN. The fitted line represents a saturating model with three parameters. (C) NtRNA versus rRNA CN. Each data point represents one bacterial genome (n = 964). We added a small jitter to rRNA CN since numerous data points have the same rRNA CN. ρ values represent Spearman’s (nonparametric) correlation coefficients and P-values correspond to a one-way asymptotic permutation test for positive correlation. In panel C, lines represent piecewise linear models with two slopes. All fitted models were evaluated based on AIC differences reported in supplementary table S1, Supplementary Material online. Axes ranges were curtailed to magnify trends, causing up to eight data points to fall outside the axis range in each plot. Full data can be found in supplementary figure S1, Supplementary Material online.
<sc>Fig</sc>. 2.
Fig. 2.
—Relationship between amino acid specific tRNA gene copy number (tRNA GCN) and rRNA copy numbers (rRNA CN) in γ-proteobacteria. For all amino acids, tRNA GCN increased with rRNA CN. ρ represents the Spearman’s correlation coefficient and P-values correspond to a one-way asymptotic permutation test for positive correlation. Smoothened Loess fits are shown to highlight trends. Each data point represents one genome (n=189). Since multiple genomes have identical rRNA CN and tRNA GCN, we added a small jitter to both variables. As a result, the size of grey clusters approximates the number of genomes at the same xy values.
<sc>Fig</sc>. 3.
Fig. 3.
—Amino acid usage and tRNA gene copy number (tRNA GCN) in γ-proteobacteria. We calculated amino acid usage as the median value (across genomes) of the fraction of coding sites corresponding to a particular amino acid in highly expressed genes (HEGs). Predicted values of tRNA GCN at rRNA CN=1 represent tRNA GCN in the slowest growing bacteria. Slopes represent the increase in tRNA GCN per unit rRNA CN. (A) Median amino acid usage and predicted tRNA GCN when rRNA CN=1. (B) Median amino acid usage and slope of tRNA GCN versus rRNA CN. Red circles show data for 2- or 3-fold degenerate amino acids and black circles indicate 4- or 6-fold degenerate amino acids. ρ represents Spearman’s correlation coefficient and P-values correspond to one-way asymptotic permutation test for positive correlation. Vertical bars are standard errors from the linear regression fit, and horizontal bars are interquartile ranges for amino acid usage. In most cases, IQR is smaller than the width of the circles.
<sc>Fig</sc>. 4.
Fig. 4.
—Anticodon specific tRNA gene copy number (tRNA GCN) in γ-proteobacteria. GCN of tRNAs bearing each anticodon are plotted against rRNA copy numbers (rRNA CN) of 189 genomes. Amino acids are arranged column-wise in increasing order of degeneracy, and the anticodon identities appear in the legend at top left. For 2-fold degenerate amino acids, the GNN anticodons (orange) are prevalent in the NNU/C codon family; while the UNN anticodons (grey) are prevalent in the NNA/G codon family. For most 4-fold degenerate amino acids, the UNN anticodons (blue) are most prevalent, followed by the GNN anticodons (orange). Glycine (Gly) is an exception where the GNN anticodon (orange) prevails over UNN anticodons (blue). For Leucine (Leu), the CNN (magenta) or UNN (blue) anticodons are prevalent in different set of genomes. For Arginine (Arg), the ANN anticodon is prevalent over others. Since multiple genomes have identical rRNA CN and tRNA GCN, we added a small jitter to both variables. As a result, the size of clusters approximates the number of genomes at the same xy values. Smoothened Loess fits are shown to aid visualization.
<sc>Fig</sc>. 5.
Fig. 5.
—Correlations between amino acid specific codon usage bias (CUB) and rRNA copy numbers (rRNA CN) in γ-proteobacteria. CUB is represented by amino acid-specific ΔENC′, the normalized difference in effective number of codons between HEGs and all other genes. Red labels indicate amino acids with no positive correlation between ΔENC′ and rRNA CN. Each data point represents one genome (n=189). The dashed grey line indicates an absence of CUB. ρ is the Spearman’s correlation coefficient and P-values correspond to a one-way asymptotic permutation test for positive correlation. Smoothened Loess fits are shown to aid visualization. Y-axes were set to identical scales within 2- or 3-fold, and 4- or 6-fold degenerate amino acid sets, for ease of visual comparison.
<sc>Fig</sc>. 6.
Fig. 6.
—Association between the impact of growth rate on CUB and amino acid usage or tRNA GCN in γ-proteobacteria. Amino acid usage was calculated as the median values (across genomes) of the fraction of coding sites in HEGs that belong to a particular amino acid. The impact of growth rate on CUB is represented by the increase in ΔENC′ or SCUB per unit change in rRNA CN, estimated by fitting linear regression models. (A) Median amino acid usage and slope of ΔENC′ versus rRNA CN. (B) Median amino acid usage and slope of SCUB versus rRNA CN. (C) Slope of tRNA GCN versus rRNA CN and slope of ΔENC′ versus rRNA CN. (D) Slope of tRNA GCN versus rRNA CN and slope of SCUB versus rRNA CN. Red circles show data for 2- or 3-fold amino acids and black circles indicate 4- or 6-fold degenerate amino acids. ρ is the Spearman’s correlation coefficient and P-values correspond to a one-way asymptotic permutation test for a positive correlation. In panels A and B, horizontal bars are interquartile ranges of amino acid usage. Vertical bars in all plots are standard errors from the linear regression fits. In most cases IQR of amino acid usage is smaller than the width of the circles.
<sc>Fig</sc>. 7.
Fig. 7.
—Amino acid specific translation time differences, tRNA gene copy number (tRNA GCN) and codon usage bias (CUB) in E. coli. Mean typical translation time for each codon for E. coli was obtained from Dana and Tuller (2014), and the difference in translation times, that is, |maximum – minimum| of the codon set of each amino acid were calculated. CUB (ΔENC′ and SCUB) was calculated as previously described. SCUB could be calculated only for two-box amino acids. (A) Difference in translation time and tRNA GCN. (B) ΔENC′ and difference in translation times. (C) SCUB and difference in translation times. Red circles indicate 2- or 3-fold and black circles 4- or 6-fold degenerate amino acids. ρ is Spearman’s correlation coefficient and P-values correspond to a one-way asymptotic permutation test for positive correlation. In the case of A and B correlations were also separately assessed for 2-fold degenerate amino acids, these are indicated in red text.

Similar articles

Cited by

References

    1. Agashe D, Martinez-Gomez NC, Drummond DA, Marx CJ.. 2013. Good codons, bad transcript: large reductions in gene expression and fitness arising from synonymous mutations in a key enzyme. Mol Biol Evol. 30(3):549–560. - PMC - PubMed
    1. Andersson SG, Kurland CG.. 1990. Codon preferences in free-living microorganisms. Microbiol Rev. 54(2):198–210. - PMC - PubMed
    1. Berg OG, Kurland CG.. 1997. Growth rate-optimised tRNA abundance and codon usage. J Mol Biol. 270(4):544–550. - PubMed
    1. Bonekamp F, Dalbøge H, Christensen T, Jensen KF.. 1989. Translation rates of individual codons are not correlated with tRNA abundances or with frequencies of utilization in Escherichia coli. J Bacteriol. 171(11):5812–5816. - PMC - PubMed
    1. Bremer H, Dennis PP.. 2008. Modulation of chemical composition and other parameters of the cell at different exponential growth rates. EcoSal Plus 3(1): . - PubMed

Publication types