. 2018 Apr 6;46(6):2820-2833.
doi: 10.1093/nar/gky028.

TelAP1 links telomere complexes with developmental expression site silencing in African trypanosomes

Affiliations

TelAP1 links telomere complexes with developmental expression site silencing in African trypanosomes

Helena Reis et al. Nucleic Acids Res. .

Abstract

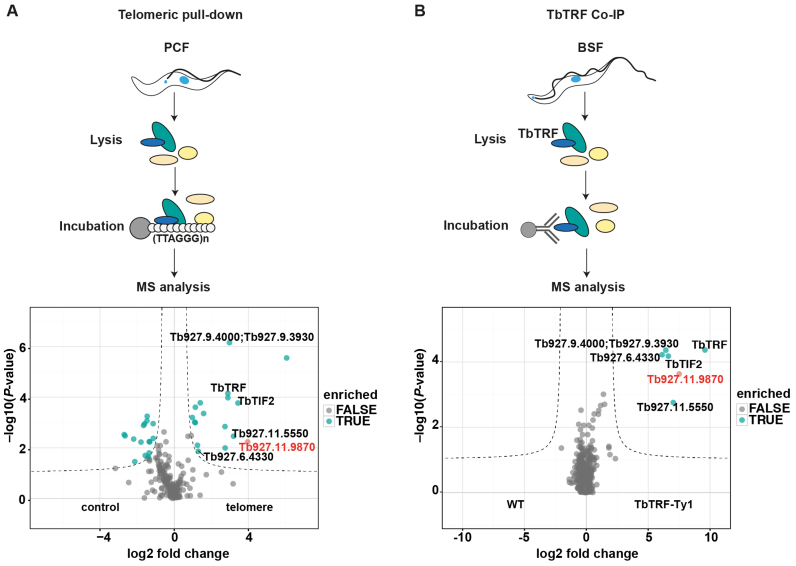
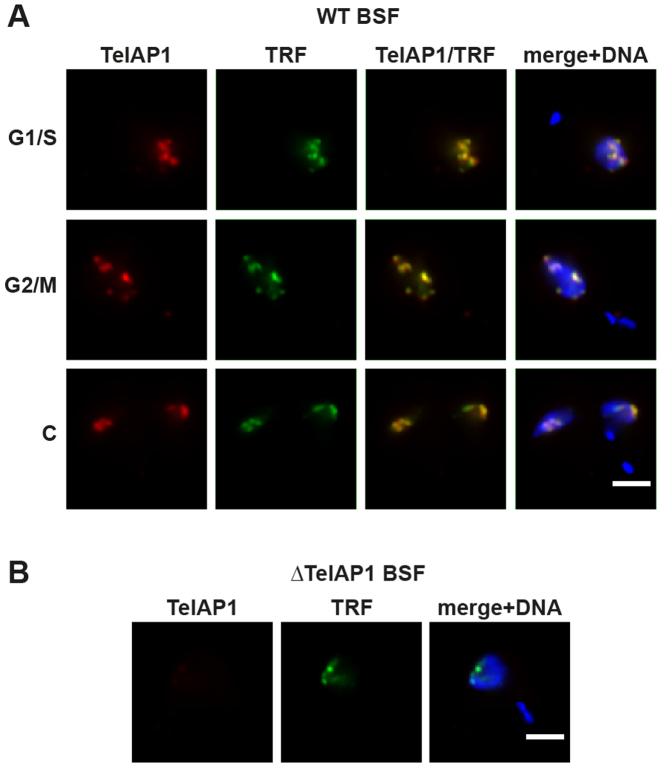
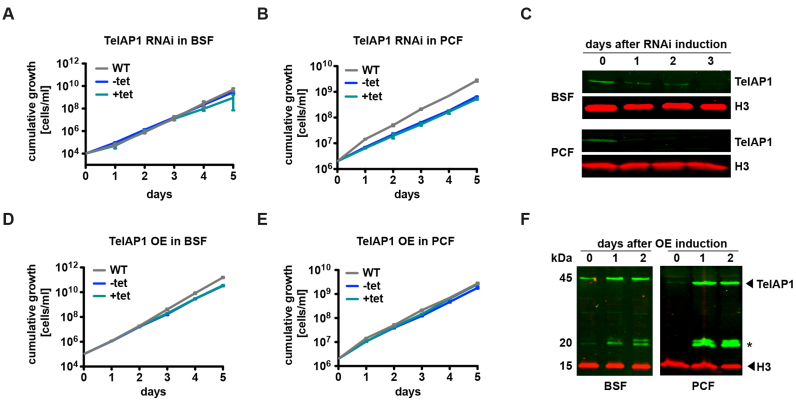
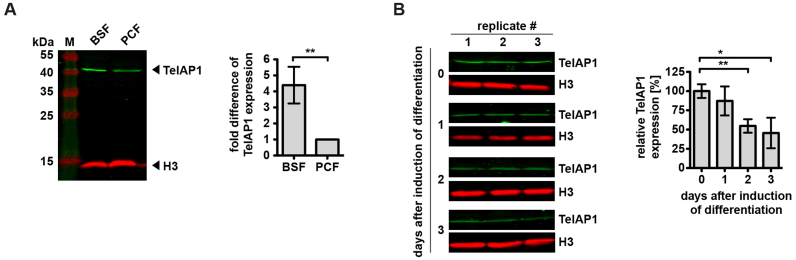
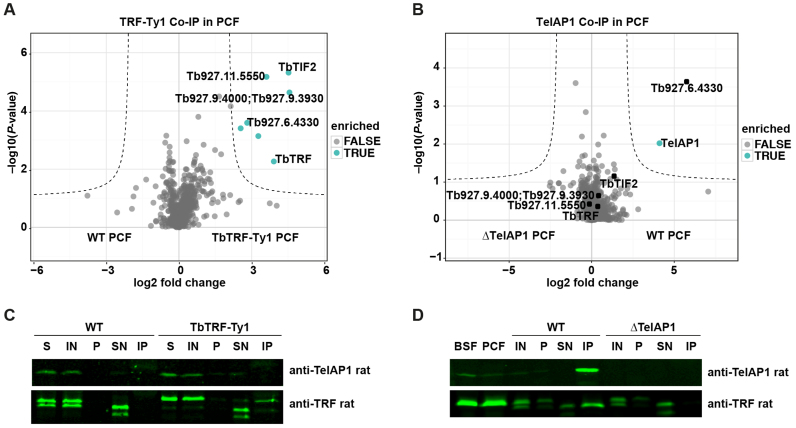
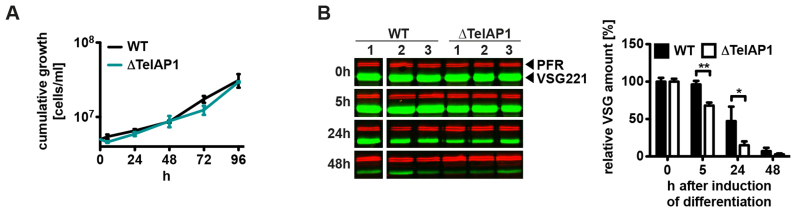
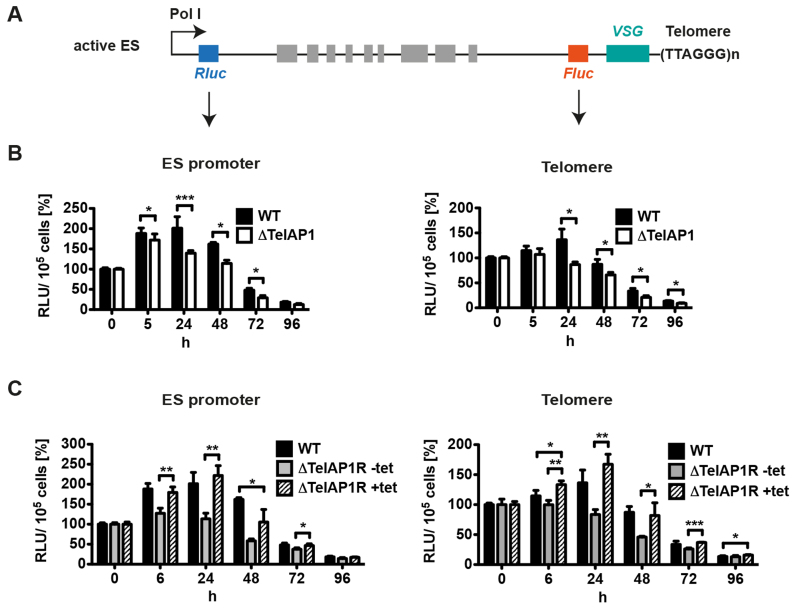
During its life cycle, Trypanosoma brucei shuttles between a mammalian host and the tsetse fly vector. In the mammalian host, immune evasion of T. brucei bloodstream form (BSF) cells relies on antigenic variation, which includes monoallelic expression and periodic switching of variant surface glycoprotein (VSG) genes. The active VSG is transcribed from only 1 of the 15 subtelomeric expression sites (ESs). During differentiation from BSF to the insect-resident procyclic form (PCF), the active ES is transcriptionally silenced. We used mass spectrometry-based interactomics to determine the composition of telomere protein complexes in T. brucei BSF and PCF stages to learn more about the structure and functions of telomeres in trypanosomes. Our data suggest a different telomere complex composition in the two forms of the parasite. One of the novel telomere-associated proteins, TelAP1, forms a complex with telomeric proteins TbTRF, TbRAP1 and TbTIF2 and influences ES silencing kinetics during developmental differentiation.


Figures

Figure 1.
Figure 1.
Label-free interactomics identifies novel telomere-binding proteins in Trypanosoma brucei. (A) Experiment design and volcano plot showing how telomeric DNA-binding proteins were identified. Quadruplicates of procyclic cell extracts were incubated either with telomeric TTAGGG-repeat or control TGTGAG-repeat oligonucleotides. Seventeen proteins were significantly enriched with telomeric DNA compared to control oligonucleotides. (B) Experiment design of the TbTRF Co-IP and resulting volcano plot showing TbTRF-Ty1 interacting proteins. In both plots only the overlapping candidates are shown (complete datasets are summarized in Supplementary Tables S1 and 2). Six telomeric proteins were identified in both the experiments: TbTIF2, TbTRF, Tb927.6.4330, Tb927.11.5550, Tb927.9.4000/3930 and Tb927.11.9870. The candidate Tb927.11.9870, which was selected for detailed analyses, is highlighted in red.
Figure 2.
Figure 2.
TelAP1 co-localizes with TbTRF in the nucleus of BSF cells. (A) Indirect immunofluorescence analysis (IFA) of BSF cells in different cell cycle stages as indicated using monoclonal antibodies specific for TelAP1 (red) and TbTRF (green). (B) Indirect IFA of ΔTelAP1 BSF cells confirmed the specificity of the TelAP1 signal. DNA was stained with Hoechst (blue). Scale bar 2 μm. S/G1 (synthesis/Gap1 phase), G2/M (Gap2 phase/mitosis), C (cytokinesis).
Figure 3.
Figure 3.
TelAP1 is a component of the telomere complex in Trypanosoma brucei. (A) Volcano plot showing interaction partners of TelAP1. Co-IP was performed in four independent experiments with WT and ΔTelAP1 cells. Precipitates were analyzed by MS. The x-axis shows the log2 fold change of detected proteins between WT and ΔTelAP1 cells. The y-axis represents the P-value. (B) Western blot analysis of TelAP1 Co-IP confirmed interaction of TelAP1 and TbTRF. Twenty-fold more of the pellet and IP samples were loaded compared to IN and SN samples. About 13% of TbTRF input was co-precipitated with TelAP1. W (whole cell lysate), IN (input), P (pellet), SN (supernatant), IP (immunoprecipitate).
Figure 4.
Figure 4.
Cell viability of both life cycle stages is independent of TelAP1 protein expression levels. (A) Cumulative growth of WT, non-induced (−tet) and induced (+tet) TelAP1 RNAi BSF cell lines. (B) Cumulative growth of TelAP1-depleted PCF cells. (C) Western blot analysis confirmed TelAP1 depletion in BSF and PCF cells. Histone H3 was used as loading control. (D) Cumulative growth of BSF and (E) PCF cells after induction of ectopic TelAP1 overexpression. (F) Western blot analysis of TelAP1 overexpression. Two additional bands (asterisk) are detectable after overexpression. Histone H3 was used as loading control. All growth curves represent the cumulative mean cell number ± SD of three biological replicates of one clone.
Figure 5.
Figure 5.
TelAP1 expression is stage-specifically regulated. (A) Quantitative western blot analysis of TelAP1 expression in BSF and PCF cells revealed a 4-fold upregulation in BSF cells. A representative blot of four independent experiments and their quantification is shown. TelAP1 signal intensity was normalized to histone H3 protein. PCF expression level was set to 1. Error bars represent the standard deviation of four replicates. (B) Western blot analysis and its quantification of TelAP1 expression during differentiation from BSF to PCF. Three independent experiments were analyzed. TelAP1 signal intensity was normalized to Histone H3 protein. Error bars represent the standard deviation of three replicates. Statistical significance was determined by an unpaired t-test *P < 0.05, **P < 0.01.
Figure 6.
Figure 6.
TbTRF and TelAP1 Co-IPs in procyclic cells. Co-IPs were performed in four biological replicates and enriched proteins were analyzed by MS. (A) Volcano plot representing TbTRF interactions in PCF cells. Six proteins were significantly enriched with TbTRF-Ty1 including four proteins, which were also found in the BSF TbTRF-Ty1 Co-IP: TbTIF2, Tb927.11.5550, Tb927.9.4000/3930, Tb927.6.4330. The whole dataset is summarized in Supplementary Table S4. (B) Volcano plot showing TelAP1 interacting proteins in PCF cells. Besides TelAP1 the telomere-associated candidate Tb927.6.4330 was enriched. (C) Western blot analysis of TbTRF-Ty1 Co-IP with anti-TelAP1 and anti-TbTRF antibodies. TbTRF was proteolytically degraded during the IP experiment as additional shorter bands appeared, which were detected by the monoclonal TbTRF antibody. Nevertheless, Ty1 epitope-tagged TbTRF was precipitated. TbTRF-Ty1 migrates slower in the SDS-PAGE than the WT TbTRF. TelAP1 could not be detected in the eluate. Twenty-fold more of the IP sample was loaded compared to IN and SN samples. (D) Western blot analysis of TelAP1 Co-IP with anti-TbTRF antibody confirmed interaction of TelAP1 with TbTRF in PCF stage. Again, TbTRF showed signs of proteolytic degradation after cell lysis. A smaller TbTRF fragment was co-purified with TelAP1. BSF and PCF whole cell lysates served as control and showed only one TbTRF product. Twenty-fold more of the pellet and IP sample were loaded compared to IN and SN samples. About 5% of TbTRF input was co-purified with TelAP1. S (starting material after lysis), IN (input), P (pellet), SN (supernatant), IP (immunoprecipitate).
Figure 7.
Figure 7.
VSG silencing during differentiation from BSF to PCF is faster in ΔTelAP1 cells. (A) Cumulative growth of WT and ΔTelAP1 cells during differentiation. The graph shows the cumulative mean cell number and standard deviation (n = 3). (B) Western blot and its quantitative analysis of VSG221 expression in WT and ΔTelAP1 cells during differentiation. The experiment was performed in triplicates. VSG221 levels were normalized to PFR protein expression. Time point 0 h was set as 100%. Error bars represent the standard deviation of three biological replicates. Statistical significance was determined by an unpaired t-test *P < 0.05, **P < 0.01.
Figure 8.
Figure 8.
Dual luciferase reporter reveals faster silencing kinetics during differentiation in ΔTelAP1 cells. (A) Illustration of the dual luciferase reporter. The active ES of WT and ΔTelAP1 cells was doubly marked with an Rluc reporter gene downstream of the ES promoter and an Fluc reporter gene upstream of VSG gene. Graphic is not to scale. (B) Analysis of luciferase activity at the ES promoter (Pol I) and at the telomere during differentiation of WT and ΔTelAP1 reporter cell lines. Differentiation of reporter cell lines (n = 3) was induced and luciferase activity was measured at the time points indicated. Luciferase activity is shown as relative light units (RLU) and standard deviation. Time point 0 h was set as 100%. (C) Reintroduction of TelAP1 in ΔTelAP1 reporter cell line slows down ES silencing kinetics during differentiation. Analysis of luciferase activity at the ES promoter and at the telomere during differentiation of ΔTelAP1R reporter cells with and without tetracycline induction. One clone was analyzed in triplicates. WT values of the experiment shown in B were included into the graphs for better comparison. Reintroduction of TelAP1 leads to ES silencing kinetics similar to WT cells. Statistical significance was determined by an unpaired t-test *P < 0.05, **P < 0.01, ***P < 0.001.

Similar articles

Cited by

References

    1. Blackburn E.H. Structure and function of telomeres. Nature. 1991; 350:569–573. - PubMed
    1. Palm W., de Lange T.. How shelterin protects mammalian telomeres. Annu. Rev. Genet. 2008; 42:301–334. - PubMed
    1. Hockemeyer D., Collins K.. Control of telomerase action at human telomeres. Nat. Struct. Mol. Biol. 2015; 22:848–852. - PMC - PubMed
    1. Kappei D., Butter F., Benda C., Scheibe M., Draskovic I., Stevense M., Novo C.L., Basquin C., Araki M., Araki K. et al. . HOT1 is a mammalian direct telomere repeat-binding protein contributing to telomerase recruitment. EMBO J. 2013; 32:1681–1701. - PMC - PubMed
    1. Armstrong C.A., Tomita K.. Fundamental mechanisms of telomerase action in yeasts and mammals: understanding telomeres and telomerase in cancer cells. Open Biol. 2017; 7:160338. - PMC - PubMed

Publication types

MeSH terms

Substances

LinkOut - more resources