

Comparative Study
doi: 10.1093/jrr/rrx099.
Comparison of calculated beta- and gamma-ray doses after the Fukushima accident with data from single-grain luminescence retrospective dosimetry of quartz inclusions in a brick sample
Affiliations
- PMID: 29385528
- PMCID: PMC5967575
- DOI: 10.1093/jrr/rrx099
Item in Clipboard
Comparative Study
Comparison of calculated beta- and gamma-ray doses after the Fukushima accident with data from single-grain luminescence retrospective dosimetry of quartz inclusions in a brick sample
J Radiat Res.
.
Abstract
To estimate the beta- and gamma-ray doses in a brick sample taken from Odaka, Minami-Soma City, Fukushima Prefecture, Japan, a Monte Carlo calculation was performed with Particle and Heavy Ion Transport code System (PHITS) code. The calculated results were compared with data obtained by single-grain retrospective luminescence dosimetry of quartz inclusions in the brick sample. The calculated result agreed well with the measured data. The dose increase measured at the brick surface was explained by the beta-ray contribution, and the slight slope in the dose profile deeper in the brick was due to the gamma-ray contribution. The skin dose was estimated from the calculated result as 164 mGy over 3 years at the sampling site.
Figures

(a) Mirror condition calculation, (b) top view and (c) side view of the calculation geometry.
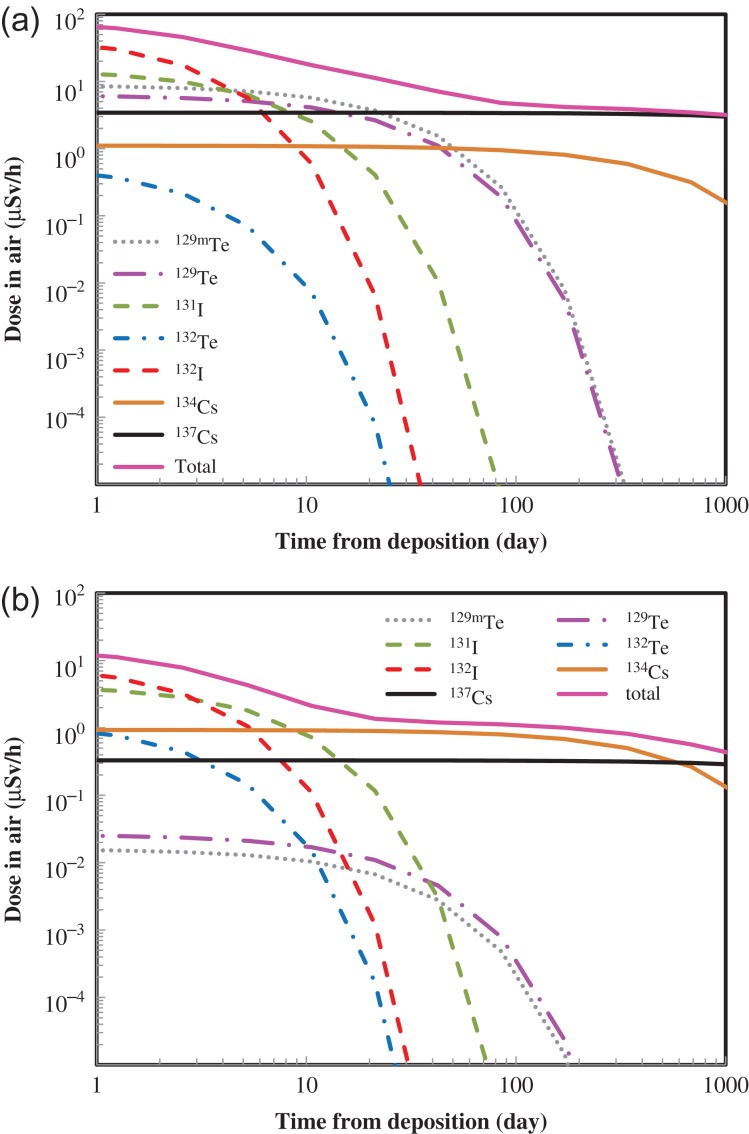
Air dose rates of (a) beta rays and (b) gamma rays over time.

Comparison of the calculated beta rays (chain line), gamma rays (dotted line), beta + gamma rays (solid line), dose averaged over sample depth (dashed histogram), and data measured by Stepanenko et al. (open circles).
Similar articles
-
Limits of thermoluminescence dosimetry using quartz extracted from recent building materials in urban settlements.J Environ Radioact. 2006;86(3):319-36. doi: 10.1016/j.jenvrad.2005.10.001. Epub 2005 Dec 2. J Environ Radioact. 2006. PMID: 16325970
-
Dose Deposition Profiles in Untreated Brick Material.Health Phys. 2018 Apr;114(4):414-420. doi: 10.1097/HP.0000000000000843. Health Phys. 2018. PMID: 29481532
-
Retrospective dosimetry using unheated quartz: a feasibility study.Radiat Prot Dosimetry. 2002;101(1-4):345-8. doi: 10.1093/oxfordjournals.rpd.a005998. Radiat Prot Dosimetry. 2002. PMID: 12382764
-
Optically stimulated luminescence in retrospective dosimetry.Radiat Prot Dosimetry. 2002;101(1-4):309-14. doi: 10.1093/oxfordjournals.rpd.a005992. Radiat Prot Dosimetry. 2002. PMID: 12382758
-
The Japan Environment and Children's Study (JECS) in Fukushima Prefecture-A progress report on the enrollment stage.Fukushima J Med Sci. 2017 Aug 9;63(2):57-63. doi: 10.5387/fms.2016-17. Epub 2017 Jul 5. Fukushima J Med Sci. 2017. PMID: 28680007 Free PMC article. Review.
Cited by
-
Estimation of 'dose-depth' profile in the surface layers of a quartz-containing tile from the former Hiroshima University building indicates the possible presence of beta-irradiation from residual radioactivity after A-bombing.J Radiat Res. 2022 Aug 13;63(Supplement_1):i54-i60. doi: 10.1093/jrr/rrac029. J Radiat Res. 2022. PMID: 35968988 Free PMC article.
-
Internal exposure rate conversion coefficients and absorbed fractions of mouse for 137Cs, 134Cs and 90Sr contamination in body.J Radiat Res. 2020 Jul 6;61(4):535-545. doi: 10.1093/jrr/rraa030. J Radiat Res. 2020. PMID: 32500146 Free PMC article.
References
-
- Endo S, Kimura S, Takatsuji T et al. . Measurement of soil contamination by radionuclides due to Fukushima Daiichi Nuclear Power Plant accident and associated cumulative external dose estimation. J Environ Radioact 2012;111:18–27. - PubMed
-
- Imanaka T, Endo S, Sugai M et al. . Early radiation survey of the Iitate Village heavily contaminated by the Fukushima Daiichi accident, conducted on 28 and 29 March 2011. Health Phys 2012;102:680–6. - PubMed
-
- Endo S, Kajimoto T, Shizuma K. Paddy-field contamination with 134Cs and 137Cs due to Fukushima Dai-ichi Nuclear Power Plant accident and soil-to-rice transfer coefficients. Eviron Radioact 2013;116:59–64. - PubMed
-
- Yamamoto M, Takada T, Nagao S et al. . Early survey of radioactive contamination in soil due to the Fukushima Dai-ichi Nuclear Power Plant accident: with emphasis on Pu analysis. Geochem J 2012;46:341–53.
Publication types
MeSH terms
Substances
LinkOut - more resources
Full Text Sources
Other Literature Sources
