. 2018 Apr 20;46(7):3671-3691.
doi: 10.1093/nar/gky032.

Integrative transcriptome sequencing reveals extensive alternative trans-splicing and cis-backsplicing in human cells

Affiliations

Integrative transcriptome sequencing reveals extensive alternative trans-splicing and cis-backsplicing in human cells

Trees-Juen Chuang et al. Nucleic Acids Res. .

Abstract

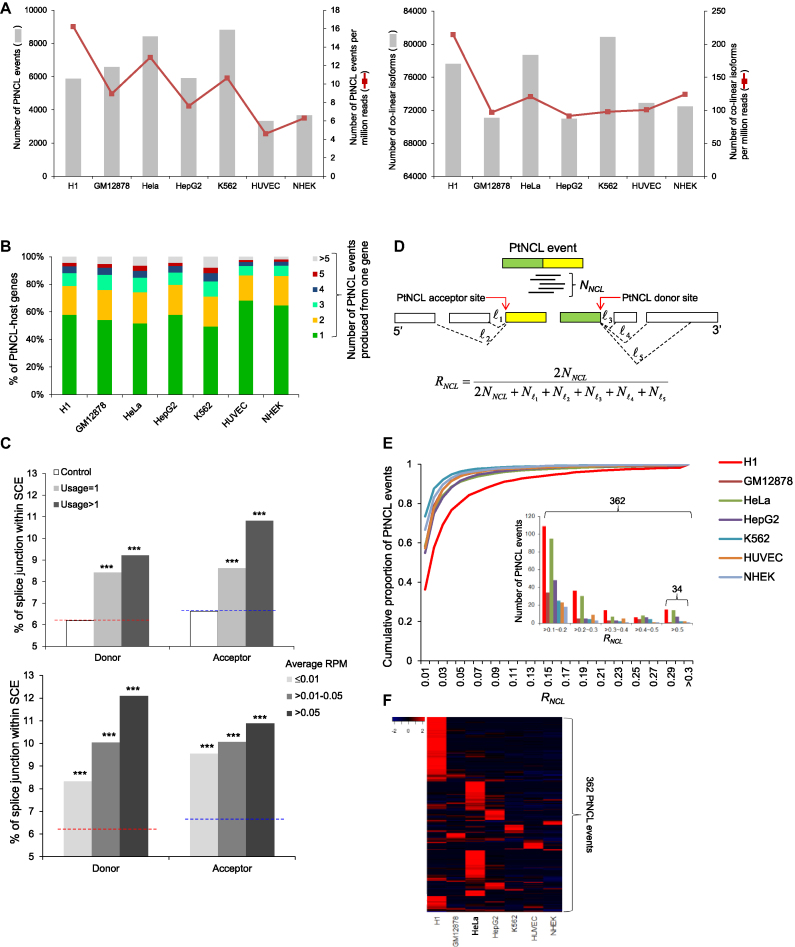
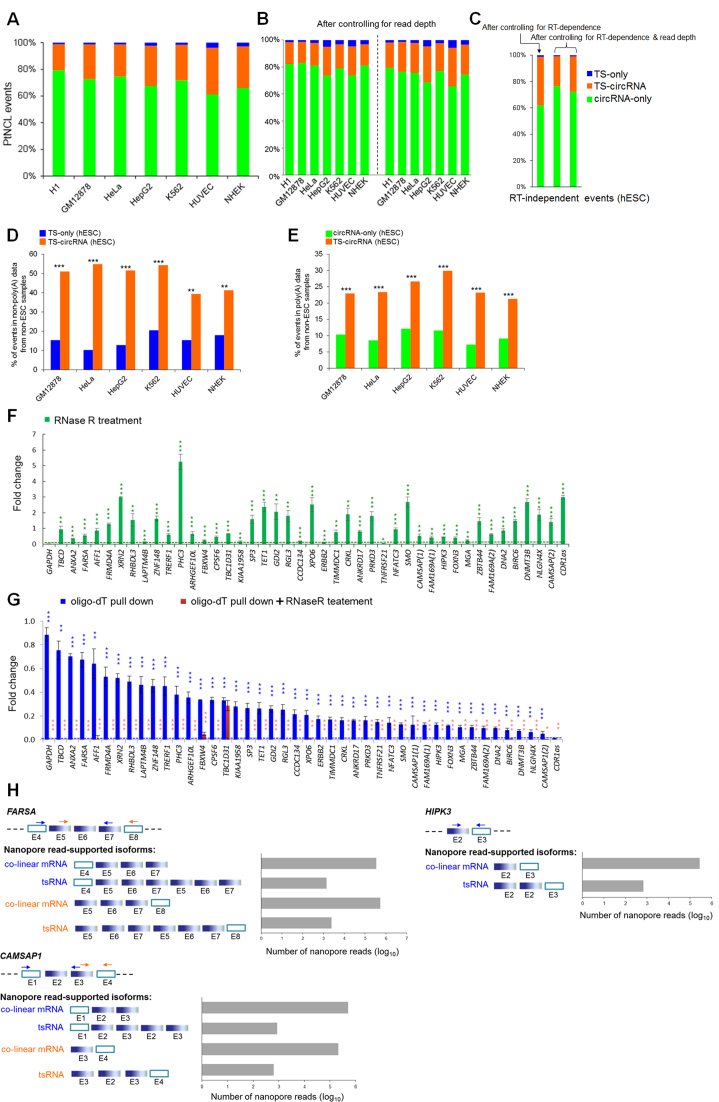
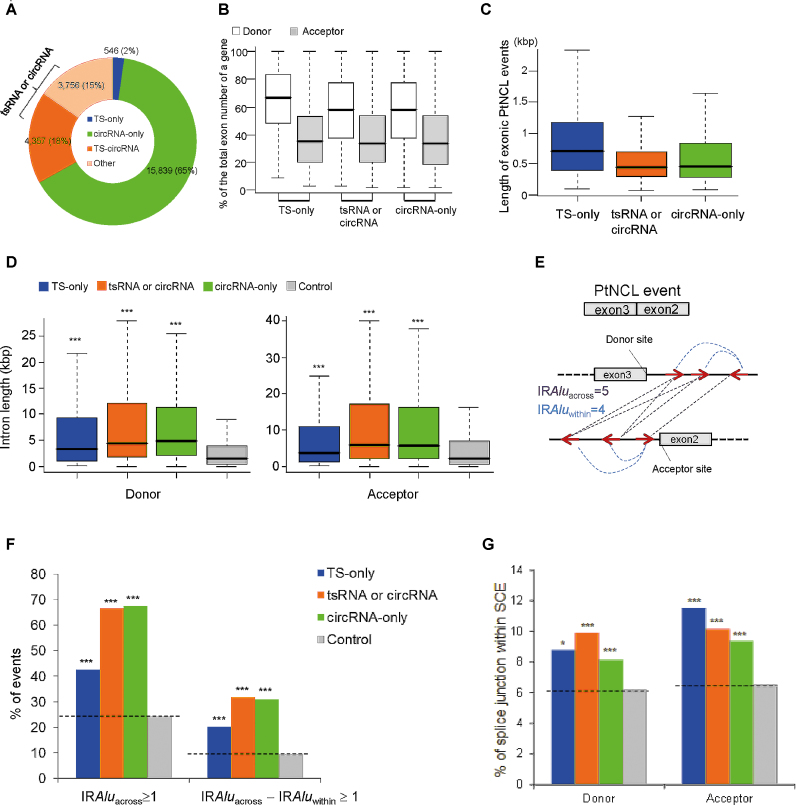
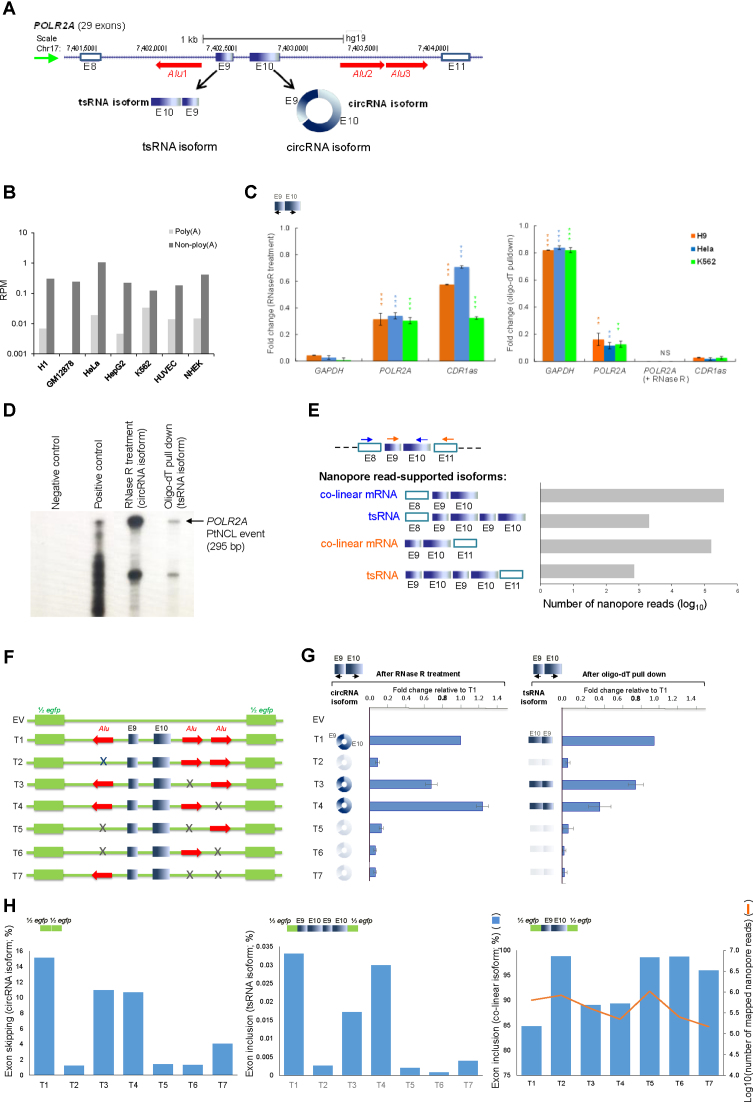
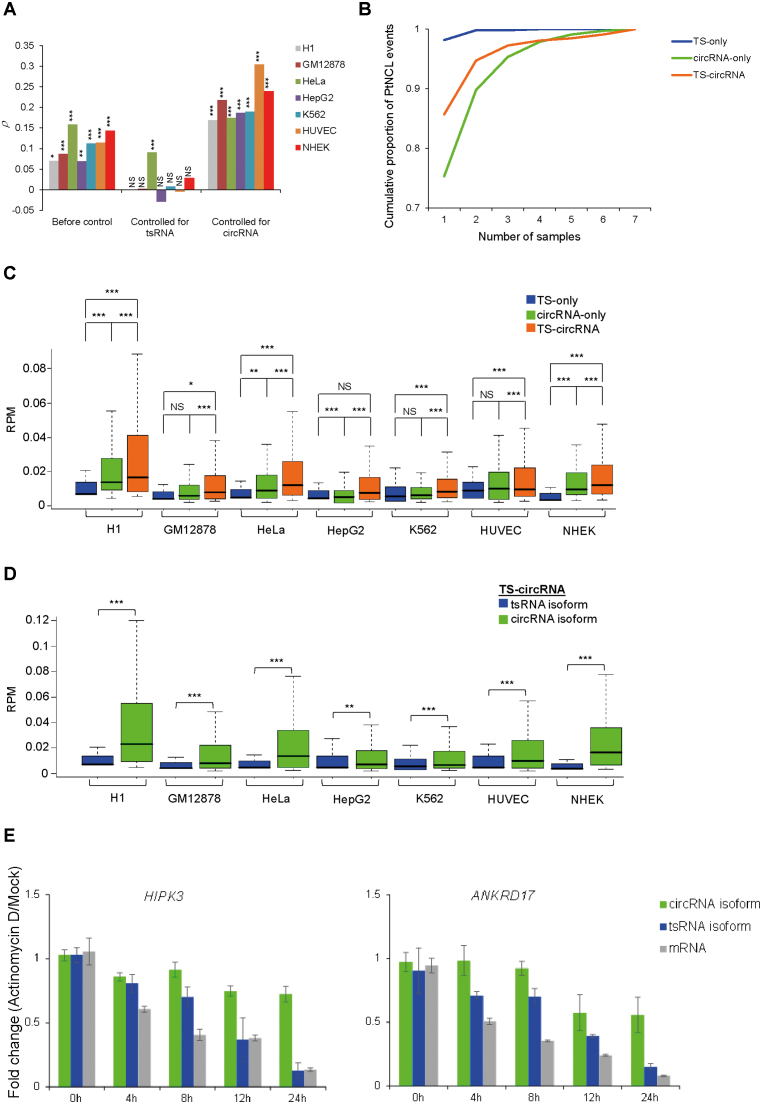
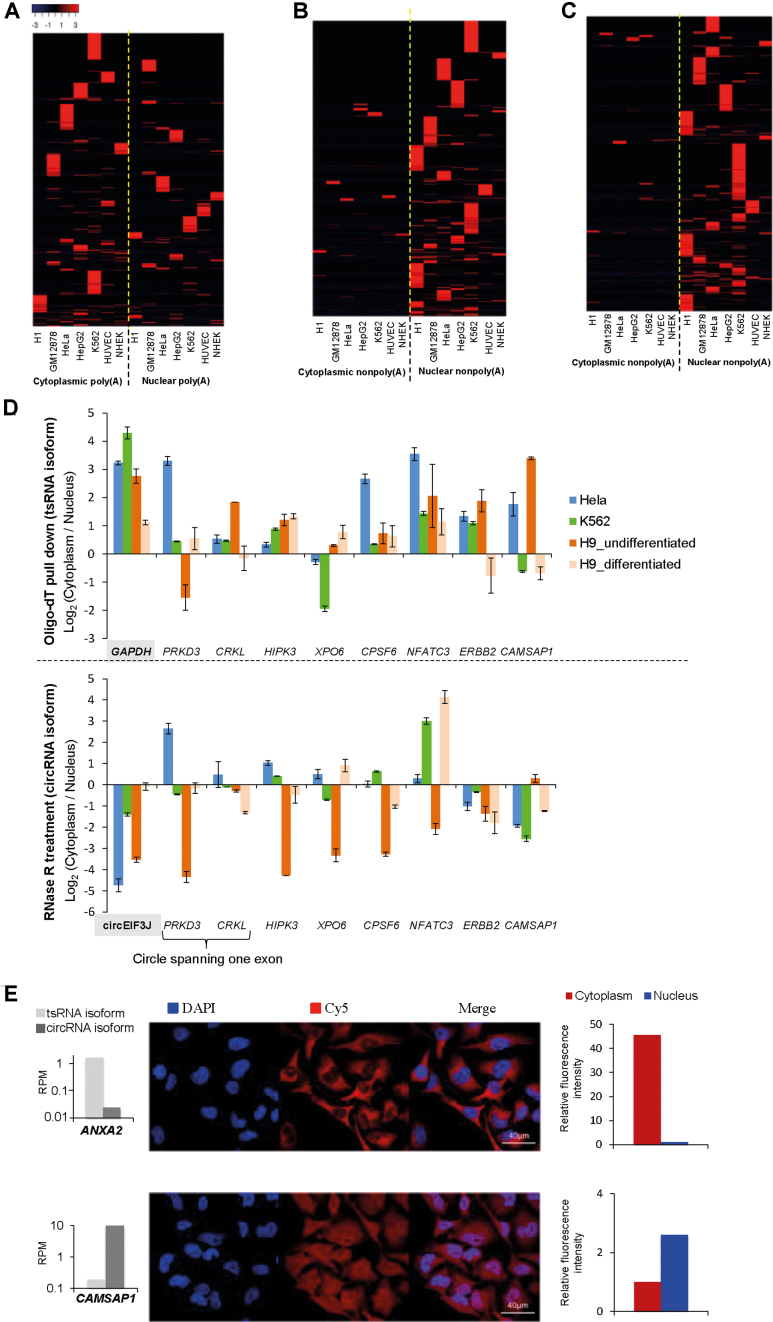
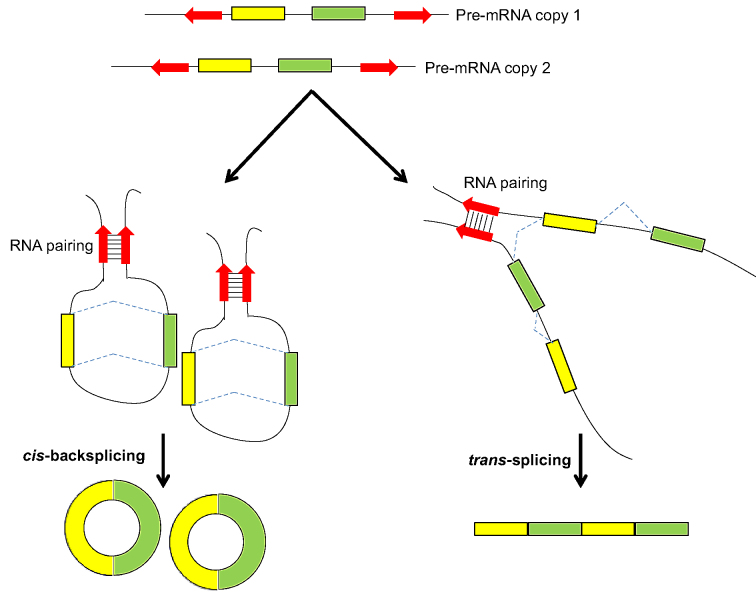
Transcriptionally non-co-linear (NCL) transcripts can originate from trans-splicing (trans-spliced RNA; 'tsRNA') or cis-backsplicing (circular RNA; 'circRNA'). While numerous circRNAs have been detected in various species, tsRNAs remain largely uninvestigated. Here, we utilize integrative transcriptome sequencing of poly(A)- and non-poly(A)-selected RNA-seq data from diverse human cell lines to distinguish between tsRNAs and circRNAs. We identified 24,498 NCL events and found that a considerable proportion (20-35%) of them arise from both tsRNAs and circRNAs, representing extensive alternative trans-splicing and cis-backsplicing in human cells. We show that sequence generalities of exon circularization are also observed in tsRNAs. Recapitulation of NCL RNAs further shows that inverted Alu repeats can simultaneously promote the formation of tsRNAs and circRNAs. However, tsRNAs and circRNAs exhibit quite different, or even opposite, expression patterns, in terms of correlation with the expression of their co-linear counterparts, expression breadth/abundance, transcript stability, and subcellular localization preference. These results indicate that tsRNAs and circRNAs may play different regulatory roles and analysis of NCL events should take the joint effects of different NCL-splicing types and joint effects of multiple NCL events into consideration. This study describes the first transcriptome-wide analysis of trans-splicing and cis-backsplicing, expanding our understanding of the complexity of the human transcriptome.


Figures

Figure 1.
Figure 1.
Properties of the identified NCL events in the examined cell lines. (A) Comparisons of the numbers of identified NCL events (left) and expressed co-linear isoforms (right). (B) Distribution of the number of NCL events produced from one gene. (C) Comparison of the percentages of NCL and non-NCL donor/acceptor splice sites located within SCEs in terms of the usage of NCL junction sites (top) and the average RPM of the NCL events detected in diverse cell lines (bottom). The control non-NCL donor and acceptor splice sites (10 000 donor and 10 000 acceptor sites) were randomly selected from the NCL-host genes. The red and blue dashed lines represent the percentages of control non-NCL donor and acceptor splice sites within SCEs, respectively. The statistical significance was evaluated using the two-tailed Fisher’s exact test. ***P < 0.001. (D) Schematic illustration of the methodology to estimate the no-co-linear ratio (RNCL) according to the number of reads spanning the NCL junction (NNCL) and that spanning the co-linearly spliced junctions (formula image) at both NCL donor and acceptor sites. (E) The cumulative distribution of NCL events plotted against RNCL. We only considered the NCL events that were located within non-single-exon genes and supported by NNCL≥3. The inset panel represented the number of highly expressed NCL events with RNCL>0.1. Of note, the NCL events were more highly expressed than their corresponding co-linear isoforms if RNCL>0.5. (F) Heatmap representation of expression patterns of highly abundant NCL events (with RNCL>0.1 in at least one cell line; 362 events). The numerical data represent log10-transformed RNCL.
Figure 2.
Figure 2.
Different types of NCL events. (AC) Distribution of three types of NCL events: TS-only, circRNA-only and TS-circRNA events before (A) and after (B and C) controlling for read depth/RT-dependence. For (B and C), read depth was normalized by randomly selecting an equal number (60 million, left; 120 million, right) of reads from both poly(A)- and non-poly(A)-selected data for the examined cell lines (Supplementary Tables S2 and 3). For (C), the RT-independent NCL events, which were supported by both AMV- and MMLV-based reads, were considered only (see the text). (D) Comparisons of percentages of tsRNA-involved events (i.e. TS-only and TS-circRNA events) that were detected in both poly(A)-selected data from hESCs and non-poly(A)-selected data from non-ESC samples. (E) Comparison of percentages of circRNA-involved events (i.e. circRNA-only and TS-circRNA events) that were detected in both non-poly(A)-selected data from hESCs and poly(A)-selected data from non-ESC samples. (F) qRT-PCR analyses of the expression fold changes for the selected 42 TS-circRNA events and two controls, GAPDH (which is poly(A)-tailed and must be degraded by RNase R treatment) and CDR1as (which is RNase R-resistant and must be non-polyadenylated) (1,5,6), before and after RNase R treatment in H9 hESCs. (G) Comparisons of expression fold changes for the selected 40 TS-circRNA events in poly(A)-tailed RNAs (oligo-dT pull down) and poly(A)-tailed RNAs treated with RNase R in H9 hESCs. The green (F) and blue (G) asterisks represent statistical significances of expression fold changes between the selected events and the controls (GAPDH for (F), green dashed lines; CDR1as for (G), blue dashed line). For (G), the red asterisks represent statistical significances of expression fold changes between the poly(A)-tailed RNAs and the poly(A)-tailed RNAs treated with RNase R. qRT-PCR experiments were performed in triplicate and repeated twice. Error bars represent the mean values ± one standard deviation. The statistical significance was evaluated using the two-tailed Fisher’s exact test (D and E) and the two-tailed t-test (F and G), respectively. *P < 0.05, **P < 0.01 and ***P < 0.001. (H) Detection of expanded length of tsRNAs by nanopore long reads. Blue and orange arrows indicate two different pairs of primers of the three examined TS-circRNA events, FARSA, HIPK3 and CAMSAP1. Empty rectangles represent the exons located outside the predicted circles of exonic circRNAs (the blue solid rectangles). E, exon.
Figure 3.
Figure 3.
Sequence generalities of formation for different types of NCL events (see also Supplementary Table S5). (A) Distribution of TS-only events, circRNA-only events, TS-circRNA events and the events with dynamic NCL-splicing types across cell lines for the identified 24 899 NCL events. For simplicity, we integrated the last two groups of events for the analysis in (BG). (B–D) Comparisons of distribution of genic position of exons (B), length of exonic NCL events (C), and length distribution of flanking introns at the donor (left) and acceptor sides (right) for the three types of NCL events (D). The control introns (10 000 introns, which do not overlap the flanking introns of the NCL events) were randomly selected from the NCL-host genes. The statistical significance in (D) was evaluated using the two-tailed Wilcoxon rank-sum test. ***P < 0.001. (E) Schematic illustration of a NCL event with five IRAluacross and four IRAluwithin pairs. (F) Comparisons of percentages of IRAluacross and (IRAluacross-IRAluwithin) ≥1 for the flanking introns of the three types of NCL events. (G) Comparisons of percentages of NCL junctions within SCEs for the three types of NCL events. The statistical significances in (F and G) were evaluated using the two-tailed Fisher’s exact test. *P < 0.05 and ***P < 0.001.
Figure 4.
Figure 4.
Recapitulation of the formation of tsRNA and circRNA isoforms with IRAlus across their flanking introns. (A) Visualization of one identified TS-circRNA event in the human POLR2A locus from the UCSC genome browser. Green and red arrows indicate the direction of POLR2A transcription and polarity of the three Alu elements in the flanking introns, respectively. (B) The RPM values of POLR2A tsRNA and circRNA isoforms (measured by poly(A)- and non-poly(A)-selected data from the seven examined cell lines). (C) qRT-PCR analyses (similar to Figure 2F and G) of the expression fold changes for the POLR2A TS-circRNA event before and after RNase R treatments (top) and oligo-dT pull down and oligo-dT pull down with RNase R treatments (bottom). The statistical significance was evaluated using the two-tailed t-test. **P < 0.01 and ***P < 0.001. NS, no signal. (D) RTase-free validation of the tsRNA and circRNA isoforms for POLR2A TS-circRNA event by RPA. Total RNA from HeLa was treated by polyA pull-down (tsRNA isoform) and RNase R (circRNA isoform), respectively. RPA was performed by hybridizing 32P labeled RNA probe in excess to total RNA from HeLa or in vitro transcript containing chimeric junction (size standard). Negative control: probe only. Positive control: the probe hybridized with 100 ng synthesized complementary strand. The arrow indicates the size (295 bp) of the fully protected fragments. The lower band shown in the figure is partially protected probe. (E) Detection of expanded length of POLR2A tsRNA isoform by nanopore long reads. Of note, this sequencing is of the endogenous locus. Blue and orange arrows indicate two different pairs of primers of POLR2A TS-circRNA event. Empty rectangles (E8 and E11) represent the exons located outside the predicted circles of exonic circRNAs (the blue solid rectangles, i.e. E9 and E10). E, exon. (F) Schematic diagrams of egfp expression vectors with various genomic sequences for POLR2A NCL (T1–T7) (41). T1 represents the genomic region for POLR2A NCL RNA (i.e. exons 9 and 10) with its wild-type flanking introns; T2-T7 represent a series of Alu deletions (gray crosses) inserted into the pZW1 expression vector. The green solid rectangles indicate half egfp sequences from the expression vector backbone. EV, empty vector. (G) qRT-PCR analysis of expression fold changes relative to T1 circRNA expression (with RNase R treatment, left) and T1 tsRNA expression (with oligo-dT pull down, right). The expression levels of T1-T7 circRNAs (or tsRNAs) were normalized by egfp expression before RNase R treatments (or oligo-dT pull down). qRT-PCR experiments were performed in triplicate and repeated twice. Error bars represent the mean values ± one standard deviation. Black arrows indicate the PCR primers for spliced RNAs. (H) Analysis of the recapitulated circRNA (exon skipping; the far left panel), tsRNA (including the transcript fragment of E9-E10-E9-E10; the middle panel), and co-linear (including the transcript fragment of E9–E10; the far right panel) isoform expression by nanopore long reads. The numbers of mapped nanopore reads for T1–T7 are illustrated in the far right panel.
Figure 5.
Figure 5.
Comparing expression patterns of tsRNAs and circRNAs. (A) Spearman’s rank correlation coefficient (ρ) between NCL event expression (measured by RPM) and the expression of their corresponding co-linear host genes (measured by FPKM) before and after controlling for tsRNA or circRNA expression (measured by RPM). *P < 0.05, **P < 0.01 and ***P < 0.001. NS, not significant. The analyses were based on 1118, 1708, 1996, 1728, 2421, 1096 and 1087 TS-circRNA events in H1 hESC, GM12878, HeLa, HepG2, K562, HUVEC and NHEK cells, respectively. (B) Comparisons of expression breadth of the three groups of NCL events. The events with dynamic NCL-splicing types were not considered. (C) Comparisons of expression levels (measured by RPM; see Supplementary Table S1) for the three groups of NCL events. The statistical significance was evaluated using the two-tailed Wilcoxon rank-sum test. *P < 0.05, **P < 0.01 and ***P < 0.001. (D) Comparisons of expression levels for tsRNA and circRNA isoforms of TS-circRNA events. The statistical significance was evaluated using the paired two-tailed Wilcoxon rank-sum test. **P < 0.01 and ***P < 0.001. For each TS-circRNA event, the expression levels of tsRNA and circRNA isoforms were evaluated on the basis of poly(A)- and non-poly(A)-selected reads, respectively. (E) qRT-PCR for the abundance of two TS-circRNA events (HIPK3 and ANKRD17) and their corresponding co-linear mRNAs in K562 cells treated with Actinomycin D at five indicated time points. qRT-PCR experiments were performed in triplicate and repeated twice. Data are the means ± one standard deviation.
Figure 6.
Figure 6.
Different subcellular localization preferences of tsRNA and circRNA products. (A and B) Heatmap representations of cytoplasmic and nuclear poly(A)-tailed RNA products (tsRNAs) (A) and cytoplasmic and nuclear non-polyadenylated RNA products (circRNAs) (B) from the seven human cell types, with rows representing NCL events and columns representing cell types. The numerical data represent the RPM values. The analyses were based on 7145 and 13 880 events for (A) and (B), respectively. (C) A similar analysis to that in (B) for cytoplasmic and nuclear non-polyadenylated RNA products with circles spanning only one exon. The analysis was based on 1097 events. (D) qRT-PCR analysis of the cytoplasmic to nuclear expression ratios with oligo-dT pull down (tsRNA isoforms, top) and RNase R treatments (circRNA isoforms, bottom) for the eight selected TS-circRNA events. GAPDH (which is known to be predominately cytoplasmic) and circEIF3J (which is an intron-retained circRNA confirmed to be enriched in the nucleus (13)) were examined as controls. qRT-PCR experiments were performed in triplicate and repeated twice. Error bars represent the mean values ± one standard deviation. (E) RNA fluorescence in situ hybridization for the TS-circRNA events of ANXA2 and CAMSAP1. The expression levels (RPM values) of tsRNA and circRNA isoforms for ANXA2 and CAMSAP1 were also provided (left).
Figure 7.
Figure 7.
A phenomenon of alternative cis-backsplicing and trans-splicing. Reversely complementary sequences across the NCL junctions (e.g. Alu1-Alu2 IRAluacross pair in Figure 4A) can promote both cis-backsplicing and trans-splicing efficiencies by taking the downstream splice donor and upstream acceptor sites close together.

References

    1. Yu C.Y., Liu H.J., Hung L.Y., Kuo H.C., Chuang T.J.. Is an observed non-co-linear RNA product spliced in trans, in cis or just in vitro. Nucleic Acids Res. 2014; 42:9410–9423. - PMC - PubMed
    1. Konarska M.M., Padgett R.A., Sharp P.A.. Trans splicing of mRNA precursors in vitro. Cell. 1985; 42:165–171. - PubMed
    1. Solnick D. Trans splicing of mRNA precursors. Cell. 1985; 42:157–164. - PubMed
    1. Nigro J.M., Cho K.R., Fearon E.R., Kern S.E., Ruppert J.M., Oliner J.D., Kinzler K.W., Vogelstein B.. Scrambled exons. Cell. 1991; 64:607–613. - PubMed
    1. Memczak S., Jens M., Elefsinioti A., Torti F., Krueger J., Rybak A., Maier L., Mackowiak S.D., Gregersen L.H., Munschauer M. et al. . Circular RNAs are a large class of animal RNAs with regulatory potency. Nature. 2013; 495:333–338. - PubMed

Publication types