. 2018 May 1;163(1):123-139.
doi: 10.1093/toxsci/kfy014.

Aging Exacerbates Neuroinflammatory Outcomes Induced by Acute Ozone Exposure

Affiliations

Aging Exacerbates Neuroinflammatory Outcomes Induced by Acute Ozone Exposure

Christina R Tyler et al. Toxicol Sci. .

Abstract

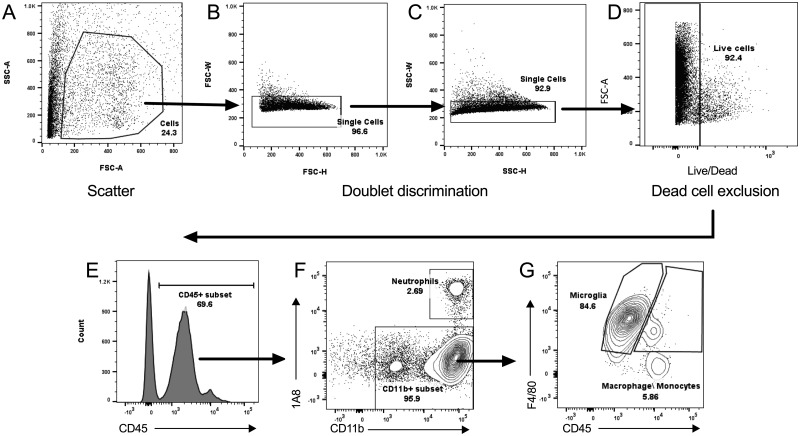
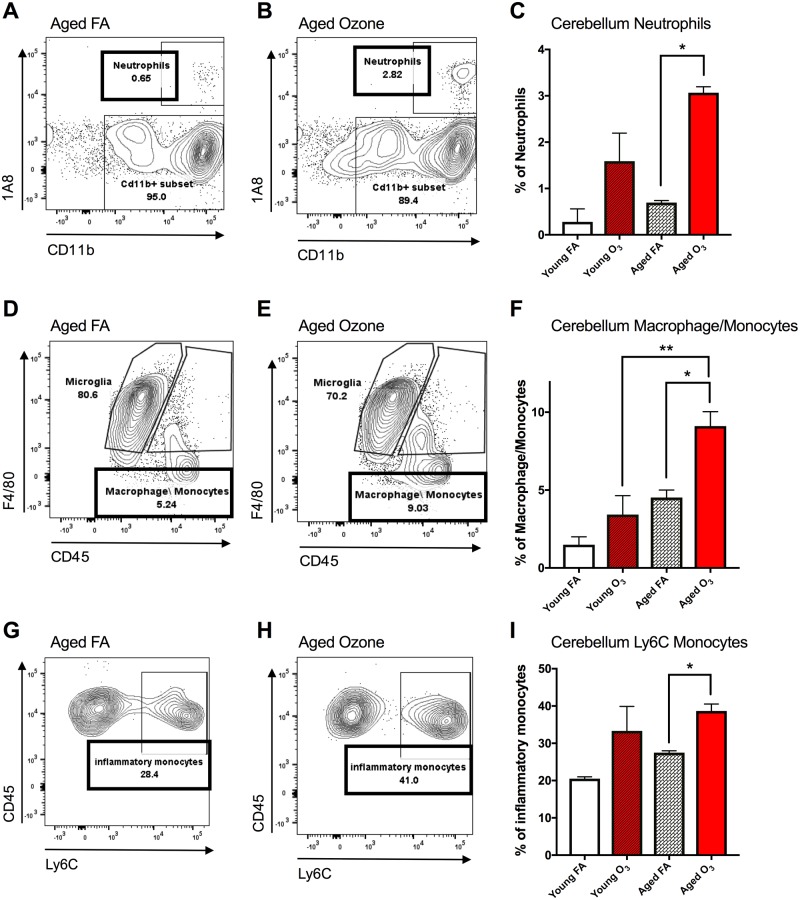
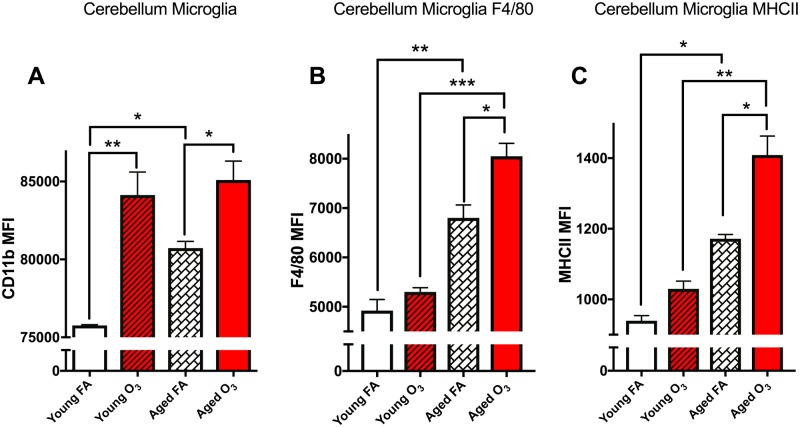
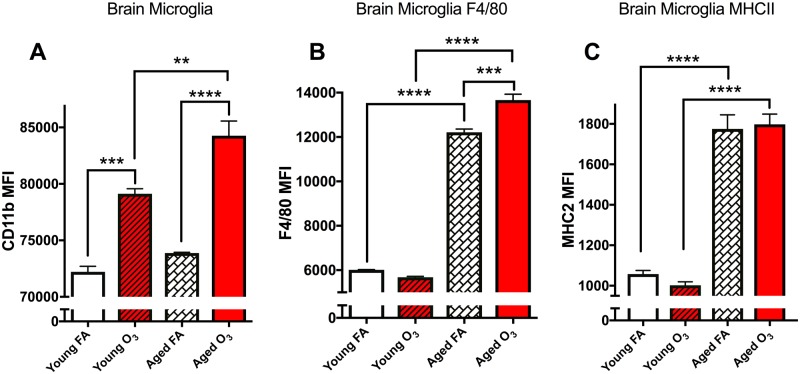
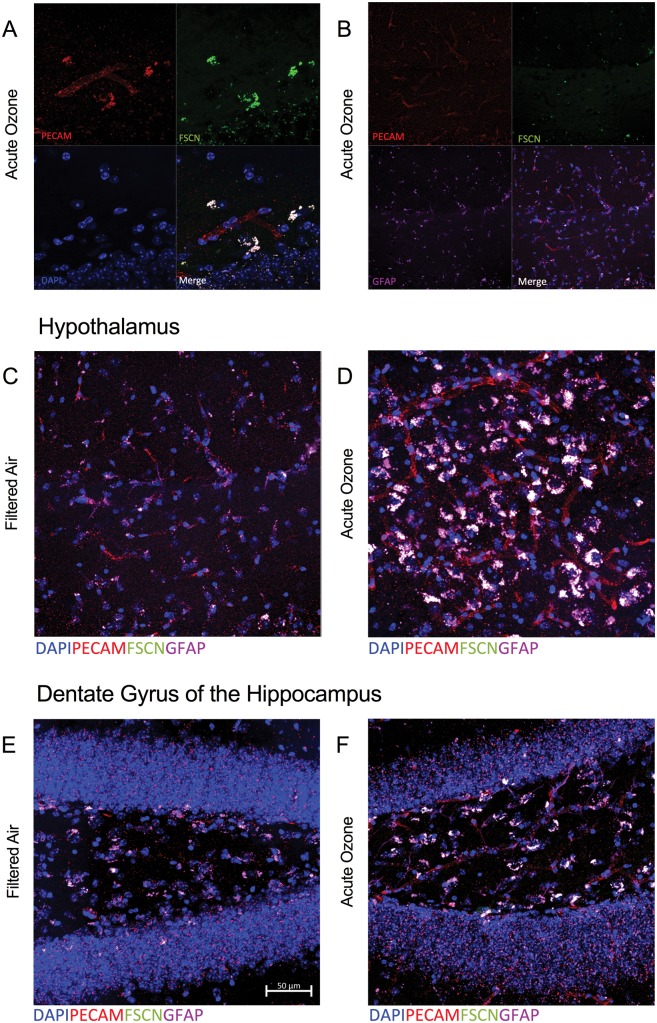
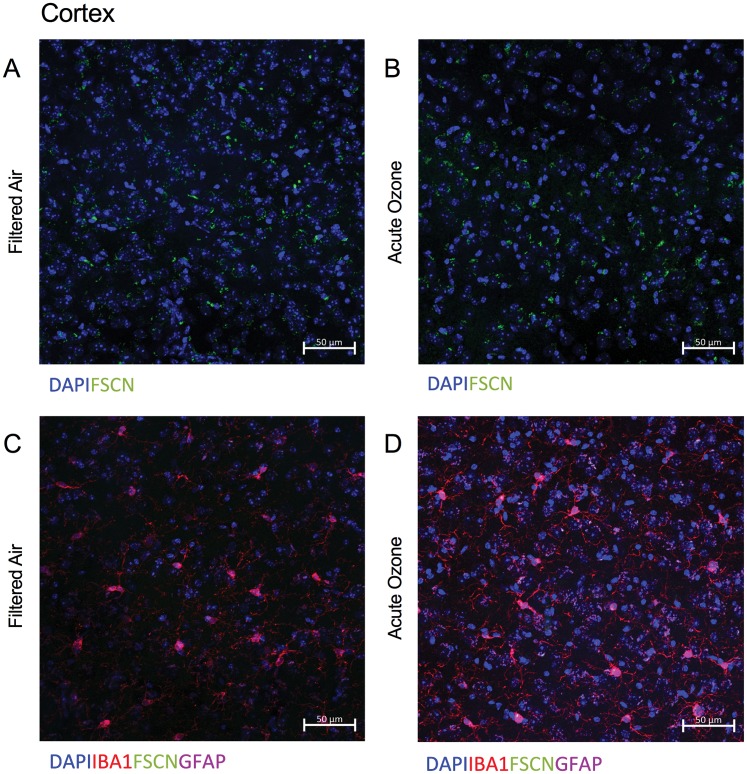
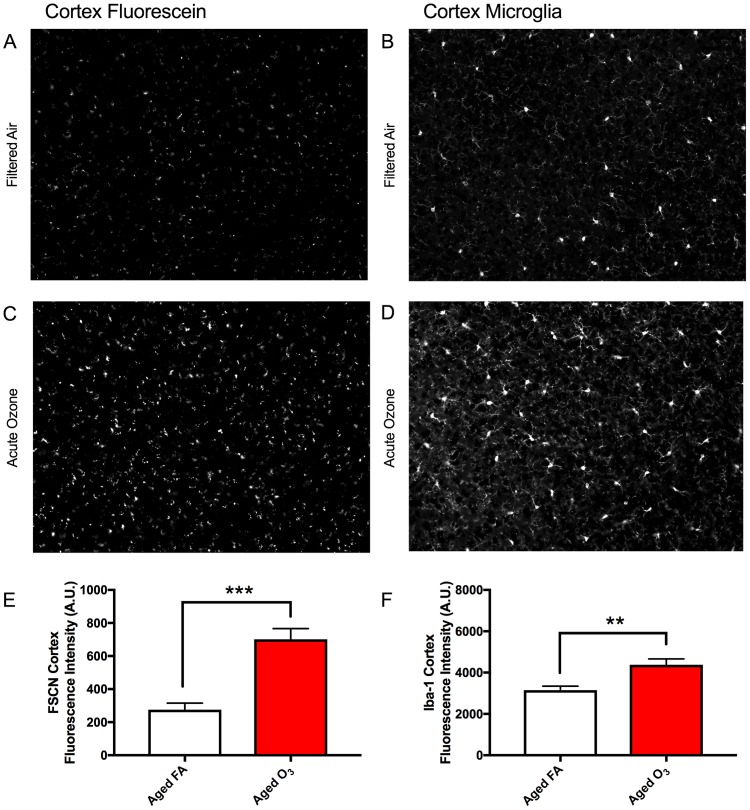
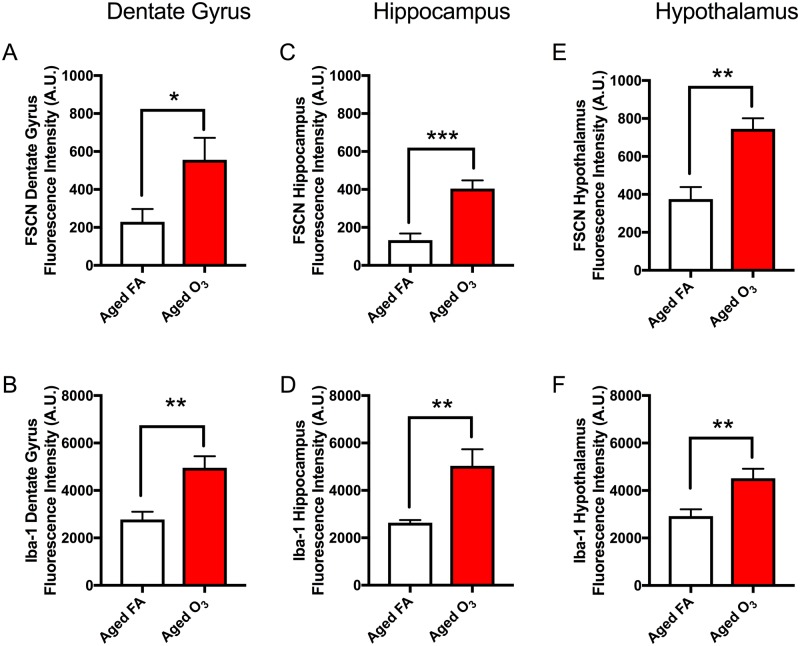
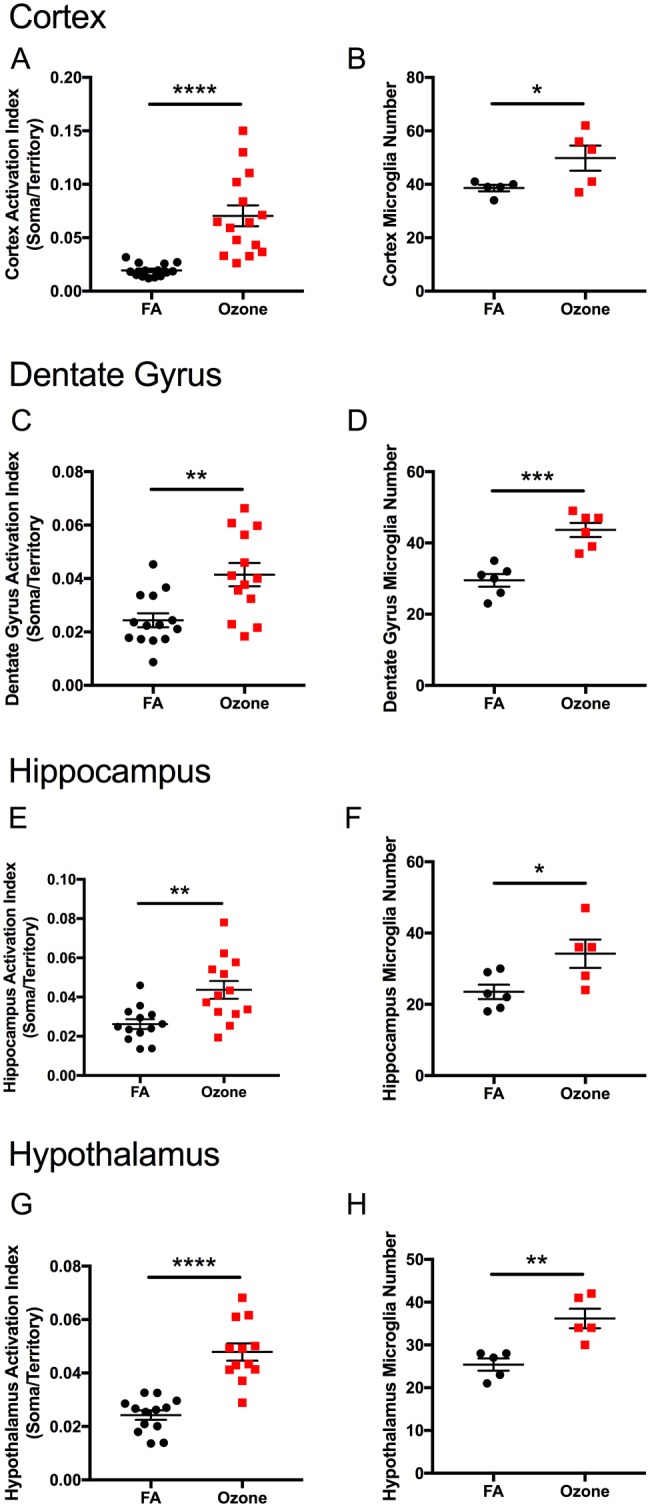
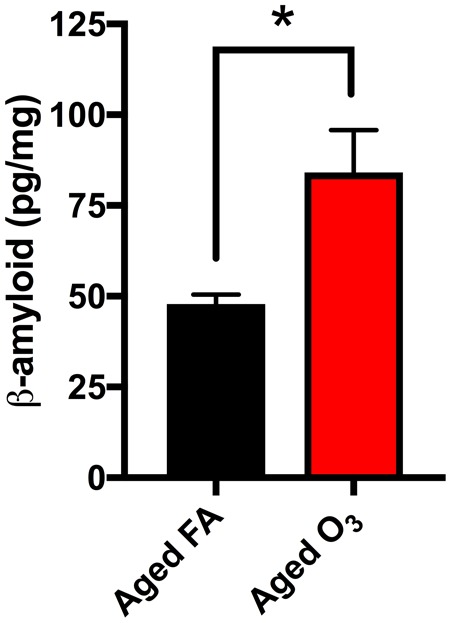
The role of environmental stressors, particularly exposure to air pollution, in the development of neurodegenerative disease remains underappreciated. We examined the neurological effects of acute ozone (O3) exposure in aged mice, where increased blood-brain barrier (BBB) permeability may confer vulnerability to neuroinflammatory outcomes. C57BL/6 male mice, aged 8-10 weeks or 12-18 months were exposed to either filtered air or 1.0 ppm O3 for 4 h; animals received a single IP injection of sodium fluorescein (FSCN) 20 h postexposure. One-hour post-FSCN injection, animals were transcardially perfused for immunohistochemical analysis of BBB permeability. β-amyloid protein expression was assessed via ELISA. Flow cytometric characterization of infiltrating immune cells, including neutrophils, macrophages, and microglia populations was performed 20 h post-O3 exposure. Flow cytometry analysis of brains revealed increased microglia "activation" and presentation of CD11b, F4/80, and MHCII in aged animals relative to younger ones; these age-induced differences were potentiated by acute O3 exposure. Cortical and limbic regions in aged brains had increased reactive microgliosis and β-amyloid protein expression after O3 insult. The aged cerebellum was particularly vulnerable to acute O3 exposure with increased populations of infiltrating neutrophils, peripheral macrophages/monocytes, and Ly6C+ inflammatory monocytes after insult, which were not significantly increased in the young cerebellum. O3 exposure increased the penetration of FSCN beyond the BBB, the infiltration of peripheral immune cells, and reactive gliosis of microglia. Thus, the aged BBB is vulnerable to insult and becomes highly penetrable in response to O3 exposure, leading to greater neuroinflammatory outcomes.


Figures

Figure 1.
Figure 1.
Gating strategy for determining the population of infiltrating, live leukocytes. Representative flow cytometry plots demonstrate the gating strategy used for analysis of immune cell percentages and median fluorescence intensities (MFIs). A, Potential live cells were gated based on their light scatter properties: side scatter-area (SSC-A) versus forward scatter-area (FSC-A). Doublets were removed from this population by gating on (B) forward scatter-width (FSC-W) versus forward scatter-height (FSC-H) and (C) side scatter-width versus side scatter-height (SSC-W versus SSC-H). Dead cells were excluded from the single-cell population (C), as demonstrated in (D) showing FSC-A versus viability dye staining. The cell population identified from A–D gating was then assessed for (E) positive CD45 staining, representing live leukocytes. This subset was used to compare (F) 1A8 versus CD11b expression, with CD45+CD11b+1A8+ denoting the neutrophil population and CD45+1A8CCD11b+ denoting the CD11b+ population (subset, F). This population was then analyzed for (G) F4/80 versus CD45 expression, where 1A8CD11b+F4/80+CD45low denotes microglia and 1A8CD11b+F4/80+CD45low denotes macrophage/monocytes. MFIs were determined for CD11b, F4/80, and MHCII expression on microglia in either the cerebellum or brain where n = 3 mice per group.
Figure 2.
Figure 2.
Acute ozone (O3) exposure induces peripheral leukocyte infiltration in the cerebellum in aged animals. A, Representative flow cytometry dot plots comparing 1A8 (neutrophil marker) and CD11b expression in the aged cerebellum; the neutrophil population was determined from the live leukocyte population and was denoted as CD45+1A8+CD11b+. B, Effects of O3 exposure on the neutrophil population in the aged cerebellum compared with filtered air (FA) aged controls. C, Acute O3 exposure significantly increased the neutrophil population only in the aged cerebellum. D, Expression of F4/80 and CD45 in the aged cerebellum; the macrophage/monocyte population was denoted as CD45high1A8CD11b+F4/80+ distinct from the microglia population, which was denoted as CD45low1A8CD11b+F4/80+. E, Effects of acute O3 exposure on the peripheral macrophage/monocyte population in the aged cerebellum. F, O3 exposure significantly increased the macrophage/monocyte population in the aged cerebellum. The aged cerebellum exhibited significantly increased macrophage/monocyte population compared with the young cerebellum after acute O3 exposure. G, CD45 and Ly6C expression in the aged cerebellum; the inflammatory monocyte population was denoted as CD11b+F4/80+CD45highLy6C+. H, Effects of O3 exposure on the inflammatory monocyte population in the aged cerebellum. I, Acute O3 exposure significantly increased the inflammatory monocyte population in the aged cerebellum (n = 3 per group, *p < .05; **p < .01; ***p < .001; ****p < .0001 by 2-way analysis of variance (ANOVA), all values represent mean ± SEM).
Figure 3.
Figure 3.
Acute O3 exposure increases primed microglia in the aged cerebellum. The microglia population was further analyzed for CD11b, F4/80, and MHCII expression levels, as measured indicative of their “activation” phenotype, or reactive gliosis. A, Bar graph illustrating the CD11b mean fluorescence intensity (MFI) of microglia in the cerebellum. Age significantly increases this population and acute O3 exposure increases this population in both young and aged cerebellar tissue. B, Bar graph illustrating the F4/80 MFI of the microglia population indicative of reactive gliosis or “priming” of microglia in the cerebellum. Age significantly increases this population, and acute O3 exposure increases this population only in the aged cerebellum. F4/80 expression in the aged cerebellum after acute O3 exposure is significantly higher than in the young cerebellum after exposure. C, Bar graph illustrating the MHCII MFI of the microglia population indicative of reactive gliosis or “priming” of microglia in the cerebellum. Age significantly increases this population, and acute O3 exposure increases this population only in the aged cerebellum. MHCII expression in the aged cerebellum after acute O3 exposure is significantly higher than in the young cerebellum after exposure (n = 3 per group, *p < .05; **p < .01; ***p < .001; ****p < .0001 by 2-way ANOVA; all values represent mean ± SEM).
Figure 4.
Figure 4.
Acute O3 exposure exacerbates the effect of age on primed microglia. A, Bar graph illustrating the CD11b MFI indicative of microglia in the brain (sans cerebellum and brain stem). Age does not significantly increase this population; acute O3 exposure increases microglia in both the young and aged brain. The microglia population in the aged brain after acute O3 exposure is significantly higher than in the young brain after exposure. B, Bar graph illustrating the F4/80 MFI of the microglia population indicative of reactive gliosis or “priming” of microglia in the brain. Age significantly increases this population, and acute O3 exposure increases this population only in the aged brain. F4/80 expression in the aged brain after acute O3 exposure is significantly higher than in the young brain after exposure. C, MHCII MFI of the microglia population indicative of reactive gliosis or “priming” of microglia in the cerebellum. Age significantly increased this population. Acute O3 exposure does not change this population in the young or aged brain, yet microglia in the aged brain exhibit significantly greater MHCII expression after O3 exposure than microglia in young brains after exposure (n = 3 per group, *p < .05; **p < .01; ***p < .001; ****p < .0001 by 2-way ANOVA; all values represent mean ± SEM).
Figure 5.
Figure 5.
Microscopy reveals overlapping blood–brain barrier (BBB) impairment and astrocyte activation at the neurovascular unit following acute O3 exposure. A, Representative image of the BBB in the hypothalamus of an aged, O3-exposed brain taken at ×63; PECAM (red) indicates vasculature, FSCN (green) indicates FSCN dye penetration into the brain parenchyma, DAPI (blue) indicates nuclear staining, and the Merge (white) shows overlap indicative of FSCN leakage from the vessels (overlap of PECAM and FSCN). B, Representative image of the BBB and astrocyte activation in the hypothalamus of an aged, FA-exposed animal taken with a ×63 objective; GFAP (purple) indicates astrocytes that are co-localized with the FSCN dye (FSCN, green) and vasculature (PECAM, red) in the Merge image (white). C, The Merge image from (B) in greater detail (×100). D, Representative Merge image of the aged hypothalamus after acute O3 exposure. E, Representative Merge image of the aged dentate gyrus at ×100. F, Representative Merge image of the aged dentate gyrus after acute O3 exposure at ×100. Potential uptake or overlap of the FSCN and GFAP (white) is demonstrated by (C)–(F).
Figure 6.
Figure 6.
BBB permeability and reactive gliosis must be analyzed separately in the aged brain, particularly after acute O3 exposure. A, Representative Merge image of FSCN penetration in the aged cortex, where DAPI indicates nuclear staining. B, Representative Merge image of FSCN penetration in the aged cortex after acute O3 exposure. C, Representative Merge image of aged cortex labeling microglia (Iba-1), FSCN, and astrocytes (GFAP). D, After acute O3 exposure. Delineating the specific astrocyte and microglia contribution to BBB integrity was difficult, particularly after acute O3 exposure. Thus, separate quantitative analyses of FSCN dye penetration and microglia fluorescence was performed. All images were taken with a ×20 objective on a Zeiss LSM800 Airyscan.
Figure 7.
Figure 7.
Acute O3 exposure increases the permeability of the BBB and induces reactive gliosis in cortex of aged animals. A, Representative image of BBB permeability as determined by FSCN penetration in the aged cortex. B, Representative image of microglia (Iba1) in the aged cortex. C, Acute O3 exposure increases FSCN fluorescence at the neurovascular unit and (D) Iba-1 fluorescence in the aged cortex. E, Bar graph depicting FSCN fluorescence quantification in animals exposed to FA (Aged FA) or acute O3 (Aged O3); acute O3 exposure increases fluorescence indicative of increased BBB permeability in the aged cortex (p < .001). F, Bar graph depicting Iba-1 fluorescence quantification in animals exposed to FA (Aged FA) or acute O3 (Aged O3); acute O3 exposure increases fluorescence indicative of reactive gliosis (neuroinflammation) in the aged cortex, (p < .01). Brain sections were imaged on a Zeiss AxioPlan2 Microscope with Nuance Multi-Spectral Camera, allowing for total fluorescence analysis (n = 6 per group, **p < .01; ***p < .001 by Student’s t test; all values represent mean ± SEM).
Figure 8.
Figure 8.
Limbic structures of the aged brain are susceptible to increased BBB permeability and reactive gliosis after acute O3 exposure. A, In the aged dentate gyrus, acute O3 exposure increased BBB permeability, as determined by FSCN fluorescence, and (B) induces reactive gliosis, or microglia reactivity (neuroinflammation), as determined by Iba-1 fluorescence. C, In the aged hippocampus (CA1 area), acute O3 exposure increases BBB permeability and (D) induces reactive gliosis. E, In the aged hypothalamus, acute O3 exposure increases BBB permeability, and (F) induces reactive gliosis. Representative images of FSCN penetration and microglia fluorescence are provided the Supplementary data for each of these structures (n = 6 per group and 3 images per region, **p < .01; ***p < .001 by Student’s t test; all values represent mean ± SEM).
Figure 9.
Figure 9.
Acute O3 exposure alters microglia morphology and number in limbic structures of the aged brain. Acute O3 exposure significantly increases the activation index of microglia, as determined by the ratio of soma size to territory of processes in the aged (A) cortex, (C) dentate gyrus, (E) hippocampus, and (G) hypothalamus. Acute O3 exposure significantly increases reactive gliosis, including the number of microglia in the (B) cortex, (D) dentate gyrus, (F) hippocampus, and (H) hypothalamus (n = 11–15 individual cells per group and n = 5–6 images for total microglia quantification, *p < .05, **p < .01; ***p < .001, ****p < .0001 by Student’s t test; all values represent mean ± SEM).
Figure 10.
Figure 10.
Acute O3 exposure increases β-amyloid protein expression in cortical and limbic regions of the aged brain. Increased β-amyloid protein accumulation in the brain was observed after acute O3 exposure (*p < .05 by Student’s t test; all values represent mean ± SEM).

Similar articles

Cited by

References

    1. Ailshire J. A., Crimmins E. M. (2014). Fine particulate matter air pollution and cognitive function among older US adults. Am. J. Epidemiol. 180, 359–366.http://dx.doi.org/10.1093/aje/kwu155 - DOI - PMC - PubMed
    1. Akhter H., Ballinger C., Liu N., Van Groen T., Postlethwait E. M., Liu R. M. (2015). Cyclic ozone exposure induces gender-dependent neuropathology and memory decline in an animal model of Alzheimer’s disease. Toxicol. Sci. 147, 222–234. - PMC - PubMed
    1. Aragon M. J., Topper L., Tyler C. R., Sanchez B., Zychowski K., Young T., Herbert G., Hall P., Erdely A., Eye T. et al. , (2017). Serum-borne bioactivity caused by pulmonary multiwalled carbon nanotubes induces neuroinflammation via blood-brain barrier impairment. Proc. Natl. Acad. Sci. U. S. A. 114, E1968–E1976. - PMC - PubMed
    1. Bhatt D. P., Puig K. L., Gorr M. W., Wold L. E., Combs C. K., Block M. L. (2015). A pilot study to assess effects of long-term inhalation of airborne particulate matter on early Alzheimer-like changes in the mouse brain. PLoS One 10, e0127102–e0127120. - PMC - PubMed
    1. Blau C. W., Cowley T. R., O'Sullivan J., Grehan B., Browne T. C., Kelly L., Birch A., Murphy N., Kelly A. M., Kerskens C. M. et al. , (2012). The age-related deficit in LTP is associated with changes in perfusion and blood-brain barrier permeability. Neurobiol. Aging 33, 1005.e23. - PubMed

Publication types

MeSH terms