. 2018 Jan 30;11(2):212.
doi: 10.3390/ma11020212.

Transparent Glass-Ceramics Produced by Sol-Gel: A Suitable Alternative for Photonic Materials

Affiliations

Transparent Glass-Ceramics Produced by Sol-Gel: A Suitable Alternative for Photonic Materials

Giulio Gorni et al. Materials (Basel). .

Abstract

Transparent glass-ceramics have shown interesting optical properties for several photonic applications. In particular, compositions based on oxide glass matrices with fluoride crystals embedded inside, known as oxyfluoride glass-ceramics, have gained increasing interest in the last few decades. Melt-quenching is still the most used method to prepare these materials but sol-gel has been indicated as a suitable alternative. Many papers have been published since the end of the 1990s, when these materials were prepared by sol-gel for the first time, thus a review of the achievements obtained so far is necessary. In the first part of this paper, a review of transparent sol-gel glass-ceramics is made focusing mainly on oxyfluoride compositions. Many interesting optical results have been obtained but very little innovation of synthesis and processing is found with respect to pioneering papers published 20 years ago. In the second part we describe the improvements in synthesis and processing obtained by the authors during the last five years. The main achievements are the preparation of oxyfluoride glass-ceramics with a much higher fluoride crystal fraction, at least double that reported up to now, and the first synthesis of NaGdF₄ glass-ceramics. Moreover, a new SiO₂ precursor was introduced in the synthesis, allowing for a reduction in the treatment temperature and favoring hydroxyl group removal. Interesting optical properties demonstrated the incorporation of dopant ions in the fluoride crystals, thus obtaining crystal-like spectra along with higher efficiencies with respect to xerogels, and hence demonstrating that these materials are a suitable alternative for photonic applications.

Keywords: nanocrystal; optical properties; oxyfluoride glass-ceramics; sol-gel.


Conflict of interest statement

The authors declare no conflict of interest.

Figures

Figure 1
Figure 1
TGA/DTA curve of the MgF2 gel obtained by drying the sol at 80 °C. Figure modified from Figure 4 of [22].
Figure 2
Figure 2
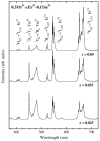
PL spectra recorded on Eu3+-doped xerogel (dotted curve) and GC (solid curve) using λex. = 394 nm [35].
Figure 3
Figure 3
(a) XRD patterns of 95SiO2-5LaF3 GCs at different temperatures and (b) CIR standard chromaticity showing the up-conversion emission for GCs co-doped with 0.3Yb3+, 0.1Ho3+ and 0.1 Tm3+ [53].
Figure 4
Figure 4
(a) XRD patterns of 90SiO2-10YF3 Ln3+-doped GCs heat treated at 650 and 675 °C together with the JCPDS-YF3 and (b) Up-conversion emission spectrum of GCs co-doped with 1.5 Yb3+ and 0.1 Tm3+ heat-treated at 675 °C [60].
Figure 5
Figure 5
HRTEM image of Eu3+ doped SiO2-GdF3 GC film heat = treated at 400 °C [64].
Figure 6
Figure 6
Up-conversion emission spectra of 95SiO2-5KYF4 GCs co-doped with Yb3+-Er3+-Tm3+ heat-treated at 700 °C [76].
Figure 7
Figure 7
(a) TEM and (b) HRTEM images of 95SiO2-5BaGd(1−x)EuxF5. Inset show power spectrum (FFT pattern) and filtered higher-contrasted red and blue square nanoparticles [86].
Figure 8
Figure 8
(a) DTA in air of (100 − x)SiO2-xLaF3 (x = 10–40 mol %) bulk samples prepared with TEOS; (b) DTA and TG in argon atmosphere of 80SiO2-20LaF3 bulk samples prepared with TEOS; (c) DTA in air of 80SiO2-20LaF3 bulk samples with TEOS and TEOS/MTES. All measurements were performed using a heating rate of 10 °C/min.
Figure 9
Figure 9
XRD of 80SiO2-20LaF3 GC treated at 550 °C for 1 min performed at the synchrotron SpLine BM25B of the ESRF.
Figure 10
Figure 10
HRTEM of 80SiO2-20LaF3 (a) thin film and (b) self-supported layer prepared using TEOS/MTES and treated at 550 °C for 1 min. The corresponding crystal size distributions are also shown.
Figure 11
Figure 11
19F MAS-NMR spectra of 80SiO2-20LaF3 xerogel and GC treated at 550 °C for 1 min. The spectrum of pure LaF3 crystal powder is also given for comparison. Stars indicate spinning sidebands.
Figure 12
Figure 12
FTIR of 80SiO2-20LaF3 xerogel and GC self-supported layer treated at 550 °C for 1 min and 1 h.
Figure 13
Figure 13
PL (a) emission and (b) excitation spectra of 80SiO2-20LaF3 bulk xerogel and GC treated at 650 °C for 3 h. All spectra were recorded at 9 K.
Figure 14
Figure 14
DTA (red) and TG (blue) curve of 90SiO2-10NaGdF4 bulk sample acquired in air using a heating rate of 10 °C/min.
Figure 15
Figure 15
XRD of (100 − x)SiO2-xGdF3 (x = 10 and 20 mol %) GC treated at 550 °C for 1 min performed at the synchrotron SpLine BM25 of the ESRF.
Figure 16
Figure 16
XRD of 80SiO2-20NaGdF4 GC treated at 600 °C for 1 and 120 h. The measurements were performed at the synchrotron SpLine BM25 of the ESRF.
Figure 17
Figure 17
HRTEM of 80SiO2-20GdF3 self-supported layer treated at 550 °C for 1 min.
Figure 18
Figure 18
FTIR of 80SiO2-20GdF3 xerogel and GC treated at 550 °C for 1 min.
Figure 19
Figure 19
XAS (a) spectra and (b) derivate of Eu2O3 and EuF3 reference samples. The values shown in (b) refer to the maximum of the derivate curves.
Figure 20
Figure 20
XAS (a) spectra and (b) derivate of 0.5Eu3+-doped 80SiO2-20LaF3 xerogel and GC samples treated at 550 °C for 1 min up to 8 h. The values shown in (b) refer to the maximum of the derivate curves.
Figure 21
Figure 21
Emission spectra of Eu3+ and Gd3+ ions in xerogel (bottom) and GC (top) treated at 550 °C-1 min under excitation of Eu3+ at 393 nm (red spectra) and of Gd3+ at 273 nm (blue spectra).

References

    1. Feldmann C., Jüstel T., Ronda C.R., Schmidt P.J. Inorganic luminescent materials: 100 years of research and application. Adv. Funct. Mater. 2003;13:511–516. doi: 10.1002/adfm.200301005. - DOI
    1. George N.C., Denault K.A., Seshadri R. Phosphors for solid-state white lightening. Annu. Rev. Mater. Res. 2013;43:481–501. doi: 10.1146/annurev-matsci-073012-125702. - DOI
    1. Huang X. Solid-state lighting: Red phosphor converts white LEDs. Nat. Photonics. 2014;8:748–749. doi: 10.1038/nphoton.2014.221. - DOI
    1. Huang X., Han S., Huang W., Liu X. Enhancing solar cell efficiency: The search for luminescent materials as spectral converters. Chem. Soc. Rev. 2013;42:173–201. doi: 10.1039/C2CS35288E. - DOI - PubMed
    1. Eliseeva S.V., Bunzli J.C.G. Lanthanide luminescence for functional materials and bio-sciences. Chem. Soc. Rev. 2010;39:189–227. doi: 10.1039/B905604C. - DOI - PubMed

LinkOut - more resources