Transcriptome profiling of lentil (Lens culinaris) through the first 24 hours of Ascochyta lentis infection reveals key defence response genes
- PMID: 29385986
- PMCID: PMC5793396
- DOI: 10.1186/s12864-018-4488-1
Transcriptome profiling of lentil (Lens culinaris) through the first 24 hours of Ascochyta lentis infection reveals key defence response genes
Abstract
Background: Ascochyta blight, caused by the fungus Ascochyta lentis, is one of the most destructive lentil diseases worldwide, resulting in over $16 million AUD annual loss in Australia alone. The use of resistant cultivars is currently considered the most effective and environmentally sustainable strategy to control this disease. However, little is known about the genes and molecular mechanisms underlying lentil resistance against A. lentis.
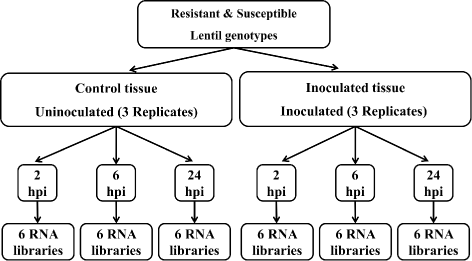
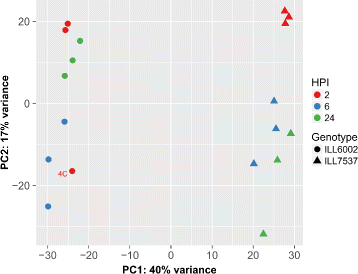
Results: To uncover the genetic basis of lentil resistance to A. lentis, differentially expressed genes were profiled in lentil plants during the early stages of A. lentis infection. The resistant 'ILL7537' and susceptible 'ILL6002' lentil genotypes were examined at 2, 6, and 24 h post inoculation utilising high throughput RNA-Sequencing. Genotype and time-dependent differential expression analysis identified genes which play key roles in several functions of the defence response: fungal elicitors recognition and early signalling; structural response; biochemical response; transcription regulators; hypersensitive reaction and cell death; and systemic acquired resistance. Overall, the resistant genotype displayed an earlier and faster detection and signalling response to the A. lentis infection and demonstrated higher expression levels of structural defence-related genes.
Conclusions: This study presents a first-time defence-related transcriptome of lentil to A. lentis, including a comprehensive characterisation of the molecular mechanism through which defence against A. lentis is induced in the resistant lentil genotype.
Keywords: Ascochyta lentis; De novo assembly; Defence response; Fabaceae; Lens culinaris; Lentil; RNA sequencing and transcriptome analysis.
Conflict of interest statement
Ethics approval and consent to participate
Plants used in this study were grown from seeds sourced from the University of Melbourne collection. Sampling of plant material was performed in compliance with institutional guidelines. No further approvals, licences or permissions were required since no sampling was conducted from wild and/or native flora.
Consent for publication
Not applicable.
Publisher’s Note
Springer Nature remains neutral with regard to jurisdictional claims in published maps and institutional affiliations.
Figures



References
-
- FAOSTAT . Food and Agriculture Organization of the United Nations (FAO) statistical yearbook 2014. Statistical yearbook. Rome: Fisheries and Aquaculture Department, Food and Agriculture Organization (FAO) of the United Nations; 2014.
-
- Nene YL, Hanounik SB, Qureshi SH, Sen B. Fungal and bacterial foliar diseases of pea, lentil, faba bean and chickpea. In: Summerfield RJE, editor. World Crops: Cool Season Food Legumes: A Global Perspective of the Problems and Prospects for Crop Improvement in Pea, Lentil, Faba Bean and Chickpea. Dordrecht: Springer Netherlands; 1988.
-
- Taylor PWJ, Ford R. Diagnostics, genetic diversity and pathogenic variation of ascochyta blight of cool season food and feed legumes. Eur J Plant Pathol. 2007;119(1):127–33. doi: 10.1007/s10658-007-9177-x. - DOI
-
- Murray GM, Brennan JP. The Current and Potential Costs from Diseases of Pulse Crops in Australia. Canberra: Grains Research and Development Corporation; 2012.
-
- Galloway J, MacLeod WJ, Lindbeck KD. Formation of Didymella lentis, the teleomorph of Ascochyta lentis, on lentil stubble in the field in Victoria and Western Australia. Australas Plant Pathol. 2004;33(3):449–50. doi: 10.1071/AP04033. - DOI
Publication types
MeSH terms
Grants and funding
LinkOut - more resources
Full Text Sources
Other Literature Sources
Medical

