. 2018 Jan 30;22(5):1159-1168.
doi: 10.1016/j.celrep.2018.01.008.

Active Ebola Virus Replication and Heterogeneous Evolutionary Rates in EVD Survivors

Affiliations

Active Ebola Virus Replication and Heterogeneous Evolutionary Rates in EVD Survivors

Shannon L M Whitmer et al. Cell Rep. .

Abstract

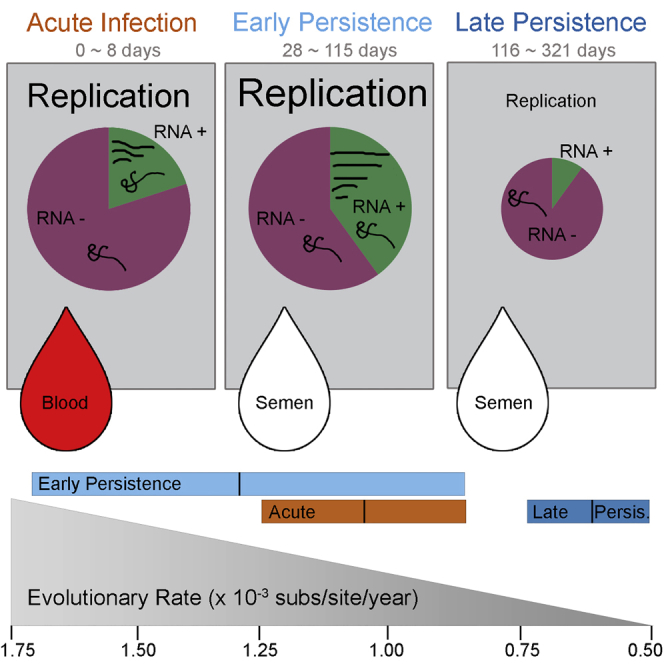
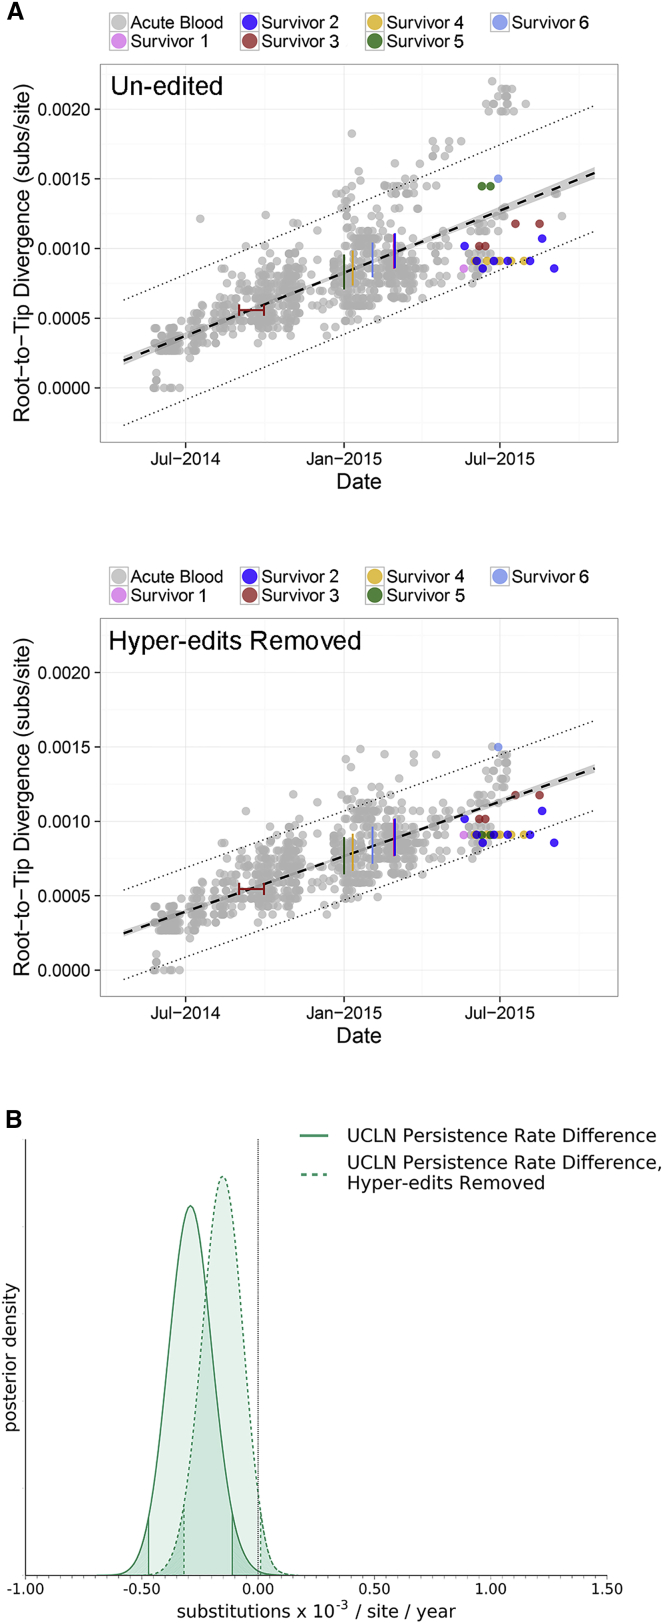
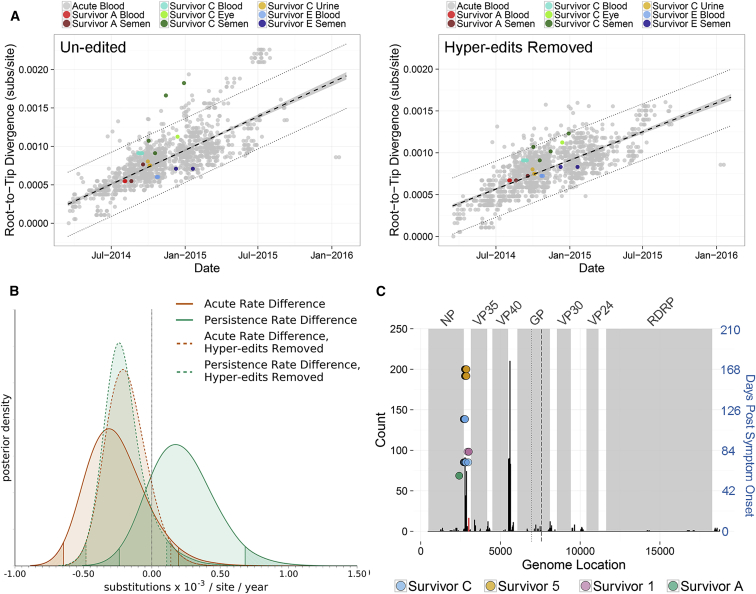
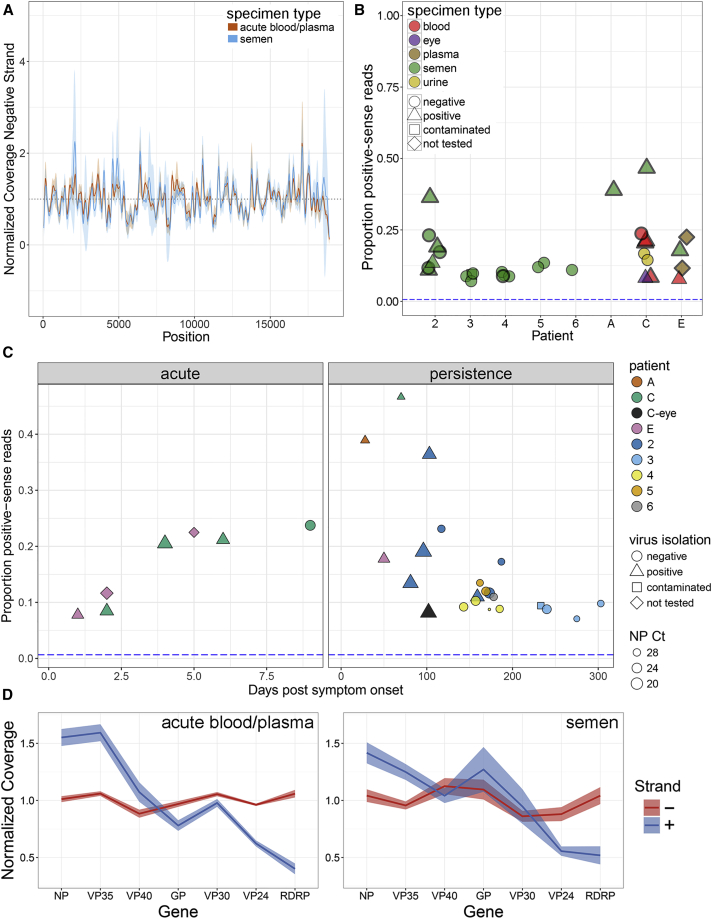
Following cessation of continuous Ebola virus (EBOV) transmission within Western Africa, sporadic EBOV disease (EVD) cases continued to re-emerge beyond the viral incubation period. Epidemiological and genomic evidence strongly suggests that this represented transmission from EVD survivors. To investigate whether persistent infections are characterized by ongoing viral replication, we sequenced EBOV from the semen of nine EVD survivors and a subset of corresponding acute specimens. EBOV evolutionary rates during persistence were either similar to or reduced relative to acute infection rates. Active EBOV replication/transcription continued during convalescence, but decreased over time, consistent with viral persistence rather than viral latency. Patterns of genetic divergence suggest a moderate relaxation of selective constraints within the sGP carboxy-terminal tail during persistent infections, but do not support widespread diversifying selection. Altogether, our data illustrate that EBOV persistence in semen, urine, and aqueous humor is not a quiescent or latent infection.

Keywords: EVD survivors; Ebola virus; RNA hyper-editing; evolutionary pressure; evolutionary rates; persistent viral infection.


Figures

None
Graphical abstract
Figure 1
Figure 1
EBOV in Semen Specimens from Sierra Leonean EVD Survivors Exhibit Reduced Evolutionary Rates (A) Genetic divergence versus specimen collection date for nearly all SLE viral sequences (n = 1,058) acquired from blood, plasma, or oral swab during acute infection (gray) and from semen during persistent infection (color). Colored bars represent survivor-reported symptom onset dates, and red whiskers represent onset date ambiguity for survivor 3. Top: includes sequences without editing. Bottom: includes sequences with reversion of potential U-to-C hyper-edited sites. Acute specimen average divergence from root is black dashed line and corresponding 95% confidence interval is gray (along black dashed line). Dotted lines represent 95% prediction intervals. EVD survivors 1, 2, 3, and 4 exhibited a reduced number of substitutions relative to the mean AAVS divergence, whereas survivors 5 and 6 exhibited an increased number of substitutions relative to the mean AAVS divergence (upper panel). Removal of hyper-edited sites reduced the number of substitutions for patient 5 (bottom). (B) SAVS exhibit significantly reduced evolutionary rates compared to AAVS. Posterior rate distribution differences of SAVS compared to AAVS using un-edited sequences (solid line) and reversion of potential hyper-edited sites (dashed line). Shaded density tails indicate 95% highest posterior density interval (HPD) and black dotted line indicates the expectation that rate estimates are identical during acute and persistent infection.
Figure 2
Figure 2
EBOV Sequenced from Acute and Persistent Clinical Specimens Acquired from US EVD Survivors Exhibits Acute-like Evolutionary Rates (A) Genetic divergence versus specimen collection date for viral sequences from US EVD survivors and 1,498 sequences from SLE, Guinea (GIN), and Liberia (LBR). Left: includes sequences without editing. Right: includes sequences with reversion of potential hyper-edited sites. Viral sequences were acquired from blood, plasma, or oral swab specimens during acute infection (gray), or from blood, plasma, semen, urine, or eye during acute and persistent infection in EVD survivors (color). Mean divergence, 95% confidence interval, and 95% prediction intervals as in Figure 1. (B) Prior to removal of hyper-edited U-to-C sites, SAVS (green solid line) exhibit ∼1.45-fold increased evolutionary rate compared to AAVS (orange solid line). After reversion of U-to-C hyper-edits, SAVS (green dashed line) exhibit a similar divergence as AAVS (orange dashed line). Overall, AAVS and SAVS evolutionary rates were not significantly different from the overall acute evolutionary rate (black dotted line, estimated from AAVS collected in SLE, GIN, and LBR). HPD intervals and rate distribution difference as in Figure 1. (C) Distribution of U-to-C hyper editing sites using 1,498 sequences from SLE, GIN, and LBR. Occurrence of hyper-editing across the viral genome (black bars) and within coding regions (gray shading). GP transcriptional editing is dotted line, and GP1 and GP2 cleavage is dashed line. Hyper-edited sites from EVD survivors versus days post symptom onset is right y axis (blue). These sites only occurred within a distinct region near the untranslated 3′ nucleoprotein (NP) transcript, which was also observed with high frequency within acute specimens and is near a U-to-C editing site described in Ni et al. (2016) (red bar).
Figure 3
Figure 3
Selective Pressures within the MGT (A) Comparison of loge(ω) estimates for viral genes calculated using PAML branch model (green) and coalescent robust counting (orange, error bars indicate 95% HPD) or from Park et al. (2015) (dark gray, error bars indicate 95% HPD) and from Tong et al. (2015) (light gray, error bars indicate 95% HPD). Rate estimates in PAML/codeml used SAVS and a subset of AAVS from SLE, GIN, and LBR (collected between 03/2014–09/2015). Robust counting estimates used a subset of AAVS from SLE, GIN and LBR collected between 03/2014–07/2015. Rate estimates from Park et al. (2015) and Tong et al. (2015) were calculated using robust counting with specimens collected between 03/2014–03/2015 and 03/2014–11/2014. In most cases, ω estimates closely agree and were reduced compared to previous estimates, consistent with purifying selection acting over a longer time period. Branch and branch-site PAML models support elevated ω in the secreted GP carboxy-tail from SAVS (“SGPc”) (stars). GP rate estimates from Park et al. (2015) and Tong et al. (2015) include full-length GP, rather than partitioned GP, as analyzed here (+ sign). (B) Comparison of the proportion of total nonsynonymous (N, gray) and synonymous (S, black) counts across AAVS (from SLE, GIN, and LBR) and SAVS tree branches for the SGPc tail. Numbers above bars are the total count of N/S substitutions summed across AAVS and SAVS branches. Only nonsynonymous substitutions were observed in SAVS within the SGPc tail. (C) Comparison of the glycoprotein (GP) C-terminal variants produced following transcriptional RNA editing. Sites identified with the PAML branch-site model to experience potential positive selection in SAVS are in gray and wild-type alleles are in red. Intervening amino acids (not to scale) are summarized with “……” Protease cleavage in the sGPc tail produces canonical sGPc and Δ peptide (red line) and cleavage of the full-length GP produces GP1 and GP2. Loss of the sGP stop codon is predicted to produce an extended Δ peptide for survivor 3 (gray).
Figure 4
Figure 4
Active Viral Replication during Persistent Infection (A) Average normalized negative-sense (viral genome) coverage for AAVS and SAVS (coverage mean [line] and standard deviations [shading]). (B) Proportion of EBOV genome-wide positive-sense reads out of total reads from EVD survivor specimens. Specimen types indicated by color, point shape indicates virus isolation results and specimens in (D) contain thick borders. Blue dashed horizontal line indicates the proportion of positive-sense reads observed from a negative-sense viral RNA in vitro transcript (Figure S3A). (C) Proportion of positive-sense reads versus day post symptom onset for acute specimens (left) and persistent specimens (right). Patients highlighted by color, virus isolation results highlighted by shape and nucleoprotein cycle threshold values highlighted by size. (D) Proportion of normalized strand-specific reads per EBOV gene from AAVS (left) or SAVS (right). Negative-sense (viral genome) reads in red, and positive-sense (mRNA and viral complementary genome) reads in blue (shading is SE of the normalized coverage means).

Similar articles

Cited by

  • Inhibition of Nipah Virus by Defective Interfering Particles.
    Welch SR, Tilston NL, Lo MK, Whitmer SLM, Harmon JR, Scholte FEM, Spengler JR, Duprex WP, Nichol ST, Spiropoulou CF. Welch SR, et al. J Infect Dis. 2020 May 11;221(Suppl 4):S460-S470. doi: 10.1093/infdis/jiz564. J Infect Dis. 2020. PMID: 32108876 Free PMC article.
  • Immune Privilege Furnishes a Niche for Latent Infection.
    Forrester JV, Mölzer C, Kuffova L. Forrester JV, et al. Front Ophthalmol (Lausanne). 2022 Mar 8;2:869046. doi: 10.3389/fopht.2022.869046. eCollection 2022. Front Ophthalmol (Lausanne). 2022. PMID: 38983514 Free PMC article. Review.
  • Natural history of Ebola virus disease in rhesus monkeys shows viral variant emergence dynamics and tissue-specific host responses.
    Normandin E, Triana S, Raju SS, Lan TCT, Lagerborg K, Rudy M, Adams GC, DeRuff KC, Logue J, Liu D, Strebinger D, Rao A, Messer KS, Sacks M, Adams RD, Janosko K, Kotliar D, Shah R, Crozier I, Rinn JL, Melé M, Honko AN, Zhang F, Babadi M, Luban J, Bennett RS, Shalek AK, Barkas N, Lin AE, Hensley LE, Sabeti PC, Siddle KJ. Normandin E, et al. Cell Genom. 2023 Nov 21;3(12):100440. doi: 10.1016/j.xgen.2023.100440. eCollection 2023 Dec 13. Cell Genom. 2023. PMID: 38169842 Free PMC article.
  • Inference of Nipah virus evolution, 1999-2015.
    Whitmer SLM, Lo MK, Sazzad HMS, Zufan S, Gurley ES, Sultana S, Amman B, Ladner JT, Rahman MZ, Doan S, Satter SM, Flora MS, Montgomery JM, Nichol ST, Spiropoulou CF, Klena JD. Whitmer SLM, et al. Virus Evol. 2020 Aug 19;7(1):veaa062. doi: 10.1093/ve/veaa062. eCollection 2021 Jan. Virus Evol. 2020. PMID: 34422315 Free PMC article.
  • Tracking virus outbreaks in the twenty-first century.
    Grubaugh ND, Ladner JT, Lemey P, Pybus OG, Rambaut A, Holmes EC, Andersen KG. Grubaugh ND, et al. Nat Microbiol. 2019 Jan;4(1):10-19. doi: 10.1038/s41564-018-0296-2. Epub 2018 Dec 13. Nat Microbiol. 2019. PMID: 30546099 Free PMC article. Review.

References

    1. Alfson K.J., Avena L.E., Beadles M.W., Menzie H., Patterson J.L., Carrion R., Jr., Griffiths A. Genetic changes at the glycoprotein editing site associated with serial passage of Sudan virus. J. Infect. Dis. 2015;212(Suppl 2):S295–S304. - PMC - PubMed
    1. Arias A., Watson S.J., Asogun D., Tobin E.A., Lu J., Phan M.V.T., Jah U., Wadoum R.E.G., Meredith L., Thorne L. Rapid outbreak sequencing of Ebola virus in Sierra Leone identifies transmission chains linked to sporadic cases. Virus Evol. 2016;2:vew016. - PMC - PubMed
    1. Baczko K., Lampe J., Liebert U.G., Brinckmann U., ter Meulen V., Pardowitz I., Budka H., Cosby S.L., Isserte S., Rima B.K. Clonal expansion of hypermutated measles virus in a SSPE brain. Virology. 1993;197:188–195. - PubMed
    1. Barnes K.G., Kindrachuk J., Lin A.E., Wohl S., Qu J., Tostenson S.D., Dorman W.R., Busby M., Siddle K.J., Luo C.Y. Evidence of Ebola virus replication and high concentration in semen of a patient during recovery. Clin. Infect. Dis. 2017;65:1400–1403. - PMC - PubMed
    1. Bass B.L. RNA editing by adenosine deaminases that act on RNA. Annu. Rev. Biochem. 2002;71:817–846. - PMC - PubMed

Publication types