

Efficient analysis of stochastic gene dynamics in the non-adiabatic regime using piecewise deterministic Markov processes
- PMID: 29386401
- PMCID: PMC5805981
- DOI: 10.1098/rsif.2017.0804
Efficient analysis of stochastic gene dynamics in the non-adiabatic regime using piecewise deterministic Markov processes
Abstract
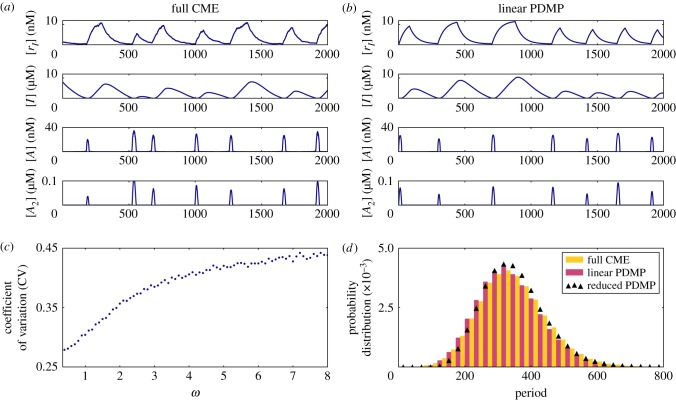
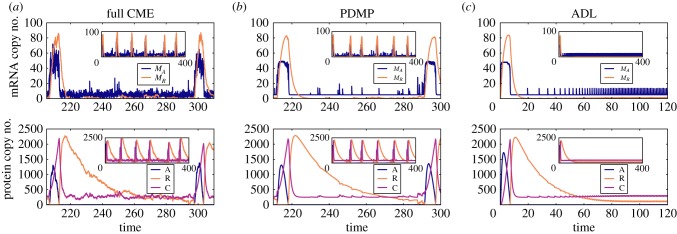
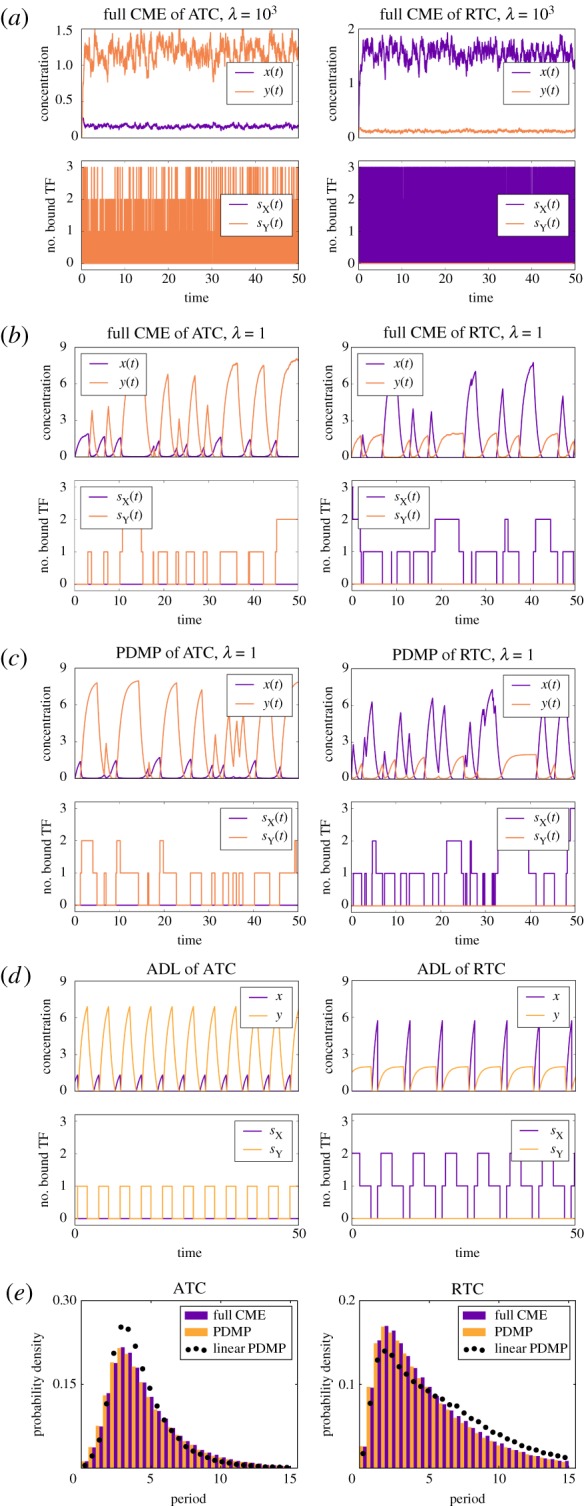
Single-cell experiments show that gene expression is stochastic and bursty, a feature that can emerge from slow switching between promoter states with different activities. In addition to slow chromatin and/or DNA looping dynamics, one source of long-lived promoter states is the slow binding and unbinding kinetics of transcription factors to promoters, i.e. the non-adiabatic binding regime. Here, we introduce a simple analytical framework, known as a piecewise deterministic Markov process (PDMP), that accurately describes the stochastic dynamics of gene expression in the non-adiabatic regime. We illustrate the utility of the PDMP on a non-trivial dynamical system by analysing the properties of a titration-based oscillator in the non-adiabatic limit. We first show how to transform the underlying chemical master equation into a PDMP where the slow transitions between promoter states are stochastic, but whose rates depend upon the faster deterministic dynamics of the transcription factors regulated by these promoters. We show that the PDMP accurately describes the observed periods of stochastic cycles in activator and repressor-based titration oscillators. We then generalize our PDMP analysis to more complicated versions of titration-based oscillators to explain how multiple binding sites lengthen the period and improve coherence. Last, we show how noise-induced oscillation previously observed in a titration-based oscillator arises from non-adiabatic and discrete binding events at the promoter site.
Keywords: circadian rhythm; gene expression; intrinsic noise; mathematical model; stochastic cycles.
© 2018 The Author(s).
Conflict of interest statement
The authors declare no competing interests.
Figures
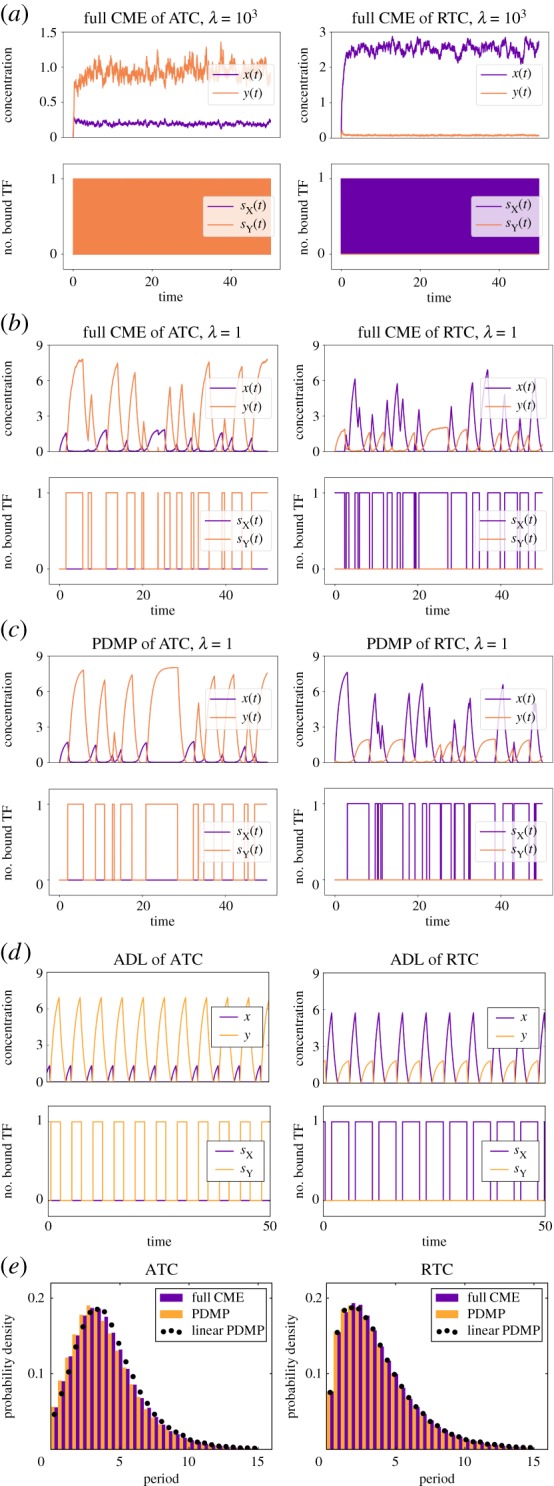
 ). (c) Sample paths of the constructed piecewise deterministic Markov process when λ = 1 (§2.4). (d) The alternative deterministic limit of the processes (§2.8). (e) Quantification of the periods of the stochastic cycles. (Online version in colour.)
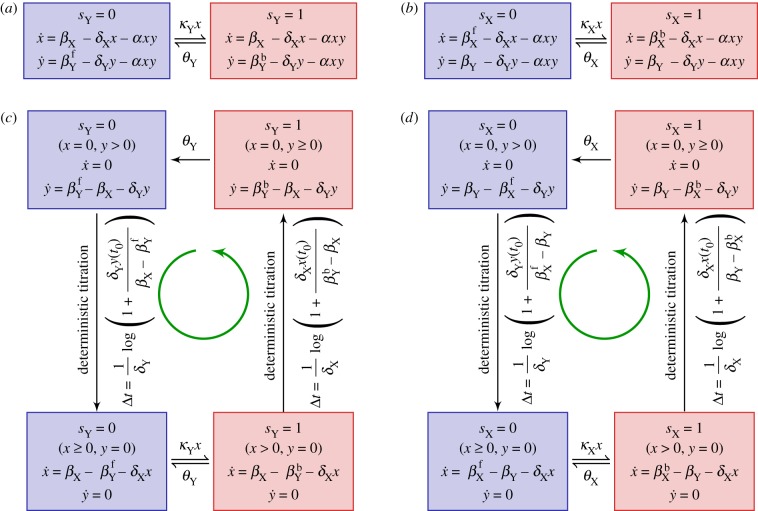
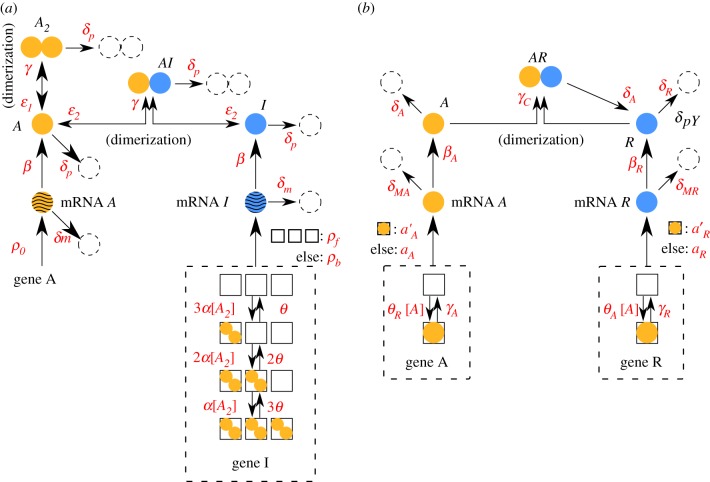
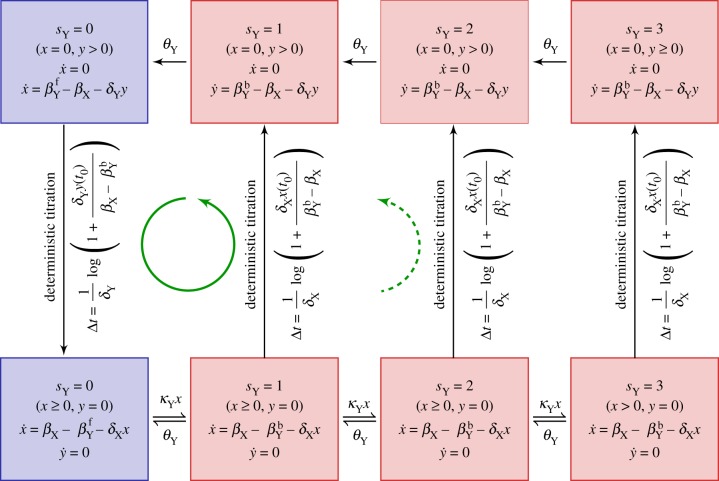
 . The linearized PDMP for ATC and RTC are shown in (c) and (d), respectively, where the green circular arrows indicates the direction of the emergent stochastic cycles. Dark blue
  and light red
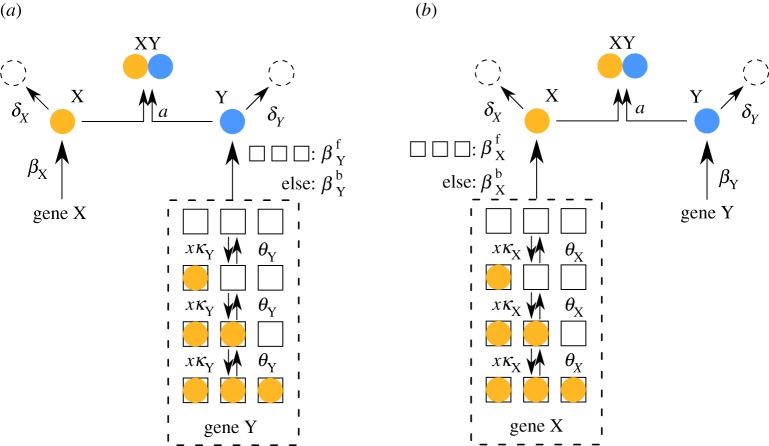
  boxes denote promoter states with different production rates where
  and
and  , respectively. The transitions between the two regimes
  and (
and ( ) are due to titration. (Online version in colour.)
 ) in the non-adiabatic regime. The green (circular) arrows indicates the emergent cycles which are predominantly observed in the simulations. The path of the dotted arrow is also observed, but less frequently (figure 11b). (Online version in colour.)
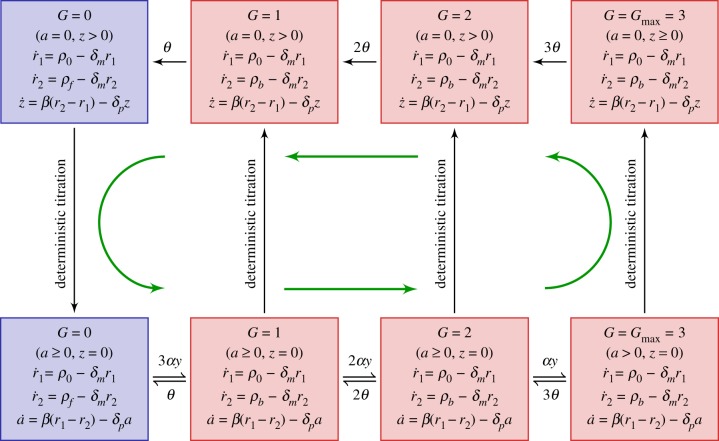
 and
and  . Green (circular) arrows indicate the direction of the emergent cycle which are frequently observed. (Online version in colour.)
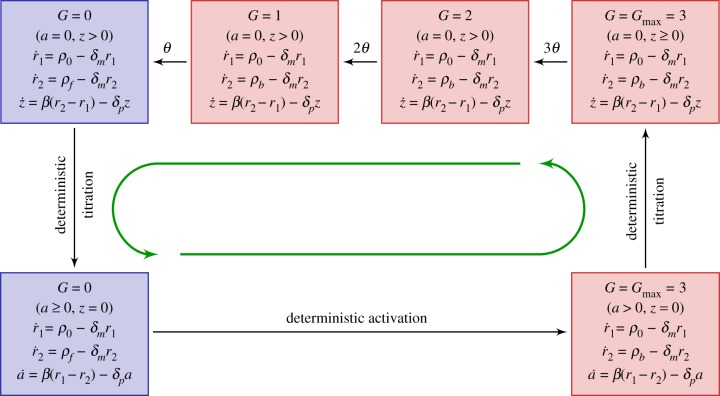
 . (c) Sample paths of the constructed piecewise deterministic Markov process when λ = 1 (§2.4). (d) The alternative deterministic limit of the processes (§2.8). (e) Quantification of the periods of the stochastic cycles. (Online version in colour.)
Similar articles
-
Limit theorems for generalized density-dependent Markov chains and bursty stochastic gene regulatory networks.J Math Biol. 2020 Mar;80(4):959-994. doi: 10.1007/s00285-019-01445-1. Epub 2019 Nov 21. J Math Biol. 2020. PMID: 31754779
-
Role of DNA binding sites and slow unbinding kinetics in titration-based oscillators.Phys Rev E Stat Nonlin Soft Matter Phys. 2015 Dec;92(6):062712. doi: 10.1103/PhysRevE.92.062712. Epub 2015 Dec 22. Phys Rev E Stat Nonlin Soft Matter Phys. 2015. PMID: 26764732 Free PMC article.
-
Sensitivity Analysis for Multiscale Stochastic Reaction Networks Using Hybrid Approximations.Bull Math Biol. 2019 Aug;81(8):3121-3158. doi: 10.1007/s11538-018-0521-4. Epub 2018 Oct 9. Bull Math Biol. 2019. PMID: 30302636
-
Stochastic Hybrid Systems in Cellular Neuroscience.J Math Neurosci. 2018 Aug 22;8(1):12. doi: 10.1186/s13408-018-0067-7. J Math Neurosci. 2018. PMID: 30136005 Free PMC article. Review.
-
A comparative analysis of synthetic genetic oscillators.J R Soc Interface. 2010 Nov 6;7(52):1503-24. doi: 10.1098/rsif.2010.0183. Epub 2010 Jun 30. J R Soc Interface. 2010. PMID: 20591848 Free PMC article. Review.
Cited by
-
Exact and efficient hybrid Monte Carlo algorithm for accelerated Bayesian inference of gene expression models from snapshots of single-cell transcripts.J Chem Phys. 2019 Jul 14;151(2):024106. doi: 10.1063/1.5110503. J Chem Phys. 2019. PMID: 31301707 Free PMC article.
-
Generalizing Gillespie's Direct Method to Enable Network-Free Simulations.Bull Math Biol. 2019 Aug;81(8):2822-2848. doi: 10.1007/s11538-018-0418-2. Epub 2018 Mar 28. Bull Math Biol. 2019. PMID: 29594824 Free PMC article.
-
Periodic synchronization of isolated network elements facilitates simulating and inferring gene regulatory networks including stochastic molecular kinetics.BMC Bioinformatics. 2022 Jan 5;23(1):13. doi: 10.1186/s12859-021-04541-6. BMC Bioinformatics. 2022. PMID: 34986805 Free PMC article.
-
Scaling methods for accelerating kinetic Monte Carlo simulations of chemical reaction networks.J Chem Phys. 2019 Jun 28;150(24):244101. doi: 10.1063/1.5096774. J Chem Phys. 2019. PMID: 31255063 Free PMC article.
-
Rare-event sampling of epigenetic landscapes and phenotype transitions.PLoS Comput Biol. 2018 Aug 3;14(8):e1006336. doi: 10.1371/journal.pcbi.1006336. eCollection 2018 Aug. PLoS Comput Biol. 2018. PMID: 30074987 Free PMC article.
References
Publication types
MeSH terms
Grants and funding
LinkOut - more resources
Full Text Sources
Other Literature Sources
