

Giant Cell Tumors of the Bone: Changes in Image Features after Denosumab Administration
- PMID: 29386457
- PMCID: PMC6196302
- DOI: 10.2463/mrms.mp.2017-0072
Giant Cell Tumors of the Bone: Changes in Image Features after Denosumab Administration
Abstract
Purpose: To assess the clinical importance in the feature change in giant cell tumors of the bone (GCTB) after denosumab treatment, detected by MRI.
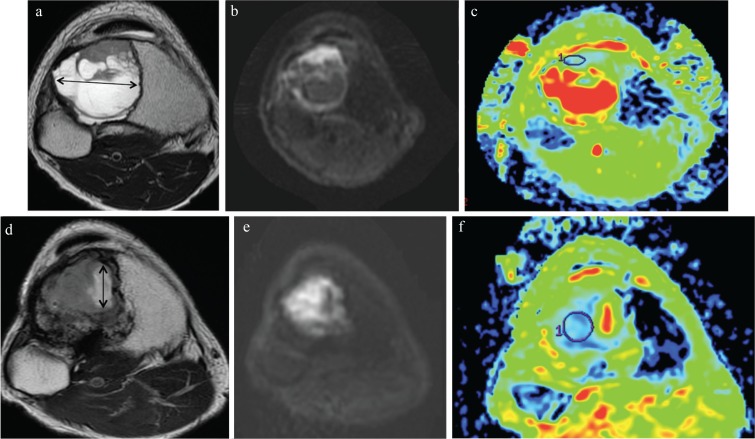
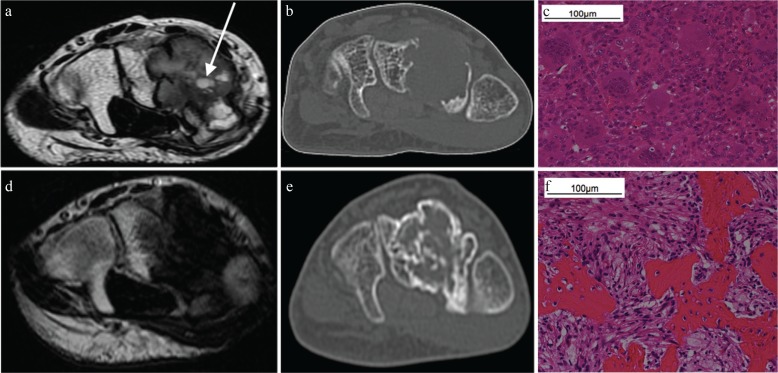
Methods: In 12 patients, MRI and CT of GCTB obtained before and after the treatment retrospectively compared. The tumor size, the signal intensity (SI) ratio between the solid part of the GCTB and muscle, cystic part size, gadolinium enhancement and apparent diffusion coefficient (ADC) value were measured on MRI. The bone formation in the tumor was observed on CT and X-ray.
Results: The mean number of denosumab injections was 19 ± 10. The follow-up period was up to 2 years. One case showed partial remission, while the other 11 cases were stable. A mean SI ratio on T2-weighted image statistically significantly decreased from 3.9 to 1.9 after the treatment. A cystic component in the tumor was observed in five cases before the treatment, and the diameter of the cystic part decreased after the treatment in 80% of cases (4/5). All the tumors showed contrast enhancement on T1-weighted image pre- and post-treatment (11/11). The averaged ADC values were 1.52 × 10⁻³ mm2/s before and 1.44 × 10⁻³ mm2/s after the treatment (P = 0.63). Bone formation in the tumor was observed in 58% of cases (7/12).
Conclusion: The decrease of SI ratio on T2-weighted image, shrinkage of cystic part and bone formation should be regarded as the effectiveness of denosumab treatment despite of no substantial change in the tumor size.
Keywords: denosumab; giant cell tumor of bone; magnetic resonance imaging.
Conflict of interest statement
The authors declare that they have no conflicts of interest.
Figures
Similar articles
-
Radiological findings of denosumab treatment for giant cell tumours of bone.Skeletal Radiol. 2020 Sep;49(9):1345-1358. doi: 10.1007/s00256-020-03449-1. Epub 2020 Apr 26. Skeletal Radiol. 2020. PMID: 32335707 Free PMC article. Review.
-
Response evaluation of giant-cell tumor of bone treated by denosumab: Histogram and texture analysis of CT images.J Orthop Sci. 2018 May;23(3):570-577. doi: 10.1016/j.jos.2018.01.006. Epub 2018 Feb 9. J Orthop Sci. 2018. PMID: 29429890
-
Assessment of denosumab treatment effects and imaging response in patients with giant cell tumor of bone.World J Surg Oncol. 2018 Sep 19;16(1):191. doi: 10.1186/s12957-018-1478-3. World J Surg Oncol. 2018. PMID: 30231890 Free PMC article.
-
Giant cell tumor of the thoracic spine completely removed by total spondylectomy after neoadjuvant denosumab therapy.Eur Spine J. 2017 May;26(Suppl 1):236-242. doi: 10.1007/s00586-017-5086-7. Epub 2017 Apr 10. Eur Spine J. 2017. PMID: 28396950
-
Morphologic Changes After Denosumab Therapy in Patients with Giant Cell Tumor of the Spine: Report of Four Cases and a Review of the Literature.World Neurosurg. 2019 Jul;127:38-46. doi: 10.1016/j.wneu.2019.03.185. Epub 2019 Mar 26. World Neurosurg. 2019. PMID: 30926552 Review.
Cited by
-
Integration of denosumab therapy in the management of giant cell tumors of bone.J Orthop. 2020 Mar 28;22:38-47. doi: 10.1016/j.jor.2020.03.020. eCollection 2020 Nov-Dec. J Orthop. 2020. PMID: 32280167 Free PMC article. Review.
-
Denosumab in Giant Cell Tumor of Bone: Multidisciplinary Medical Management Based on Pathophysiological Mechanisms and Real-World Evidence.Cancers (Basel). 2022 May 4;14(9):2290. doi: 10.3390/cancers14092290. Cancers (Basel). 2022. PMID: 35565419 Free PMC article. Review.
-
Giant cell tumor of a rib following denosumab treatment.Radiol Case Rep. 2018 Jun 1;13(5):1018-1020. doi: 10.1016/j.radcr.2018.04.005. eCollection 2018 Oct. Radiol Case Rep. 2018. PMID: 30228835 Free PMC article.
-
The efficacy and safety of short-course neoadjuvant denosumab for en bloc spondylectomy in spinal giant cell tumor of bone: a preliminary report.Eur Spine J. 2023 Dec;32(12):4297-4305. doi: 10.1007/s00586-023-07770-w. Epub 2023 Jun 15. Eur Spine J. 2023. PMID: 37318598
-
Radiological findings of denosumab treatment for giant cell tumours of bone.Skeletal Radiol. 2020 Sep;49(9):1345-1358. doi: 10.1007/s00256-020-03449-1. Epub 2020 Apr 26. Skeletal Radiol. 2020. PMID: 32335707 Free PMC article. Review.
References
-
- Raskin KA, Schwab JH, Mankin HJ, Springfield DS, Hornicek FJ. Giant cell tumor of bone. J Am Acad Orthop Surg 2013; 21:118–126. - PubMed
-
- Roux S, Amazit L, Meduri G, Guiochon-Mantel A, Milgrom E, Mariette X. RANK (receptor activator of nuclear factor kappa B) and RANK ligand are expressed in giant cell tumors of bone. Am J Clin Pathol 2002; 117:210–216. - PubMed
MeSH terms
Substances
LinkOut - more resources
Full Text Sources
Other Literature Sources