. 2018 Jan 31;9(1):446.
doi: 10.1038/s41467-017-02733-4.

Hexokinase-2 depletion inhibits glycolysis and induces oxidative phosphorylation in hepatocellular carcinoma and sensitizes to metformin

Affiliations

Hexokinase-2 depletion inhibits glycolysis and induces oxidative phosphorylation in hepatocellular carcinoma and sensitizes to metformin

Dannielle DeWaal et al. Nat Commun. .

Erratum in

Abstract

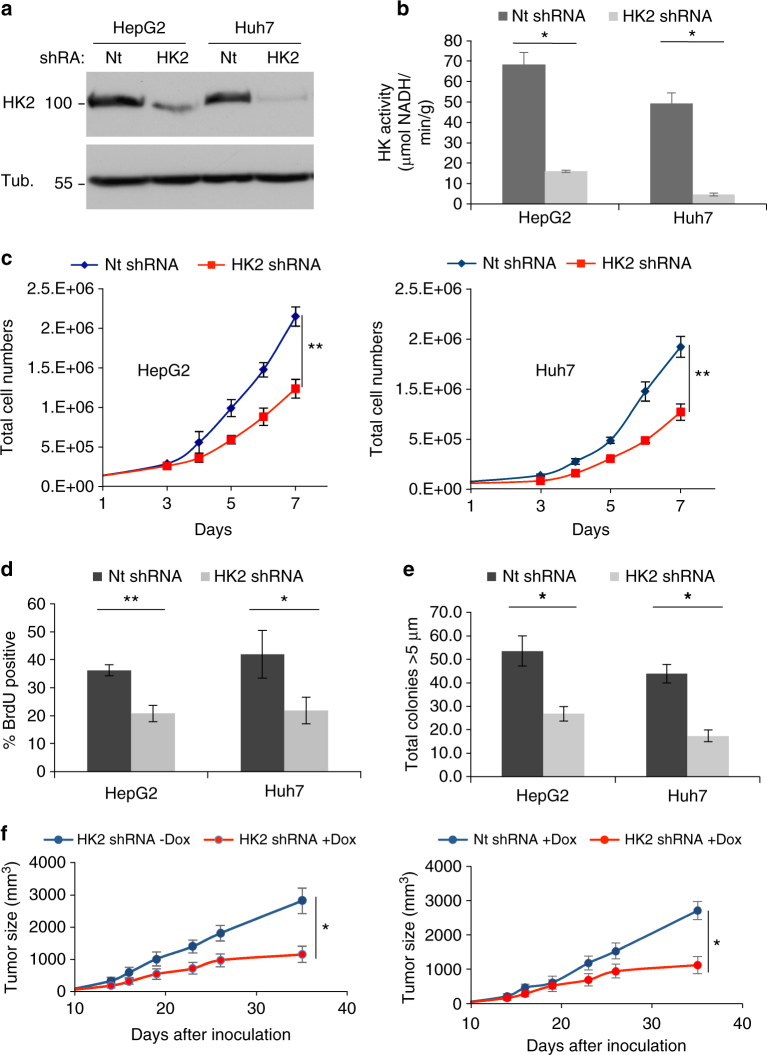
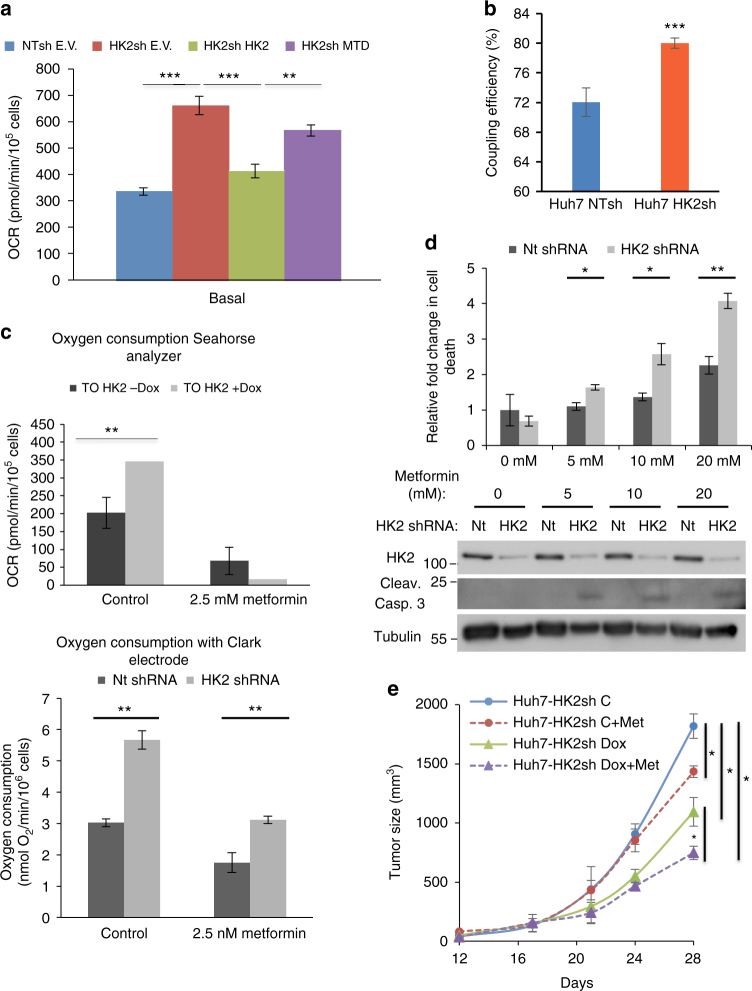
Hepatocellular carcinoma (HCC) cells are metabolically distinct from normal hepatocytes by expressing the high-affinity hexokinase (HK2) and suppressing glucokinase (GCK). This is exploited to selectively target HCC. Hepatic HK2 deletion inhibits tumor incidence in a mouse model of hepatocarcinogenesis. Silencing HK2 in human HCC cells inhibits tumorigenesis and increases cell death, which cannot be restored by GCK or mitochondrial binding deficient HK2. Upon HK2 silencing, glucose flux to pyruvate and lactate is inhibited, but TCA fluxes are maintained. Serine uptake and glycine secretion are elevated suggesting increased requirement for one-carbon contribution. Consistently, vulnerability to serine depletion increases. The decrease in glycolysis is coupled to elevated oxidative phosphorylation, which is diminished by metformin, further increasing cell death and inhibiting tumor growth. Neither HK2 silencing nor metformin alone inhibits mTORC1, but their combination inhibits mTORC1 in an AMPK-independent and REDD1-dependent mechanism. Finally, HK2 silencing synergizes with sorafenib to inhibit tumor growth.


Conflict of interest statement

The authors declare no competing financial interests.

Figures

Fig. 1
Fig. 1
HK2 in the development of HCC. a Immunocytochemistry (IHC) for HK2 in human patient samples at various stages of liver disease (inserts show x3 magnfication). b Upper panel- quantification of HK2 expression in cirrhosis dysplasia and HCC. Significant differences for HCC (p < 0.001) and dysplasia (p = 0.001) vs. controls. No significant difference between cirrhosis and controls (p = 0.123 by Friedman test, cirrhosis (n = 106), dysplasia (n = 143), HCC (n = 45), and normal (n = 6)). Lower panel—quantification of HK2 expression within different grades of HCC. Poorly differentiated vs. well differentiated, p = 0.001. Moderately differentiated vs. well differentiated, p = 0.028 by ANOVA. Quantification is based on HK2 expression analysis of 312 samples from 151 patients exhibiting liver disease with different etiologies. For both panels box plot center line represents mean, box limits represent 25% and 75% confidence limits, and whiskers extend to the minimum and maximum values. c Two-week-old HK2F/F and HK2F/F;AlbCre male mice were injected with DEN (25 mg/kg). Nine months after DEN injection, mice were analyzed. Upper panel—representative liver images. Bottom panel—representative H&E stained tumor section (arrows indicate tumors). d Images of liver sections showing BrdU incorporation (left panel), and quantification (right panel). Scale bars: 100 µm (20× objective). Results are presented as the mean ± SEM percentage of positively stained cells from four section fields. ***p < 0.001 versus HK2 F/F/, by Student’s t-test. e Quantification of tumor incidence as measured by the number of tumors greater than or equal to 1.0 mm. The number of mice in each group is indicated. *p < 0.05 versus HK2 F/F, by Student’s t-test
Fig. 2
Fig. 2
Effect of HK2 knockdown on tumorigenicity of human HCC cells. a Immunoblot analysis of inducible HK2 KD in HepG2 and Huh7 cells. b In vitro hexokinase activity assays upon inducible HK2 KD. c Cell proliferation curves. d BrdU incorporation analysis. Bar graphs show the percentage of BrdU-positive cells. e Anchorage-independent growth on soft agar. The cells were exposed to Dox for 3 days prior to analysis and maintained in Dox throughout the analyses. Bar graphs show the number of colonies larger than 5 μm. f In vivo tumor growth. Cells were inoculated into mice; after tumor detection, mice were fed either regular chow diet or with a Dox-infused diet. The left panel shows tumor growth of the Huh7 cells with inducible HK KD in either the absence or presence of Dox, and the right panel shows the tumor growth of the inducible HK KD in the presence of Dox compared to tumor growth of control cells in the presence of Dox (n = 6). Nt and HK2 shRNA indicate Dox-inducible non-targeting and HK2 shRNA, respectively. See Methods for experimental details. The results represent mean ± SEM, *p < 0.05, **p < 0.01, by Student’s t-test
Fig. 3
Fig. 3
Replacement of endogenous HK2 with WT and HK2 mutants, and GCK. a Immunoblot analysis of engineered Huh7 cell lines for both endogenous HK2 KD and overexpression of different hexokinase isoforms. HA-tagged WT rat HK2 and mutants, resistant to silencing by human shRNA, and HA-tagged GCK were stably expressed in Huh7 cells expressing Dox-inducible HK2 shRNA. EV—empty vector, MTD—mitochondrial binding deficient mutant, SA—kinase dead mutant. b Analysis of in vitro hexokinase activity in the engineered stable cell lines. c Relative BrdU incorporation assay in the engineered cell lines. d AIG analysis in engineered cell lines. e, f Seahorse metabolic analysis (ECAR) of control cells (shNt EV), HK2 KD cells (shHK2 EV), shHK2 EV cells expressing WT HK2 (shHK2 HK2), expressing mitochondrial binding deficient mutant (shHK2 MTD), or glucokinase (shHK2 GCK). The cells were exposed to Dox for 3 days prior to analysis. The results are presented as the mean ± SEM; **p < 0.01 vs. Nt EV $p > 0.07 vs. EV—Dox; #p < 0.05, and ##p < 0.01 vs. EV + Dox, by Student’s t-test. Experiments were performed at least twice in triplicates
Fig. 4
Fig. 4
HK2 knockdown in Huh7 cells reduces glycolysis flux to lactate. a Glucose and glutamine uptake rates and lactate secretion rate in Huh7 cells expressing HK2-targeting shRNA (HK2), or non-targeting shRNA (Nt), under induced conditions (+Dox) or non-induced conditions (−Dox) (n = 8, biological replicates). b Uptake and secretion rates of pyruvate and amino acids (n = 8, biological replicates). c Mass isotopomer analysis of extracellular lactate in cultures with [1,2-13C]glucose and unlabeled glutamine (n = 2, biological replicates). d Mass isotopomer analysis of citrate in cells cultured with [U-13C]glutamine and unlabeled glucose (n = 2, biological replicates). e Mass isotopomer analysis of malate in cells cultured with [U-13C]glutamine and unlabeled glucose (n = 2, biological replicates). f Mass isotopomer analysis of extracellular lactate in cultures with [U-13C]glutamine and unlabeled glucose (n = 2, biological replicates). g Predominant metabolic pathways of glucose and glutamine metabolism in mammalian cells. h Metabolic flux distributions in Huh7 cells (HK2 - Dox) and Huh7 cells with HK2 knockdown (HK2 + Dox). Fluxes were determined by integrating uptake and secretion rates and isotopic labeling data from [1,2-13C]glucose and [U-13C]glutamine tracer experiments by metabolic flux analysis. Arrow widths indicate absolute magnitudes of net fluxes (nmol/106 cells/h). Complete mass isotopomer distributions are shown in the Supplementary Data. All data represent the mean ± SD, **p < 0.001 by Welch’s unequal variances t-test
Fig. 5
Fig. 5
Changes in serine metabolism by HK2 loss. a Changes in extracellular serine uptake and glycine secretion after inducible HK2 KD (HK2 + DOX). b Tracing of [1,2-13C]glucose to serine. c Tracing of [1,2-13C]glucose to glycine. d Schematic showing [1,2-13C]glucose /serine/glycine tracing and serine/glycine exchange. All data represent the mean ± SD, **p < 0.001 by Welch’s unequal variances t-test. e Cell proliferation after inducible HK2 KD (HK2sh) or control (Ntsh) Huh7 cells in the presence or absence of serine. Cells were exposed to Dox for 4 days prior to analysis and maintained in Dox throughout the analyses. Bar graph shows relative cell number after 6 days of growth in serine-free media compared to cell number in complete media. The results represent mean ± SEM of two different experiments in triplicate, **p < 0.01 by Student’s t-test
Fig. 6
Fig. 6
Effect of HK2 KD and metformin on Huh7 HCC cells. a Seahorse metabolic analysis of oxygen consumption rates (OCR). b Coupling efficiency as calculated from OCR data generated with Seahorse analyzer, as the ratio between ATP-linked respiration and basal respiration rate. Data are the average of two experiments done in quadruplet. c The effect of metformin on oxygen consumption as measured by the Seahorse analyzer (upper panel) and by the Clark electrode (lower panel). Cells were treated with the indicated concentrations of metformin for 24 h. d Cell death after HK2 KD in combination with metformin, upper panel—quantification of PI staining, lower panel—caspase 3 cleavage. e Huh7 cells with Dox-inducible HK2 shRNA were subjected to subcutaneous tumor growth. After tumor appearance, mice were exposed to either a Dox-infused diet alone, metformin alone or both. Tumor size was measured every 4 days, and tumor growth was plotted (n = 4 per each treatment). The results represent mean ± SEM, *p < 0.05, **p < 0.01 ***p < 0.005 by Student’s t-test
Fig. 7
Fig. 7
Effect of HK2 KD and metformin on mTORC1 activity in HCC cells. Cells were exposed to Dox for three days and metformin for the last 24 h. a Immunoblot showing the effect of HK2 KD and metformin on mTORC1 activity as measured by the phosphorylation of S6K1 and 4EBP1 and on AMPK activity as measured by the phosphorylation of ACC, in Huh7 cells. b Immunoblot showing the effect HK KD and metformin on mTORC1 activity after the KD of AMPKα1 and α2. c Immunoblot showing the induction of REDD1 expression after HK2 KD and metformin Huh7 cells. d Immunoblot showing the induction of REDD1 expression after HK2 KD and metformin HepG2 cells. e The effect of REDD1 KD on mTORC1 activity after HK2 KD and metformin as measured by S6K1 and 4EBP1 phosphorylation or S6 phosphorylation. AMPK kinase activity was evaluated by ACC phosphorylation (left panel) and by Raptor phosphorylation (right panel). Immunoblot images are representative of at least two independent experiments. f Schematic showing the mechanism by which the combination of HK2 KD and metformin inhibits mTORC1
Fig. 8
Fig. 8
Effect of HK2 KD and sorafenib on cell death and tumor growth. a The effect of HK2 KD in combination with sorafenib on cell death of Huh7 cells. b Tumor growth in vivo of Huh7 cells expressing Dox-inducible HK2 shRNA in the absence or presence of a Dox-infused diet and in the presence or absence of sorafenib treatment. Note that monitoring the growth of tumors in control mice was stopped because once humane end-point criterion was reached the mice were killed. c Ratio of tumor to body weight at the end-point for control mice and at the last time point for treated mice. d Quantification of cleaved caspase 3 in the tumor sections. Results represent mean ± SEM, significance marked by * is to no Dox control and # to Dox control, */#p < 0.05, **p < 0.01, ***p < 0.001 by Student’s t-test

References

    1. Cabibbo G, Latteri F, Antonucci M, Craxi A. Multimodal approaches to the treatment of hepatocellular carcinoma. Nat. Clin. Pract. Gastroenterol. Hepatol. 2009;6:159–169. doi: 10.1038/ncpgasthep1357. - DOI - PubMed
    1. Singh S, Singh PP, Roberts LR, Sanchez W. Chemopreventive strategies in hepatocellular carcinoma. Nat. Rev. Gastroenterol. Hepatol. 2014;11:45–54. doi: 10.1038/nrgastro.2013.143. - DOI - PMC - PubMed
    1. Hay N. Reprogramming glucose metabolism in cancer: can it be exploited for cancer therapy? Nat. Rev. Cancer. 2016;16:635–649. doi: 10.1038/nrc.2016.77. - DOI - PMC - PubMed
    1. Robey RB, Hay N. Mitochondrial hexokinases, novel mediators of the antiapoptotic effects of growth factors and Akt. Oncogene. 2006;25:4683–4696. doi: 10.1038/sj.onc.1209595. - DOI - PubMed
    1. Wilson JE. Isozymes of mammalian hexokinase: structure, subcellular localization and metabolic function. J. Exp. Biol. 2003;206:2049–2057. doi: 10.1242/jeb.00241. - DOI - PubMed

Publication types

MeSH terms