

Angiogenesis and evading immune destruction are the main related transcriptomic characteristics to the invasive process of oral tongue cancer
- PMID: 29386520
- PMCID: PMC5792437
- DOI: 10.1038/s41598-017-19010-5
Angiogenesis and evading immune destruction are the main related transcriptomic characteristics to the invasive process of oral tongue cancer
Abstract
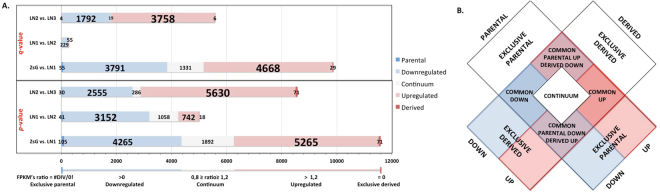
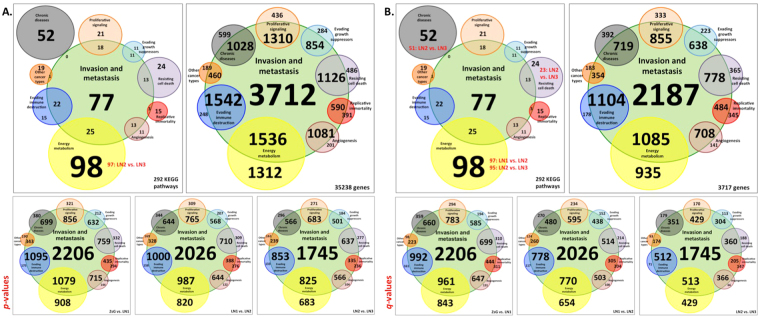
Metastasis of head and neck tumors is responsible for a high mortality rate. Understanding its biochemistry may allow insights into tumorigenesis. To that end we carried out RNA-Seq analyses of 5 SCC9 derived oral cancer cell lines displaying increased invasive potential. Differentially expressed genes (DEGs) were annotated based on p-values and false discovery rate (q-values). All 292 KEGG pathways related to the human genome were compared in order to pinpoint the absolute and relative contributions to the invasive process considering the 8 hallmarks of cancer plus 2 new defined categories, as well as we made with our transcriptomic data. In terms of absolute contribution, the highest correlations were associated to the categories of evading immune destruction and energy metabolism and for relative contributions, angiogenesis and evading immune destruction. DEGs were distributed into each one of all possible modes of regulation, regarding up, down and continuum expression, along the 3 stages of metastatic progression. For p-values twenty-six genes were consistently present along the tumoral progression and 4 for q-values. Among the DEGs, we found 2 novel potentially informative metastatic markers: PIGG and SLC8B1. Furthermore, interactome analysis showed that MYH14, ANGPTL4, PPARD and ENPP1 are amenable to pharmacological interventions.
Conflict of interest statement
The authors declare that they have no competing interests.
Figures


Similar articles
-
Dynamic changes in the gene expression profile during rat oral carcinogenesis induced by 4-nitroquinoline 1-oxide.Mol Med Rep. 2016 Mar;13(3):2561-9. doi: 10.3892/mmr.2016.4883. Epub 2016 Feb 8. Mol Med Rep. 2016. PMID: 26860129 Free PMC article.
-
Gene expression profiles and protein‑protein interaction networks during tongue carcinogenesis in the tumor microenvironment.Mol Med Rep. 2018 Jan;17(1):165-171. doi: 10.3892/mmr.2017.7843. Epub 2017 Oct 20. Mol Med Rep. 2018. PMID: 29115421 Free PMC article.
-
Transcriptomic profiles of tumor-associated neutrophils reveal prominent roles in enhancing angiogenesis in liver tumorigenesis in zebrafish.Sci Rep. 2019 Feb 6;9(1):1509. doi: 10.1038/s41598-018-36605-8. Sci Rep. 2019. PMID: 30728369 Free PMC article.
-
The downregulation of ANGPTL4 inhibits the migration and proliferation of tongue squamous cell carcinoma.Arch Oral Biol. 2016 Nov;71:144-149. doi: 10.1016/j.archoralbio.2016.07.011. Epub 2016 Aug 2. Arch Oral Biol. 2016. PMID: 27505034
-
The contribution of tumour-derived exosomes to the hallmarks of cancer.Crit Rev Clin Lab Sci. 2016;53(2):121-31. doi: 10.3109/10408363.2015.1092496. Epub 2015 Oct 19. Crit Rev Clin Lab Sci. 2016. PMID: 26479834 Review.
Cited by
-
Variation of Long Non-Coding RNA And mRNA Profiles in Breast Cancer Cells With Influences of Adipocytes.Front Oncol. 2021 May 21;11:631551. doi: 10.3389/fonc.2021.631551. eCollection 2021. Front Oncol. 2021. PMID: 34094912 Free PMC article.
-
Transcriptome Related to Avoiding Immune Destruction in Nasopharyngeal Cancer in Indonesian Patients Using Next-Generation Sequencing.Asian Pac J Cancer Prev. 2020 Sep 1;21(9):2593-2601. doi: 10.31557/APJCP.2020.21.9.2593. Asian Pac J Cancer Prev. 2020. PMID: 32986357 Free PMC article.
-
A review of the multifunctionality of angiopoietin-like 4 in eye disease.Biosci Rep. 2018 Sep 13;38(5):BSR20180557. doi: 10.1042/BSR20180557. Print 2018 Oct 31. Biosci Rep. 2018. PMID: 30049845 Free PMC article. Review.
-
Expression of nonmuscle myosin IIC is regulated by non-canonical binding activity of miRNAs.iScience. 2023 Nov 2;26(12):108384. doi: 10.1016/j.isci.2023.108384. eCollection 2023 Dec 15. iScience. 2023. PMID: 38047082 Free PMC article.
-
From Myricetin to the Discovery of Novel Natural Human ENPP1 Inhibitors: A Virtual Screening, Molecular Docking, Molecular Dynamics Simulation, and MM/GBSA Study.Molecules. 2022 Sep 21;27(19):6175. doi: 10.3390/molecules27196175. Molecules. 2022. PMID: 36234712 Free PMC article.
References
-
- Ferlay, J., Soerjomataram, I., Dikshit, R. & Eser, S. Mortality World Wide: IARC CancerBase, E. M. Cancer Incidence and Mortality Worldwide: IARC CancerBase No. 11. Globocan 2012v1.0 accessed on 12/08/2014-accessed on 12/08/2014, http://globocan.iarc.fr/Pages/fact_sheets_cancer.aspx (2013).
-
- National Cancer Institute, S. S. B. Cancer Incidence – Surveillance, Epidemiology, and End Results (SEER) Registries Research Data. Surveillance, Epidemiology, and End Results (SEER) Program (http://www.seer.cancer.gov). Available at: http://seer.cancer.gov/data/metadata.html (2007).
Publication types
MeSH terms
LinkOut - more resources
Full Text Sources
Other Literature Sources
Miscellaneous
