. 2018 Jan 31;8(1):1999.
doi: 10.1038/s41598-018-20112-x.

Nonlinear mixed-modelling discriminates the effect of chemicals and their mixtures on zebrafish behavior

Affiliations

Nonlinear mixed-modelling discriminates the effect of chemicals and their mixtures on zebrafish behavior

Patrick T Gauthier et al. Sci Rep. .

Abstract

Zebrafish (Danio rerio) early-life stage behavior has the potential for high-throughput screening of neurotoxic environmental contaminants. However, zebrafish embryo and larval behavioral assessments typically utilize linear analyses of mean activity that may not capture the complexity of the behavioral response. Here we tested the hypothesis that nonlinear mixed-modelling of zebrafish embryo and larval behavior provides a better assessment of the impact of chemicals and their mixtures. We demonstrate that zebrafish embryo photomotor responses (PMRs) and larval light/dark locomotor activities can be fit by asymmetric Lorentzian and Ricker-beta functions, respectively, which estimate the magnitude of activity (e.g., maximum and total activities) and temporal aspects (e.g., duration of the responses and its excitatory periods) characterizing early life-stage zebrafish behavior. We exposed zebrafish embryos and larvae to neuroactive chemicals, including isoproterenol, serotonin, and ethanol, as well as their mixtures, to assess the feasibility of using the nonlinear mixed-modelling to assess behavioral modulation. Exposure to chemicals led to distinct effects on specific behavioral characteristics, and interactive effects on temporal characteristics of the behavioral response that were overlooked by the linear analyses of mean activity. Overall, nonlinear mixed-modelling is a more comprehensive approach for screening the impact of chemicals and chemical mixtures on zebrafish behavior.


Conflict of interest statement

The authors declare that they have no competing interests.

Figures

Figure 1
Figure 1
Representative activity data for the zebrafish embryo photomotor response (PMR; Panel a) and larval locomotor activity at 4 dpf (Panel b). Closed circles represent measured activity ± s.e.m. Green shading represents periods of light (Panel a and b). Red curves in Panels (a) and (b) depict predictions from asymmetric Lorentzian and Ricker-beta models, respectively. Estimated durations of the PMR (γ0) and excitatory period (xmax) are depicted in Panel (a) by dotted and dashed lines, respectively. Red shading in Panel (a) depict estimated total embryo activity (A) during the PMR. In Panel (b), estimated xmax and maximum activity (ymax) are depicted by vertical and horizontal dashed lines, respectively.
Figure 2
Figure 2
Asymmetric Lorentzian mixed-modelling results for embryo PMRs (Panel a). Colored curves in Panel (a) represent asymmetric Lorentzian model predictions for the fixed-effects of treatments. Green shaded areas represent 1 s pulses of light with an intensity of 57,295 lux. Characteristics of the behavioral phenotype, including mean (y¯) and total (A) activities, and the durations of the excitatory period (xmax) and PMR (γ0), are illustrated in Panels (b–e) (solid circles ± s.e.m.; n = 360). Asterisks indicate significant differences from control. Daggers represent significant interactive effects of the mixture.
Figure 3
Figure 3
Ricker-beta mixed-modelling of larval locomotor activity (Panel a). Colored curves in Panel (a) represent the Ricker-beta model predictions for the fixed effects of treatment. The green shaded area in Panel (a) represents the light period (i.e., 1800 to 3600 s), whereas the white shaded areas represent the two dark periods (i.e., 0 to 1800 s and 3600 to 5400 s). Characteristics of the phenotype, including mean (y¯) and maximum (ymax) activities, duration of excitatory period (xmax), time at maximum rate of increase in activity (xr) from LS3 (i.e., 3600 to 5400 s), are illustrated in Panels (b–e) (solid circles ± s.e.m.; n = 72). Asterisks indicate significant differences from control. Daggers represent significant interactive effects of the mixture.
Figure 4
Figure 4
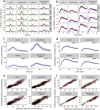
Adequacy of model fitting in terms of predicted versus observed activities and root mean square error prediction intervals. Panels (a) and (b) represent goodness of fit of the asymmetric Lorentzian and Ricker-beta mixed-models, respectively, where red curves represent within-group (i.e., random effects) predictions and blue curves represent between-group (i.e., fixed-effects) predictions. Panels (c) and (d) illustrate prediction intervals for fixed-effects (2 × root mean square errors (RMSE); grey shaded areas). Blue curves in Panels (c) and (d) are as previously described. Panels (e) and (f) illustrate the observed and predicted activities on the x- and y-axes for each treatment from the asymmetric Lorentzian (Panel c) and Ricker-beta (Panel d) models, respectively. Red lines in Panels (e) and (f) depict a 1:1 ratio of observed versus predicted values.
Figure 5
Figure 5
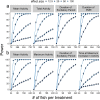
Power analyses of asymmetric Lorentzian (Panel a) and Ricker-beta (Panel b) mixed-model parameter estimates. Closed circles represent estimates of power ± 95% confidence intervals for mean activity (y¯), total activity (A), maximum activity (ymax), duration of excitatory period (xmax) and PMR (γ0), and the time at maximum rate of increase in activity (xr). Effect sizes ranging between ±12.5% to 100% of control are indicated by colour shading. The y-axis represents statistical power. The x-axis represents the number of fish per treatment (i.e., samples size). A power of 80 is considered an acceptable threshold for routine detection of statistical differences.

Similar articles

Cited by

References

    1. Nagel R. DarT: the embryo test with the zebrafish Danio rerio – a general model in ecotoxicology and toxicology. ALTEX-Altern Tierexp. 2002;19:38–38. - PubMed
    1. Kimmel CB, Ballard WW, Kimmel SR, Ullmann B, Schilling TF. Stages of embryonic development of the zebrafish. Dev. Dynam. 1995;203:253–310. doi: 10.1002/aja.1002030302. - DOI - PubMed
    1. Kalueff AV, et al. Towards a comprehensive catalog of zebrafish behavior 1.0 and beyond. Zebrafish. 2013;10:70–86. doi: 10.1089/zeb.2012.0861. - DOI - PMC - PubMed
    1. Kokel D, et al. Identification of nonvisual photomotor response cells in the vertebrate hindbrain. J. Neurosci. 2013;33:3834–3843. doi: 10.1523/JNEUROSCI.3689-12.2013. - DOI - PMC - PubMed
    1. Thompson, W. A., Arnold, V. I. & Vijayan, M. M. Venlafaxine in embryos stimulates neurogenesis and disrupts larval behavior in zebrafish. Environ. Sci. Technol. 2017, 10.1021/acs.est.7b04099. - PubMed

Publication types

MeSH terms

LinkOut - more resources