

Identification of molecular pathways and candidate genes associated with cocks' comb size trait by genome-wide transcriptome analysis
- PMID: 29386544
- PMCID: PMC5792444
- DOI: 10.1038/s41598-018-20373-6
Identification of molecular pathways and candidate genes associated with cocks' comb size trait by genome-wide transcriptome analysis
Abstract
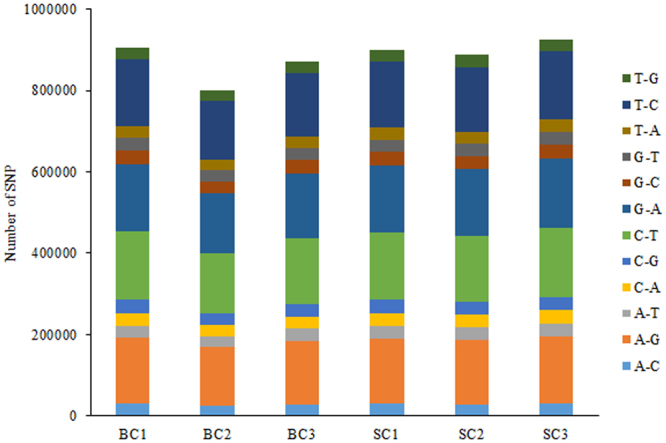
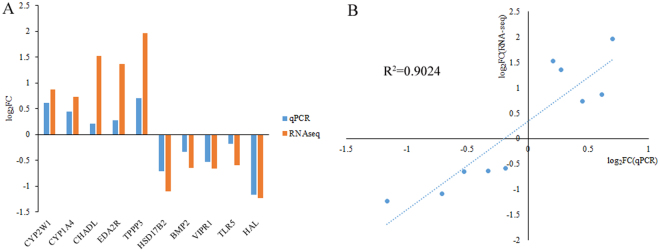
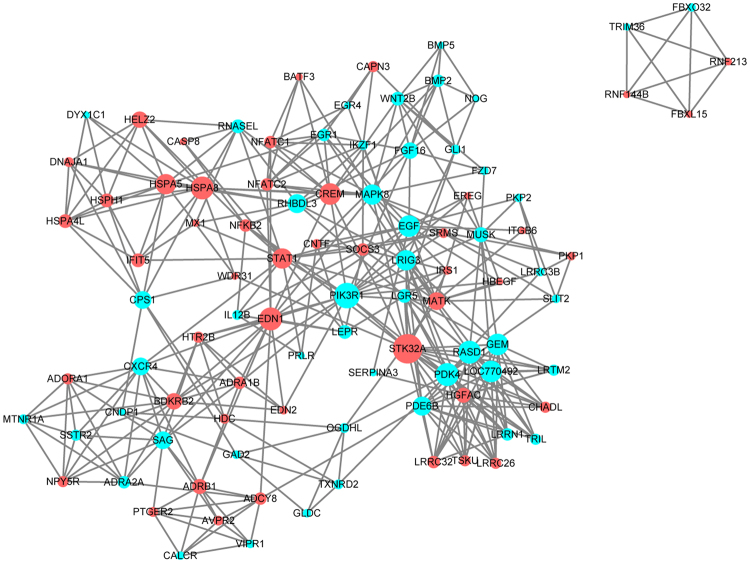
The comb of the male is an important secondary sexual characteristic. Although quantitative trait loci (QTLs) related to comb size have been identified, molecular mechanisms underlying this trait remain mostly unknown. In this study, RNA sequencing (RNA-seq) was employed to compare whole transcriptomic differences between two groups of Partridge Shank chickens that are divergent in comb sizes. A total of 563 differentially expressed genes (DEGs) were identified, including 277 up-regulated and 286 down-regulated DEGs. According to the animal QTL database, eight DEGs including BMP2 and CHADL matching the reported QTLs were associated with the comb size. Functional annotation analysis revealed that DEGs were involved in cell communication and calcium signaling. Protein-protein interaction network analysis showed that STK32A, PIK3R1, EDN1, HSPA5, and HSPA8 have an impact on comb growth. Moreover, potential alternative splicing events and single nucleotide polymorphisms were also identified. Our data provide a source for identifying genes and pathways with functions critical to comb size and accelerate studies involving molecular mechanisms of this sexual ornament.
Conflict of interest statement
The authors declare that they have no competing interests.
Figures


Similar articles
-
Genome-wide re-sequencing and transcriptome analysis reveal candidate genes associated with the pendulous comb phenotype in domestic chickens.Anim Sci J. 2020 Jan-Dec;91(1):e13308. doi: 10.1111/asj.13308. Epub 2019 Dec 5. Anim Sci J. 2020. PMID: 31808219
-
Transcriptome analysis of comb and testis from Rose-comb Silky chicken (R1/R1) and Beijing Fatty wild type chicken (r/r).Poult Sci. 2017 Jun 1;96(6):1866-1873. doi: 10.3382/ps/pew447. Poult Sci. 2017. PMID: 28339981
-
Onset of sexual maturity in female chickens is genetically linked to loci associated with fecundity and a sexual ornament.Reprod Domest Anim. 2012 Jan;47 Suppl 1:31-6. doi: 10.1111/j.1439-0531.2011.01963.x. Reprod Domest Anim. 2012. PMID: 22212210
-
A Genome-Wide mRNA Screen and Functional Analysis Reveal FOXO3 as a Candidate Gene for Chicken Growth.PLoS One. 2015 Sep 14;10(9):e0137087. doi: 10.1371/journal.pone.0137087. eCollection 2015. PLoS One. 2015. PMID: 26366565 Free PMC article.
-
Genome-Wide Association Studies for Comb Traits in Chickens.PLoS One. 2016 Jul 18;11(7):e0159081. doi: 10.1371/journal.pone.0159081. eCollection 2016. PLoS One. 2016. PMID: 27427764 Free PMC article.
Cited by
-
Regulation of IFN-γ-mediated PD-L1 expression by MYC in colorectal cancer with wild-type KRAS and TP53 and its clinical implications.Front Pharmacol. 2022 Dec 13;13:1022129. doi: 10.3389/fphar.2022.1022129. eCollection 2022. Front Pharmacol. 2022. PMID: 36582540 Free PMC article.
-
Transcriptome Profiling Unveils Key Genes Regulating the Growth and Development of Yangzhou Goose Knob.Int J Mol Sci. 2024 Apr 10;25(8):4166. doi: 10.3390/ijms25084166. Int J Mol Sci. 2024. PMID: 38673752 Free PMC article.
-
Prediction models, assessment methodologies and biotechnological tools to quantify heat stress response in ruminant livestock.Int J Biometeorol. 2019 Sep;63(9):1265-1281. doi: 10.1007/s00484-019-01735-9. Epub 2019 May 26. Int J Biometeorol. 2019. PMID: 31129758 Review.
-
Systematic Selection Signature Analysis of Chinese Gamecocks Based on Genomic and Transcriptomic Data.Int J Mol Sci. 2023 Mar 20;24(6):5868. doi: 10.3390/ijms24065868. Int J Mol Sci. 2023. PMID: 36982941 Free PMC article.
-
The effect of induced molting on the testicular physiological remodeling in no-semen roosters.BMC Genomics. 2025 Feb 28;26(1):205. doi: 10.1186/s12864-025-11340-3. BMC Genomics. 2025. PMID: 40021980 Free PMC article.
References
-
- Khan NMaSH. Comb: An important reliable visual ornamental trait for selection in chickens. Worlds Poult. Sci. J. 2012;68:425–434. doi: 10.1017/S0043933912000542. - DOI
-
- Joseph NS, Renema FER,RA, Thorsteinson KA. Comb growth during sexual maturation in female broiler breeders. J. Appl. Poult. Res. 2003;12:7–13. doi: 10.1093/japr/12.1.7. - DOI
-
- Zuk M, et al. The role of male ornaments and courtship behavior in female mate choice of Red Jungle fowl. Am. Nat. 1990;136:459–473. doi: 10.1086/285107. - DOI
Publication types
MeSH terms
Substances
LinkOut - more resources
Full Text Sources
Other Literature Sources
Molecular Biology Databases
Miscellaneous
