

Social status shapes the bacterial and fungal gut communities of the honey bee
- PMID: 29386588
- PMCID: PMC5792453
- DOI: 10.1038/s41598-018-19860-7
Social status shapes the bacterial and fungal gut communities of the honey bee
Abstract
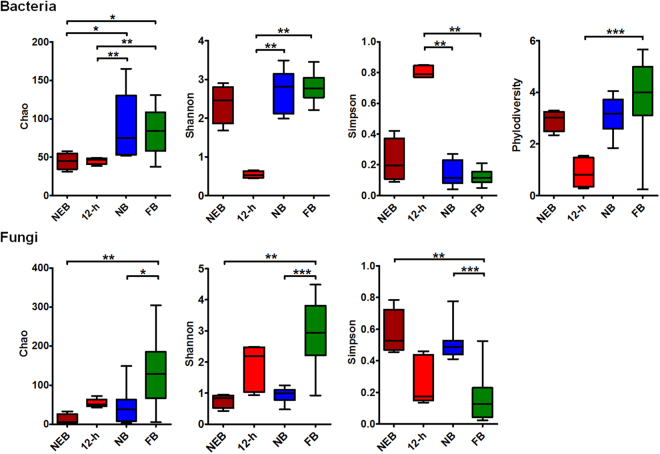
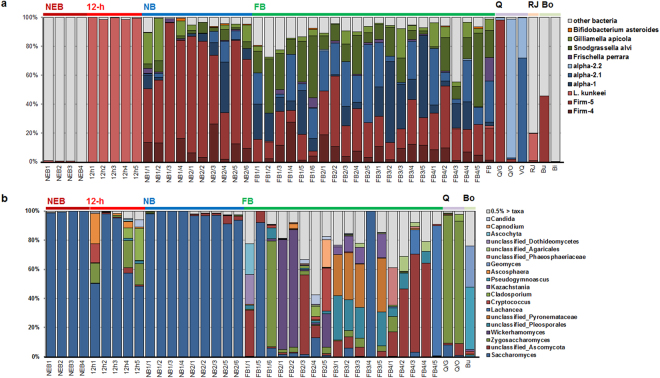
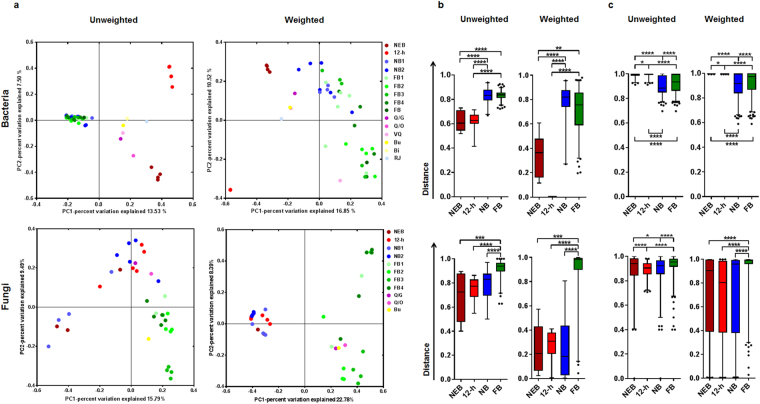
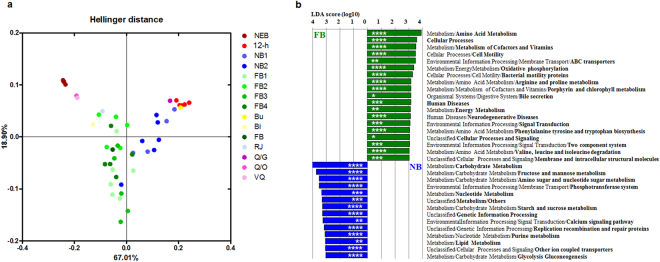
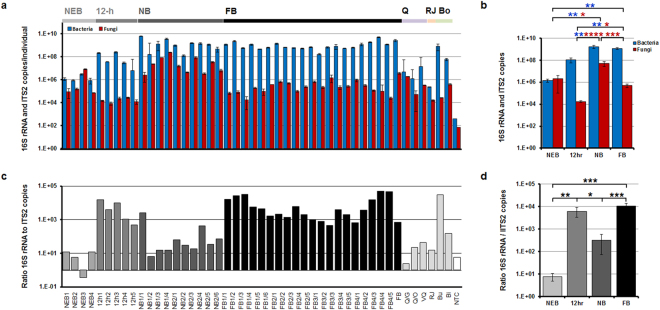
Despite the fungal abundance in honey and bee bread, little is known about the fungal gut community of the honey bee and its effect on host fitness. Using pyrosequencing of the 16S rRNA gene and ITS2 region amplicons, we analysed the bacterial and fungal gut communities of the honey bee as affected by the host social status. Both communities were significantly affected by the host social status. The bacterial gut community was similar to those characterised in previous studies. The fungal gut communities of most worker bees were highly dominated by Saccharomyces but foraging bees and queens were colonised by diverse fungal species and Zygosaccharomyces, respectively. The high fungal density and positive correlation between Saccharomyces species and Lactobacillus species, known yeast antagonists, were only observed in the nurse bee; this suggested that the conflict between Saccharomyces and Lactobacillus was compromised by the metabolism of the host and/or other gut microbes. PICRUSt analysis revealed significant differences in enriched gene clusters of the bacterial gut communities of the nurse and foraging bees, suggesting that different host social status might induce changes in the gut microbiota, and, that consequently, gut microbial community shifts to adapt to the gut environment.
Conflict of interest statement
The authors declare that they have no competing interests.
Figures
Similar articles
-
The queen's gut refines with age: longevity phenotypes in a social insect model.Microbiome. 2018 Jun 18;6(1):108. doi: 10.1186/s40168-018-0489-1. Microbiome. 2018. PMID: 29914555 Free PMC article.
-
High abundance of lactobacilli in the gut microbiome of honey bees during winter.Sci Rep. 2025 Mar 3;15(1):7409. doi: 10.1038/s41598-025-90763-0. Sci Rep. 2025. PMID: 40032901 Free PMC article.
-
Genomic changes underlying host specialization in the bee gut symbiont Lactobacillus Firm5.Mol Ecol. 2019 May;28(9):2224-2237. doi: 10.1111/mec.15075. Epub 2019 May 29. Mol Ecol. 2019. PMID: 30864192
-
Honey bees as models for gut microbiota research.Lab Anim (NY). 2018 Nov;47(11):317-325. doi: 10.1038/s41684-018-0173-x. Epub 2018 Oct 23. Lab Anim (NY). 2018. PMID: 30353179 Free PMC article. Review.
-
Gut microbial communities of social bees.Nat Rev Microbiol. 2016 Jun;14(6):374-84. doi: 10.1038/nrmicro.2016.43. Epub 2016 May 3. Nat Rev Microbiol. 2016. PMID: 27140688 Free PMC article. Review.
Cited by
-
The queen's gut refines with age: longevity phenotypes in a social insect model.Microbiome. 2018 Jun 18;6(1):108. doi: 10.1186/s40168-018-0489-1. Microbiome. 2018. PMID: 29914555 Free PMC article.
-
Low Levels of Hive Stress Are Associated with Decreased Honey Activity and Changes to the Gut Microbiome of Resident Honey Bees.Microbiol Spectr. 2023 Aug 17;11(4):e0074223. doi: 10.1128/spectrum.00742-23. Epub 2023 Jun 8. Microbiol Spectr. 2023. PMID: 37289060 Free PMC article.
-
Environmental Effects on Bee Microbiota.Microb Ecol. 2023 Oct;86(3):1487-1498. doi: 10.1007/s00248-023-02226-6. Epub 2023 Apr 26. Microb Ecol. 2023. PMID: 37099156 Review.
-
Effects of Host Plant and Insect Generation on Shaping of the Gut Microbiota in the Rice Leaffolder, Cnaphalocrocis medinalis.Front Microbiol. 2022 Apr 11;13:824224. doi: 10.3389/fmicb.2022.824224. eCollection 2022. Front Microbiol. 2022. PMID: 35479615 Free PMC article.
-
Propolis hosts a diversemicrobial community.World J Microbiol Biotechnol. 2020 Mar 10;36(3):50. doi: 10.1007/s11274-020-02827-0. World J Microbiol Biotechnol. 2020. PMID: 32157464
References
-
- Neumann P, Carreck NL. Honey bee colony losses. J Apic Res. 2010;49:1–6. doi: 10.3896/IBRA.1.49.1.01. - DOI
Publication types
MeSH terms
LinkOut - more resources
Full Text Sources
Other Literature Sources
