

Weak but Critical Links between Primary Somatosensory Centers and Motor Cortex during Movement
- PMID: 29387003
- PMCID: PMC5776089
- DOI: 10.3389/fnhum.2018.00001
Weak but Critical Links between Primary Somatosensory Centers and Motor Cortex during Movement
Abstract
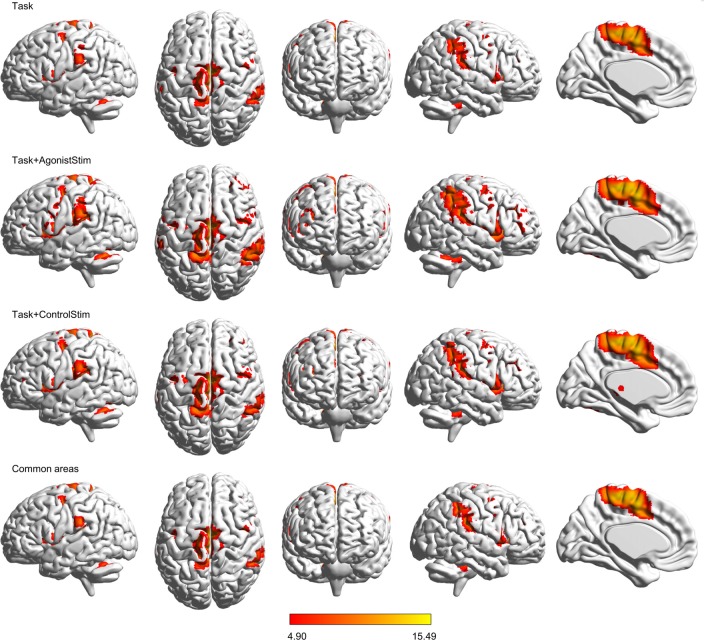
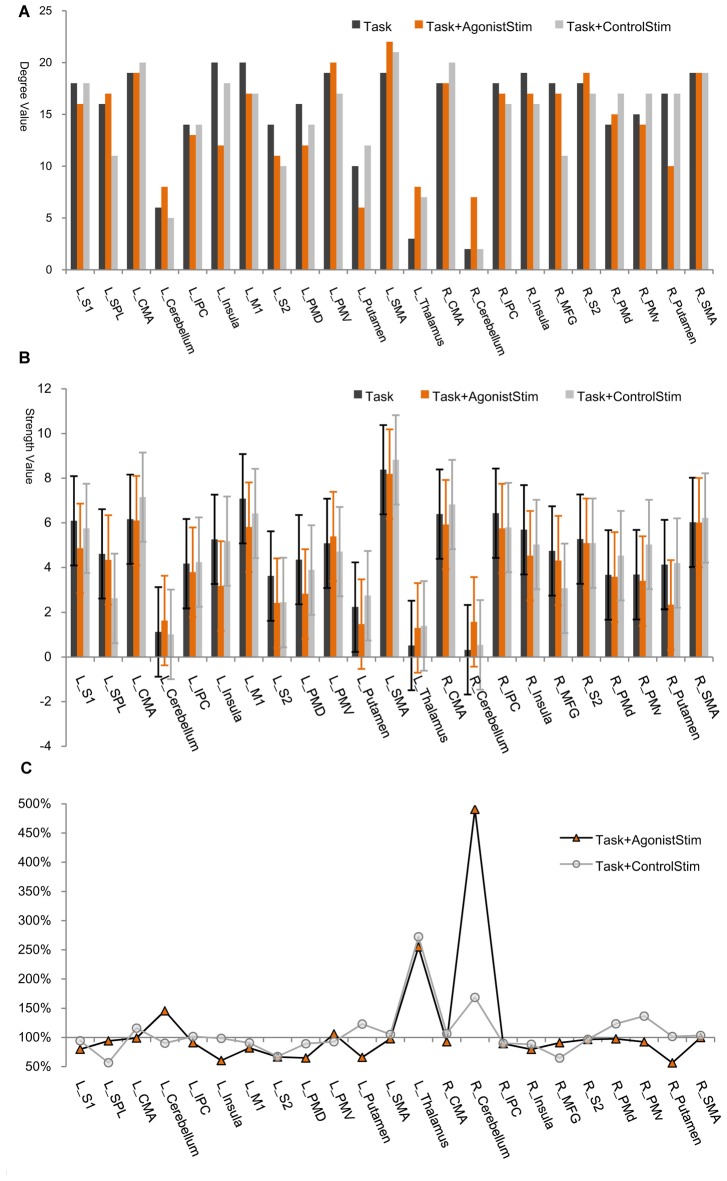
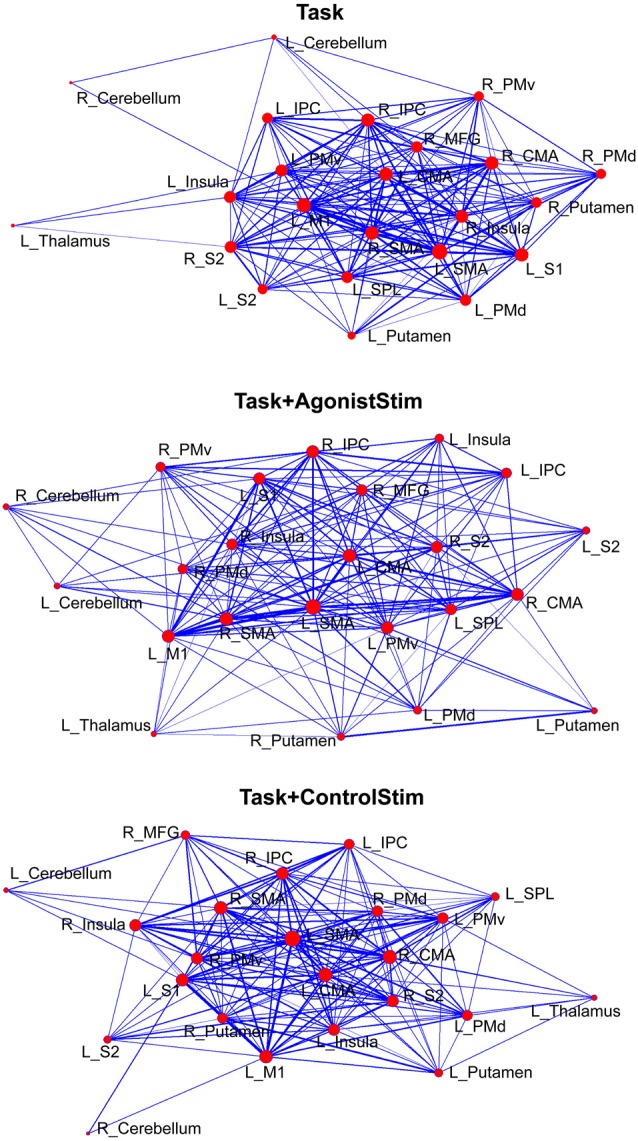
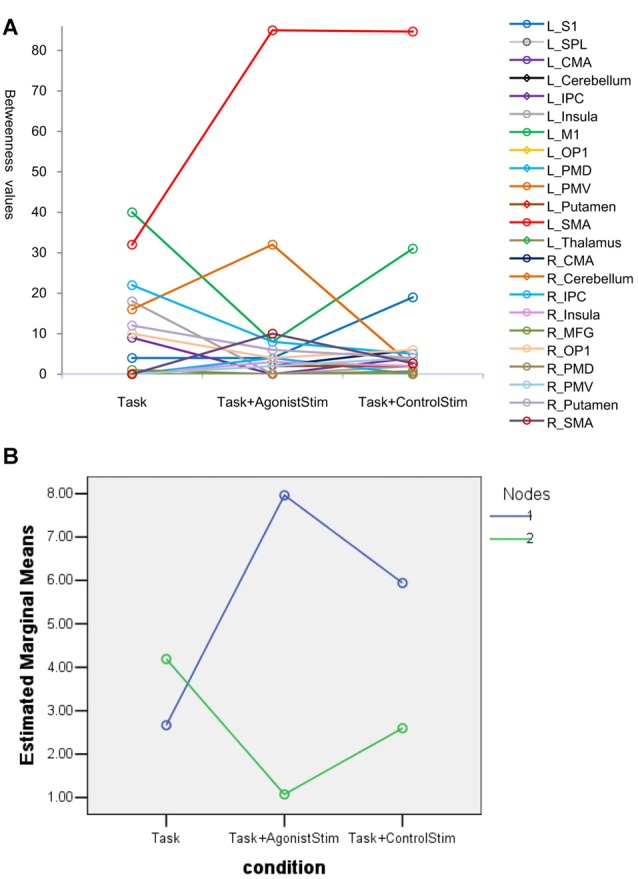
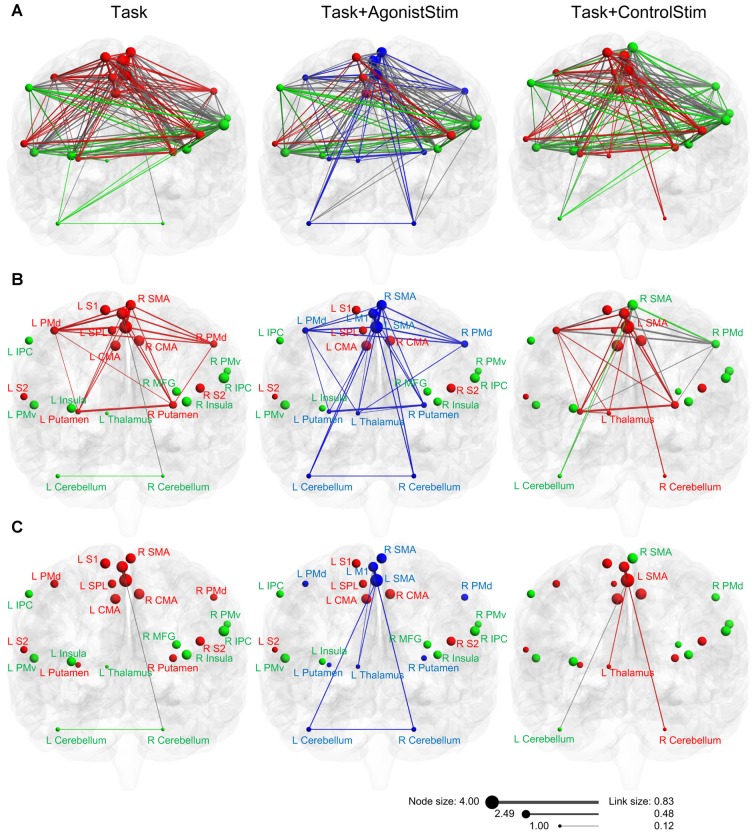
Motor performance is improved by stimulation of the agonist muscle during movement. However, related brain mechanisms remain unknown. In this work, we perform a functional magnetic resonance imaging (fMRI) study in 21 healthy subjects under three different conditions: (1) movement of right ankle alone; (2) movement and simultaneous stimulation of the agonist muscle; or (3) movement and simultaneous stimulation of a control area. We constructed weighted brain networks for each condition by using functional connectivity. Network features were analyzed using graph theoretical approaches. We found that: (1) the second condition evokes the strongest and most widespread brain activations (5147 vs. 4419 and 2320 activated voxels); and (2) this condition also induces a unique network layout and changes hubs and the modular structure of the brain motor network by activating the most "silent" links between primary somatosensory centers and the motor cortex, particularly weak links from the thalamus to the left primary motor cortex (M1). Significant statistical differences were found when the strength values of the right cerebellum (P < 0.001) or the left thalamus (P = 0.006) were compared among the three conditions. Over the years, studies reported a small number of projections from the thalamus to the motor cortex. This is the first work to present functions of these pathways. These findings reveal mechanisms for enhancing motor function with somatosensory stimulation, and suggest that network function cannot be thoroughly understood when weak ties are disregarded.
Keywords: functional connectivity; functional magnetic resonance imaging; graph theory; motor control; weighted brain network.
Figures
Similar articles
-
Modulation of resting state functional connectivity of the motor network by transcranial pulsed current stimulation.Brain Connect. 2014 Apr;4(3):157-65. doi: 10.1089/brain.2013.0196. Epub 2014 Apr 9. Brain Connect. 2014. PMID: 24593667
-
Time course and spatial distribution of fMRI signal changes during single-pulse transcranial magnetic stimulation to the primary motor cortex.Neuroimage. 2011 Jun 1;56(3):1469-79. doi: 10.1016/j.neuroimage.2011.03.011. Epub 2011 Mar 17. Neuroimage. 2011. PMID: 21396457
-
Introducing graph theory to track for neuroplastic alterations in the resting human brain: a transcranial direct current stimulation study.Neuroimage. 2011 Feb 1;54(3):2287-96. doi: 10.1016/j.neuroimage.2010.09.085. Epub 2010 Oct 13. Neuroimage. 2011. PMID: 20932916
-
Motor task difficulty and brain activity: investigation of goal-directed reciprocal aiming using positron emission tomography.J Neurophysiol. 1997 Mar;77(3):1581-94. doi: 10.1152/jn.1997.77.3.1581. J Neurophysiol. 1997. PMID: 9084621 Clinical Trial.
-
Motor network disruption in essential tremor: a functional and effective connectivity study.Brain. 2015 Oct;138(Pt 10):2934-47. doi: 10.1093/brain/awv225. Epub 2015 Aug 5. Brain. 2015. PMID: 26248468
Cited by
-
Does muscle fatigue change motor synergies at different levels of neuromotor control?Front Hum Neurosci. 2025 Jan 7;18:1519462. doi: 10.3389/fnhum.2024.1519462. eCollection 2024. Front Hum Neurosci. 2025. PMID: 39839368 Free PMC article.
-
Psychopathy and medial frontal cortex: A systematic review reveals predominantly null relationships.Neurosci Biobehav Rev. 2024 Dec;167:105904. doi: 10.1016/j.neubiorev.2024.105904. Epub 2024 Sep 28. Neurosci Biobehav Rev. 2024. PMID: 39343080 Free PMC article.
-
Supra-threshold vibration applied to the foot soles enhances jump height under maximum effort.PLoS One. 2022 Apr 6;17(4):e0266597. doi: 10.1371/journal.pone.0266597. eCollection 2022. PLoS One. 2022. PMID: 35385540 Free PMC article.
-
The CSF-Contacting Nucleus Receives Anatomical Inputs From the Cerebral Cortex: A Combination of Retrograde Tracing and 3D Reconstruction Study in Rat.Front Neuroanat. 2020 Nov 20;14:600555. doi: 10.3389/fnana.2020.600555. eCollection 2020. Front Neuroanat. 2020. PMID: 33328908 Free PMC article.
-
Dynamic modulations of effective brain connectivity associated with postural instability during multi-joint compound movement on compliant surface.Exp Brain Res. 2025 Mar 3;243(4):80. doi: 10.1007/s00221-025-07039-2. Exp Brain Res. 2025. PMID: 40029432 Free PMC article.
References
-
- Batagelj B., Mrvar A. (1998). Pajek—program for large network analysis. Connections 21, 47–57.
LinkOut - more resources
Full Text Sources
Other Literature Sources