

PK-PD Integration Modeling and Cutoff Value of Florfenicol against Streptococcus suis in Pigs
- PMID: 29387013
- PMCID: PMC5776115
- DOI: 10.3389/fphar.2018.00002
PK-PD Integration Modeling and Cutoff Value of Florfenicol against Streptococcus suis in Pigs
Abstract
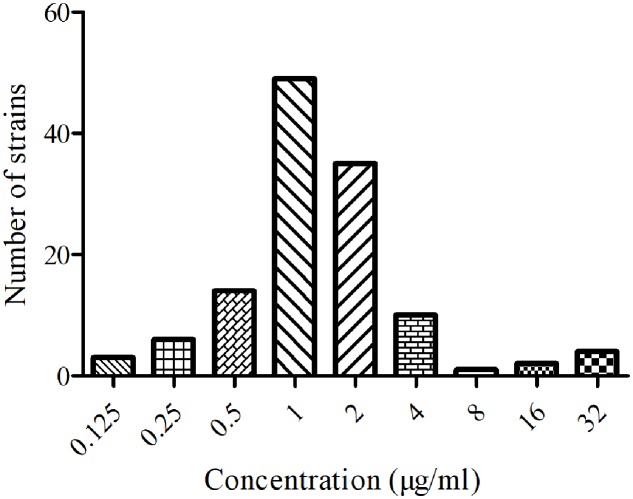
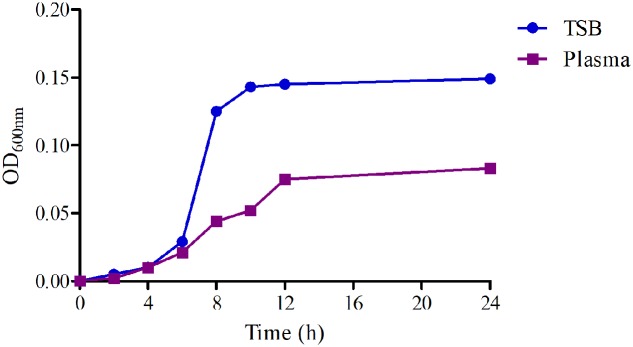
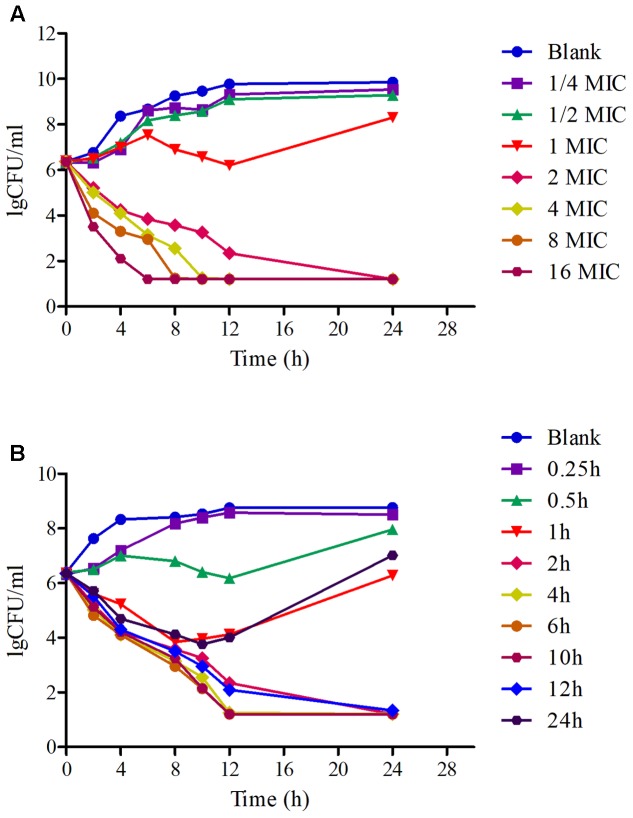
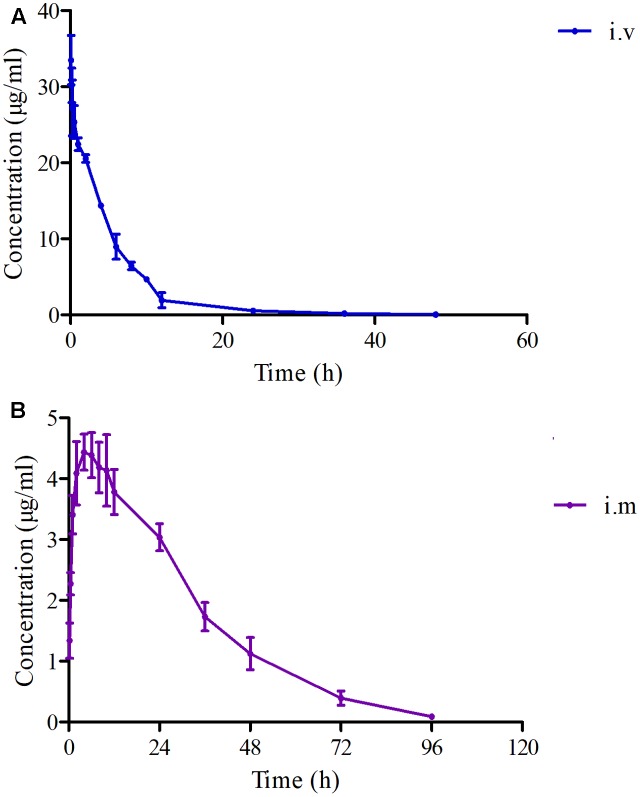
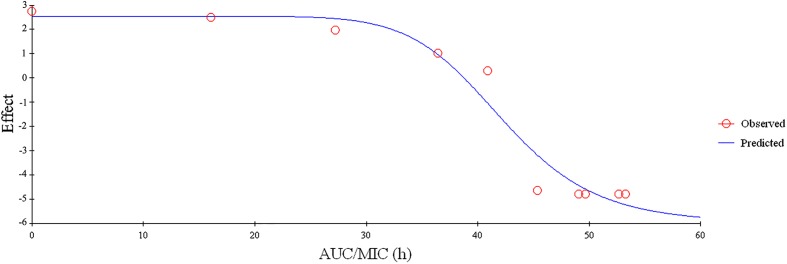
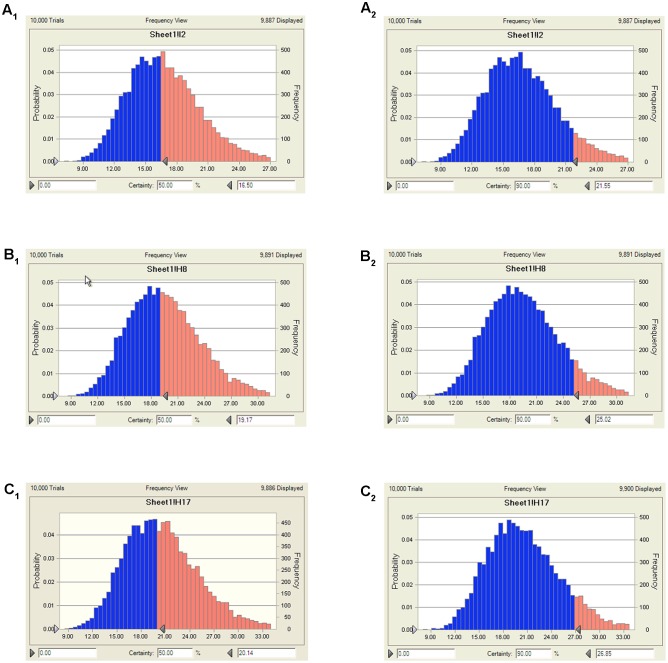
The aims of the present study were to establish optimal doses and provide an alternate COPD for florfenicol against Streptococcus suis based on pharmacokinetic-pharmacodynamic integration modeling. The recommended dose (30 mg/kg b.w.) were administered in healthy pigs through intramuscular and intravenous routes for pharmacokinetic studies. The main pharmacokinetic parameters of Cmax, AUC0-24h, AUC, Ke, t1/2ke, MRT, Tmax, and Clb, were estimated as 4.44 μg/ml, 88.85 μg⋅h/ml, 158.56 μg⋅h/ml, 0.048 h-1, 14.46 h, 26.11 h, 4 h and 0.185 L/h⋅kg, respectively. The bioavailability of florfenicol was calculated to be 99.14% after I.M administration. A total of 124 Streptococcus suis from most cities of China were isolated to determine the minimum inhibitory concentration (MIC) of florfenicol. The MIC50 and MIC90 were calculated as 1 and 2 μg/ml. A serotype 2 Streptococcus suis (WH-2), with MIC value similar to MIC90, was selected as a representative for an in vitro and ex vivo pharmacodynamics study. The MIC values of WH-2 in TSB and plasma were 2 μg/ml, and the MBC/MIC ratios were 2 in TSB and plasma. The MPC was detected to be 3.2 μg/ml. According to inhibitory sigmoid Emax model, plasma AUC0-24h/MIC values of florfenicol versus Streptococcus suis were 37.89, 44.02, and 46.42 h for the bactericidal, bacteriostatic, and elimination activity, respectively. Monte Carlo simulations the optimal doses for bactericidal, bacteriostatic, and elimination effects were calculated as 16.5, 19.17, and 20.14 mg/kg b.w. for 50% target attainment rates (TAR), and 21.55, 25.02, and 26.85 mg/kg b.w. for 90% TAR, respectively. The PK-PD cutoff value (COPD) analyzed from MCS for florfenicol against Streptococcus suis was 1 μg/ml which could provide a sensitivity cutoff value. These results contributed an optimized alternative to clinical veterinary medicine and showed that the dose of 25.02 mg/kg florfenicol for 24 h could have a bactericidal action against Streptococcus suis after I.M administration. However, it should be validated in clinical practice in the future investigations.
Keywords: Streptococcus suis; florfenicol; optimal dosages; pharmacodynamic; pharmacokinetic.
Figures
References
-
- Andes D., Anon J., Jacobs M. R., Craig W. A. (2004a). Application of pharmacokinetics and pharmacodynamics to antimicrobial therapy of respiratory tract infections. Clin. Lab. Med. 24 477–502. - PubMed
LinkOut - more resources
Full Text Sources
Other Literature Sources