. 2018 Jan 17:8:2004.
doi: 10.3389/fimmu.2017.02004. eCollection 2017.

Monocytes Differentiate to Immune Suppressive Precursors of Metastasis-Associated Macrophages in Mouse Models of Metastatic Breast Cancer

Affiliations

Monocytes Differentiate to Immune Suppressive Precursors of Metastasis-Associated Macrophages in Mouse Models of Metastatic Breast Cancer

Takanori Kitamura et al. Front Immunol. .

Abstract

Metastasis-associated macrophages (MAMs) play pivotal roles in breast cancer metastasis by promoting extravasation and survival of metastasizing cancer cells. In a metastatic breast cancer mouse model, we previously reported that circulating classical monocytes (C-MOs) preferentially migrated into the tumor-challenged lung where they differentiated into MAMs. However, the fate and characteristics of C-MOs in the metastatic site has not been defined. In this study, we identified that adoptively transferred C-MOs (F4/80lowCD11b+Ly6C+) differentiated into a distinct myeloid cell population that is characterized as F4/80highCD11bhighLy6Chigh and gives rise to MAMs (F4/80lowCD11bhighLy6Clow) within 18 h after migration into the metastatic lung. In mouse models of breast cancer, the CD11bhighLy6Chigh MAM precursor cells (MAMPCs) were commonly found in the metastatic lung, and their accumulation was increased during metastatic tumor growth. The morphology and gene expression profile of MAMPCs were distinct from C-MOs and had greater similarity to MAMs. For example MAMPCs expressed mature macrophage markers such as CD14, CD36, CD64, and CD206 at comparable levels with MAMs, suggesting that MAMPCs have committed to a macrophage lineage in the tumor microenvironment. MAMPCs also expressed higher levels of Arg1, Hmox1, and Stab1 than C-MOs to a comparable level to MAMs. Expression of these MAM-associated genes in MAMPCs was reduced by genetic deletion of colony-stimulating factor 1 receptor (CSF1R). On the other hand, transient CSF1R blockade did not reduce the number of MAMPCs in the metastatic site, suggesting that CSF1 signaling is active in MAMPCs but is not required for their accumulation. Functionally MAMPCs suppressed the cytotoxicity of activated CD8+ T cells in vitro in part through superoxide production. Overall, our results indicate that immediately following migration into the metastatic tumors C-MOs differentiate into immunosuppressive cells that have characteristics of monocytic myeloid-derived suppressor cell phenotype and might be targeted to enhance efficacy of immunotherapy for metastatic breast cancer.

Keywords: CD8+ T cell; breast cancer; immune suppression; macrophage; metastasis; myeloid-derived suppressor cell.


Figures
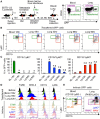
Figure 1
Figure 1
Adoptively transferred classical monocytes (C-MOs) differentiate into a distinct myeloid population that gives rise to metastasis-associated macrophages (MAMs) in the metastatic site. (A) A scheme of the monocyte tracking experiment (left) and representative dot plots showing the transferred (GFP+) and intrinsic (GFP) cells in the blood and lung of the tumor-bearing monocyte-transferred mouse (right). (B) Representative dot plots showing expression of CD11b and Ly6C in the transferred GFP+ cells in the blood and lung of tumor-bearing mice after the indicated time posttransfer (n = 3/group, two independent experiments). Three typical populations characterized as CD11b+Ly6C+ (green), CD11bhighLy6Chigh (blue), and CD11bhighLy6Clow (red) were shown. (C) Percentage is shown of CD11b+Ly6C+, CD11bhighLy6Chigh, and CD11bhighLy6Clow populations in GFP+ cells (n = 3/group, two independent experiments). Data are mean ± SEM, *P < 0.01 vs. blood 18 h (BL-18 h), #P < 0.01 vs. lung 18 h (Lg-18 h). (D) Representative histograms showing expression of indicated markers in the transferred GFP+ cells in the blood and lung as well as GFP+ cells before transfer (before). As a control, expressions of markers in intrinsic cells from the tumor-bearing mouse are shown in the bottom. C-MO, non-classical monocytes (NC-MO), and neutrophils (Neu) were identified in blood, and CD11bhighLy6Chigh cells (Ly6Chi), MAM, and resident macrophages (RMAC) were detected in the metastatic lung. Data are representative of two independent experiments with three mice per group. (E) Representative dot plots showing expression of CD11b and Ly6C in the intrinsic CD115+Ly6G cells in the blood and F4/80+Ly6G cells in the lung from the E0771-LG-injected C57BL/6 mice used in (B) (n = 3, two independent experiments). Three typical populations characterized as C-MO (green), NC-MO (orange), CD11bhighLy6Chigh (blue), MAM (red), and RMAC (purple) were shown.
Figure 2
Figure 2
CD11bhighLy6Chigh metastasis-associated macrophage (MAM) precursor cells (MAMPCs) accumulate in the lung during metastatic tumor growth. (A) Representative dot plots of the lung of normal C57BL/6 and BL6;PyMT mice that have established metastatic tumors (n = 3, three independent experiments). Cells were first gated as CD45+F4/80+, and then MAMPCs (blue), MAMs (red), and resident macrophages (RMACs) (purple) were defined as CD11bhighLy6Chigh, CD11bhighLy6Clow, and CD11bLy6Clow, respectively. (B) Relative numbers of MAMPCs, MAMs, and RMACs in the lung of C57BL/6 and metastasis-bearing PyMT mice (n = 3, three independent experiments). Data are mean ± SEM, *P < 0.05. (C) Representative dot plots of the lung from normal and metastasis-bearing FVB mice at 21 days after intravenous injection of Met-1 mouse mammary tumor cells (n = 3, two independent experiments). Cells were gated as described in (A). (D) Relative numbers of MAMPCs, MAMs, and RMACs in the normal and Met-1 tumor-bearing (Met-1) lung at 21 days after tumor injection (n = 3, two independent experiments). Data are mean ± SEM, *P < 0.05. (E) Representative H&E-stained lung sections from normal C57BL/6 mice and from those transplanted with E0771-LG cells 7 or 14 days before isolation of the lung. Scale bar; 200 µm. (F) Relative numbers of cells with the phenotypes of MAMPCs, MAMs, and RMACs in the lung of normal (N, n = 4) and tumor-injected mice at days 7 and 14 post-E0771-LG injection mice (n = 3, two independent experiments). Data are mean ± SEM, *P < 0.05.
Figure 3
Figure 3
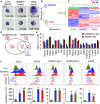
The metastasis-associated macrophage (MAM) precursor cells (MAMPCs) are morphologically and transcriptionally distinguishable from classical monocytes (C-MOs) and MAMs. (A) Representative morphology of C-MOs in the blood, and MAMPCs and MAMs in the lung of mice with E0771-LG metastatic tumors. Scale bar; 10 µm. The number of cells with the indicated morphology in the total counted cells is shown. (B) Unsupervised multidimensional scaling (MDS) plot of the normalized gene expression of RNA isolated from C-MOs, MAMPCs, and MAMs (n = 3/group). C-MOs were isolated from the bone marrow and MAMPCs and MAMs were isolated from the lung of mice bearing E0771-LG metastatic tumors. (C) Unsupervised hierarchical clustering of differentially expressed genes (FDR < 0.05) between MAMPC and C-MO populations. Columns indicate samples, rows indicate genes, and color intensity represents the Z-score-transformed RNA expression values. Samples are clustered using complete linkage and Pearson correlation. (D) Venn diagram of the commonly regulated genes in MAMPCs compared with C-MOs or MAMs (log2FC more or less than −1/1, FDR = < 0.05). (E) Genes encoding macrophage receptors that were upregulated in MAMPCs (blue) and MAMs (red) compared with IMs (logFC > 1, P < 0.01). Genes were clustered according to their ligands, i.e., phosphatidylserine receptors (Havcr2, Mertk), complement receptors (C3ar1, C5ar1, ItgaX), Toll-like receptors and coreceptor (Tlr3, Tlr5, Cd14), C-type lectin (Clec4e), scavenger receptors (Cd36, Marco, Mrc1, Stab1), cytokine and chemokine receptors (Ilr1, Cd40, Tnfsf11a, Tnfsf12a, Ccr5), and Fc receptors (Fcgr1, Fcgr4). Data on expression values are presented as mean ± SEM. Note that the scale is exponential. (F) Representative histogram (top) and mean fluorescent intensity (bottom) of indicated proteins in C-MOs, MAMPCs, and MAMs (n = 3, two independent experiments). Blood (for C-MOs) and lung digestion (for MAMPCs and MAMs) were prepared from E0771-LG-injected C57BL/6 mice at 14 days posttumor injection and stained with antibodies for indicated markers or isotype IgG. Data are mean ± SEM, *P < 0.01 vs. C-MO, #P < 0.01 vs. MAMPC.
Figure 4
Figure 4
Colony-stimulating factor 1 (CSF1) signaling is required for tumor-associated macrophage (TAM) signature gene expression in metastasis-associated macrophage precursor cells (MAMPCs) but is not essential for their accumulation in the metastatic site. (A) Fold-change of genes encoding transcription factors (TFs) and TAM-signature genes (15) under CSF1 receptor (CSF1R) control determined by microarray analyses in Figure 3. Graphs show genes whose expression was higher in MAMPCs and MAMs than classical monocytes (C-MOs) (logFC > 1, FDR < 0.05). Data on expression values are presented as mean ± SEM. Note that the scale is exponential. (B) Relative mRNA expression assessed by quantitative RT-PCR in C-MOs (green), MAMPCs (blue), MAMs (red), and resident macrophages (RMACs) (Purple) (n = 3, two independent experiments). C-MOs were isolated from blood, and MAMPCs, MAMs, and RMACs were isolated from the metastatic lung of mice injected with E0771-LG cells. Data are mean ± SEM, *P < 0.05 vs. C-MO. (C) Mean fluorescence intensity of CSF1R in circulating C-MOs from tumor-bearing C57BL/6 (wild type) and CSF1R conditional knockout (Csf1r cKO) mice treated with doxycycline from day 7 to day 14 after intravenous injection of E0771-LG cells (n = 3, two independent experiments). Data are mean ± SEM, *P < 0.01. (D) Relative mRNA expression assessed by real time RT-PCR in MAMPCs and MAMs isolated from the metastatic lung of wild-type and Csf1r cKO mice that were treated as described above (n = 3, two independent experiments). Data are mean ± SEM, *P < 0.05. (E) Relative numbers of C-MOs in the blood, and MAMPCs and MAMs in the metastatic lung of Csf1r cKO mice treated with doxycycline (Dox) or vehicle (Veh) as described above (n = 3/group, two independent experiments). Data are mean ± SEM, *P < 0.01. (F) Relative numbers of C-MOs in the blood, and MAMPCs and MAMs in the metastatic lung of C57BL/6 mice treated with BLZ945, a selective CSF1R antagonist (BLZ) or Veh from day 7 to day 14 after intravenous injection of E0771-LG cells (n = 3/group, two independent experiments). Data are mean ± SEM, *P < 0.01. (G) Lung metastatic burden quantified as a metastasis index that is equal to total metastasis volume normalized by total lung volume. Csf1r cKO mice were treated with Dox or Veh from day 7 to day 14 after intravenous injection of E0771-LG cells (n = 6/group, two independent experiments). Data are mean ± SEM, *P < 0.01. (H) Lung metastatic burden quantified by bioluminescence imaging. C57BL/6 mice were treated with BLZ945 (BLZ) or Veh from day 7 to day 14 after intravenous injection of E0771-LG cells (n = 3/group, two independent experiments). Data are mean ± SEM, *P < 0.01.
Figure 5
Figure 5
Metastasis-associated macrophage (MAM) precursor cells (MAMPCs) suppress cytotoxicity of CD8+ T cells through a reactive oxygen species (ROS)-mediated mechanism. (A,B) Effects of myeloid cells on the CD8+ T cell-induced tumor cell apoptosis. Splenic CD8+ T cells from normal C57BL/6 mice were cultured with anti-CD3/CD28 antibodies (effector; E) in the absence or presence of MAMPCs, MAMs, or resident macrophages (RMACs) from the metastatic lung of E0771-LG-injected mice (MAMPC/E, MAM/E, RMAC/E, respectively). The preincubated T cells were then isolated and cultured with E0771-LG cells expressing red fluorescent protein in the nuclei (target; T) at the indicated E:T ratio in the presence of green fluorogenic caspase-3 substrate. After 36 h, the number of apoptotic cancer cells indicated by red/green double positive nuclei was counted. (A) Representative images of cells cultured with the caspase-3 substrate for 36 h (E:T = 4:1). Scale bar; 50 µm, arrowhead; apoptotic cancer cell. (B) Number of apoptotic cancer cells cultured with preactivated CD8+ T cells (n = 3, two independent experiments). Data are mean ± SEM, *P < 0.01 vs. E + T (4:1), #P < 0.01 vs. MAMPC/E + T. (C) Fold-change of genes encoding checkpoint T cell receptor ligands in MAMPCs and MAMs compared with classical monocytes (C-MOs) determined by microarray analyses in Figure 3 (logFC > 1, FDR < 0.05). Data on expression values are presented as mean ± SEM. Note that the scale is exponential. (D) Mean fluorescence intensity of checkpoint T cell receptor ligands assessed by flow cytometry in C-MOs, MAMPCs, and MAMs (n = 3, two independent experiments). Blood (for C-MOs) and lung digestion (for MAMPCs and MAMs) were prepared from E0771-LG-injected C57BL/6 mice at 14 days posttumor injection and stained with antibodies for indicated markers or isotype IgG. Data are mean ± SEM, *P < 0.01 vs. IM, #P < 0.01 vs. MAMPC. (E) Effects of checkpoint inhibitors on the suppressive activity of MAMPCs and MAMs (n = 6, two independent experiments). CD8+ T cells were cultured with anti-CD3/CD28 antibodies and neutralizing antibodies for PD1 or CTLA4, or isotype IgG in the absence (effector; E) or presence of MAMPCs (MAMPC/E) or MAMs (MAM/E). Cytotoxicity of the precultured CD8+ T cells against E0771-LG cells at 4:1 E/T ratio were assessed as described above. Data are mean ± SEM that represent the ratio in number of apoptotic cancer cells relative to that induced by CD8+ T cells cultured with IgG in the absence of MAMPCs or MAMs (control). *P < 0.01 vs. control, #P < 0.01 vs. IgG. (F) Effects of inhibitors of nitric oxide or ROS production on the suppressive activity of MAMPCs and MAMs (n = 6, two independent experiments). CD8+ T cells were cultured with anti-CD3/CD28 antibodies and L-NMMA, nor-NOHA, catalase and superoxide dismutase (SOD) (Cat/SOD), or vehicle (–) in the absence (E) or presence of MAMPCs (MAMPC/E) or MAMs (MAM/E). Cytotoxicity of the precultured CD8+ T cells against E0771-LG cells at 4:1 E/T ratio were assessed as described above. Data are mean ± SEM that represent the ratio of apoptotic cancer cells relative to that induced by CD8+ T cells cultured with PBS in the absence of MAMPCs or MAMs (control). *P < 0.01 vs. control, #P < 0.01 vs. PBS.

References

    1. Jemal A, Bray F, Center MM, Ferlay J, Ward E, Forman D. Global cancer statistics. CA Cancer J Clin (2011) 61:69–90.10.3322/caac.20107 - DOI - PubMed
    1. Steeg PS. Targeting metastasis. Nat Rev Cancer (2016) 16:201–18.10.1038/nrc.2016.25 - DOI - PMC - PubMed
    1. Tevaarwerk AJ, Gray RJ, Schneider BP, Smith ML, Wagner LI, Fetting JH, et al. Survival in patients with metastatic recurrent breast cancer after adjuvant chemotherapy: little evidence of improvement over the past 30 years. Cancer (2013) 119:1140–8.10.1002/cncr.27819 - DOI - PMC - PubMed
    1. Kitamura T, Qian B-Z, Pollard JW. Immune cell promotion of metastasis. Nat Rev Immunol (2015) 15:73–86.10.1038/nri3789 - DOI - PMC - PubMed
    1. Lin EY, Nguyen AV, Russell RG, Pollard JW. Colony-stimulating factor 1 promotes progression of mammary tumors to malignancy. J Exp Med (2001) 193:727–40.10.1084/jem.193.6.727 - DOI - PMC - PubMed