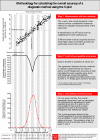
Effects of disease severity distribution on the performance of quantitative diagnostic methods and proposal of a novel 'V-plot' methodology to display accuracy values
- PMID: 29387424
- PMCID: PMC5786922
- DOI: 10.1136/openhrt-2017-000663
Effects of disease severity distribution on the performance of quantitative diagnostic methods and proposal of a novel 'V-plot' methodology to display accuracy values
Abstract
Background: Diagnostic accuracy is widely accepted by researchers and clinicians as an optimal expression of a test's performance. The aim of this study was to evaluate the effects of disease severity distribution on values of diagnostic accuracy as well as propose a sample-independent methodology to calculate and display accuracy of diagnostic tests.
Methods and findings: We evaluated the diagnostic relationship between two hypothetical methods to measure serum cholesterol (Cholrapid and Cholgold) by generating samples with statistical software and (1) keeping the numerical relationship between methods unchanged and (2) changing the distribution of cholesterol values. Metrics of categorical agreement were calculated (accuracy, sensitivity and specificity). Finally, a novel methodology to display and calculate accuracy values was presented (the V-plot of accuracies).
Conclusion: No single value of diagnostic accuracy can be used to describe the relationship between tests, as accuracy is a metric heavily affected by the underlying sample distribution. Our novel proposed methodology, the V-plot of accuracies, can be used as a sample-independent measure of a test performance against a reference gold standard.
Keywords: diagnostic accuracy; diagnostic tests; study sample.
Conflict of interest statement
Competing interests: None declared.
Figures


Similar articles
-
Folic acid supplementation and malaria susceptibility and severity among people taking antifolate antimalarial drugs in endemic areas.Cochrane Database Syst Rev. 2022 Feb 1;2(2022):CD014217. doi: 10.1002/14651858.CD014217. Cochrane Database Syst Rev. 2022. PMID: 36321557 Free PMC article.
-
Interrelationships Among Sensitivity, Precision, Accuracy, Specificity and Predictive Values in Bioassays, Represented as Combined ROC Curves with Integrated Cutoff Distribution Curves and Novel Index Values.Diagnostics (Basel). 2025 Feb 7;15(4):410. doi: 10.3390/diagnostics15040410. Diagnostics (Basel). 2025. PMID: 40002560 Free PMC article.
-
Clinical utility of serologic testing for celiac disease in ontario: an evidence-based analysis.Ont Health Technol Assess Ser. 2010;10(21):1-111. Epub 2010 Dec 1. Ont Health Technol Assess Ser. 2010. PMID: 23074399 Free PMC article.
-
Urea breath test for Helicobacter pylori infection in adult dyspeptic patients: A meta-analysis of diagnostic test accuracy.World J Gastroenterol. 2024 Feb 14;30(6):579-598. doi: 10.3748/wjg.v30.i6.579. World J Gastroenterol. 2024. PMID: 38463019 Free PMC article.
-
The evaluation of diagnostic tests: evidence on technical and diagnostic accuracy, impact on patient outcome and cost-effectiveness is needed.J Clin Epidemiol. 2007 Nov;60(11):1116-22. doi: 10.1016/j.jclinepi.2007.03.015. Epub 2007 Aug 29. J Clin Epidemiol. 2007. PMID: 17938052 Review.
Cited by
-
Reliability of Instantaneous Wave-Free Ratio (iFR) for the Evaluation of Left Main Coronary Artery Lesions.J Clin Med. 2019 Jul 31;8(8):1143. doi: 10.3390/jcm8081143. J Clin Med. 2019. PMID: 31370353 Free PMC article.
References
Publication types
Grants and funding
LinkOut - more resources
Full Text Sources
Other Literature Sources
