. 2018 Jan 30;5(1):ENEURO.0322-17.2018.
doi: 10.1523/ENEURO.0322-17.2018. eCollection 2018 Jan-Feb.

Opposing and Complementary Topographic Connectivity Gradients Revealed by Quantitative Analysis of Canonical and Noncanonical Hippocampal CA1 Inputs

Affiliations

Opposing and Complementary Topographic Connectivity Gradients Revealed by Quantitative Analysis of Canonical and Noncanonical Hippocampal CA1 Inputs

Yanjun Sun et al. eNeuro. .

Abstract

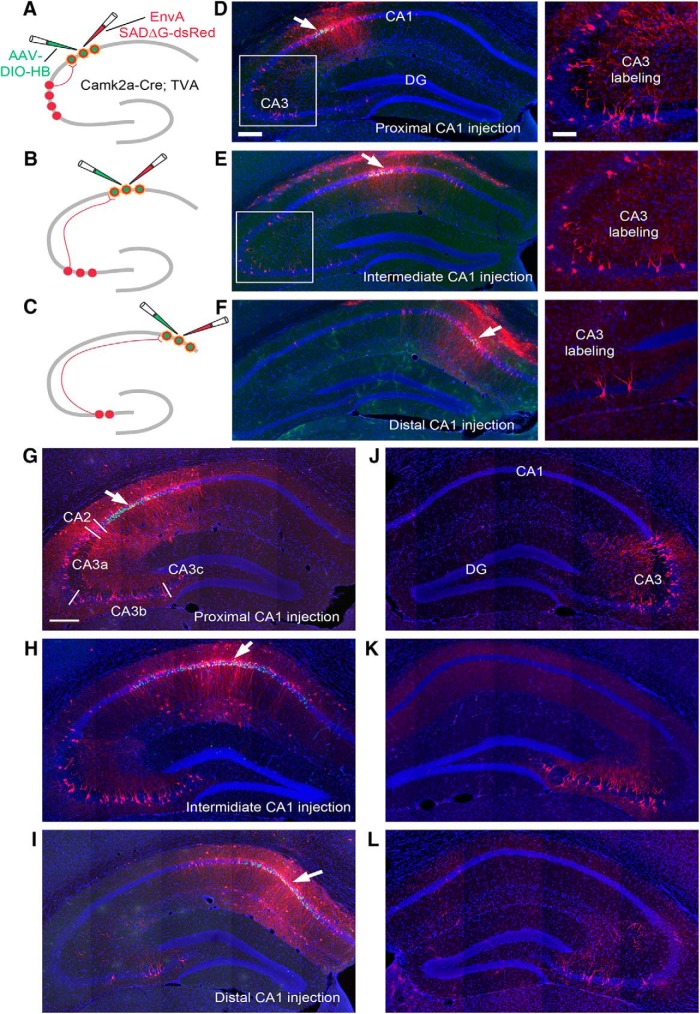
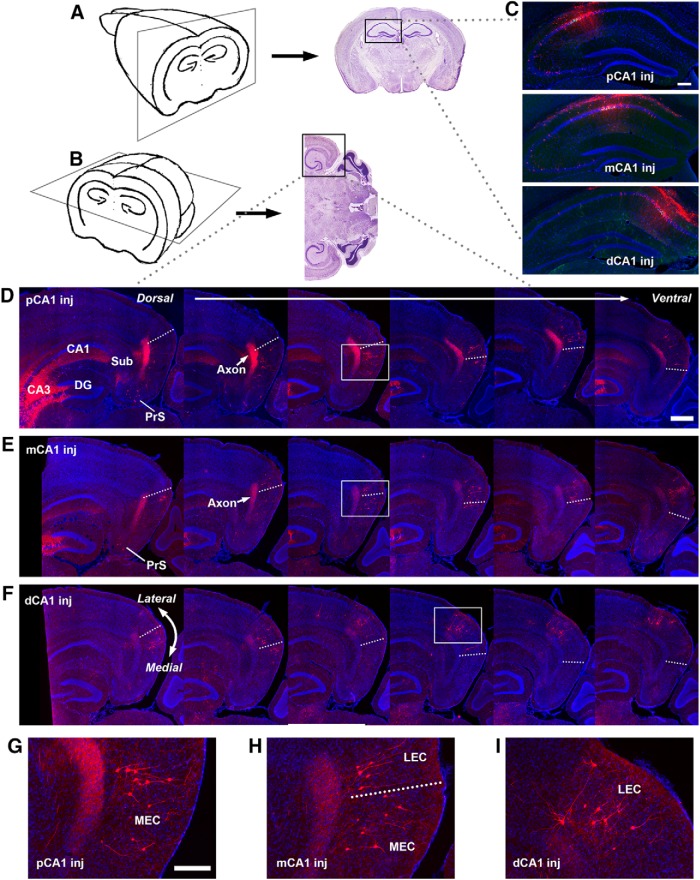
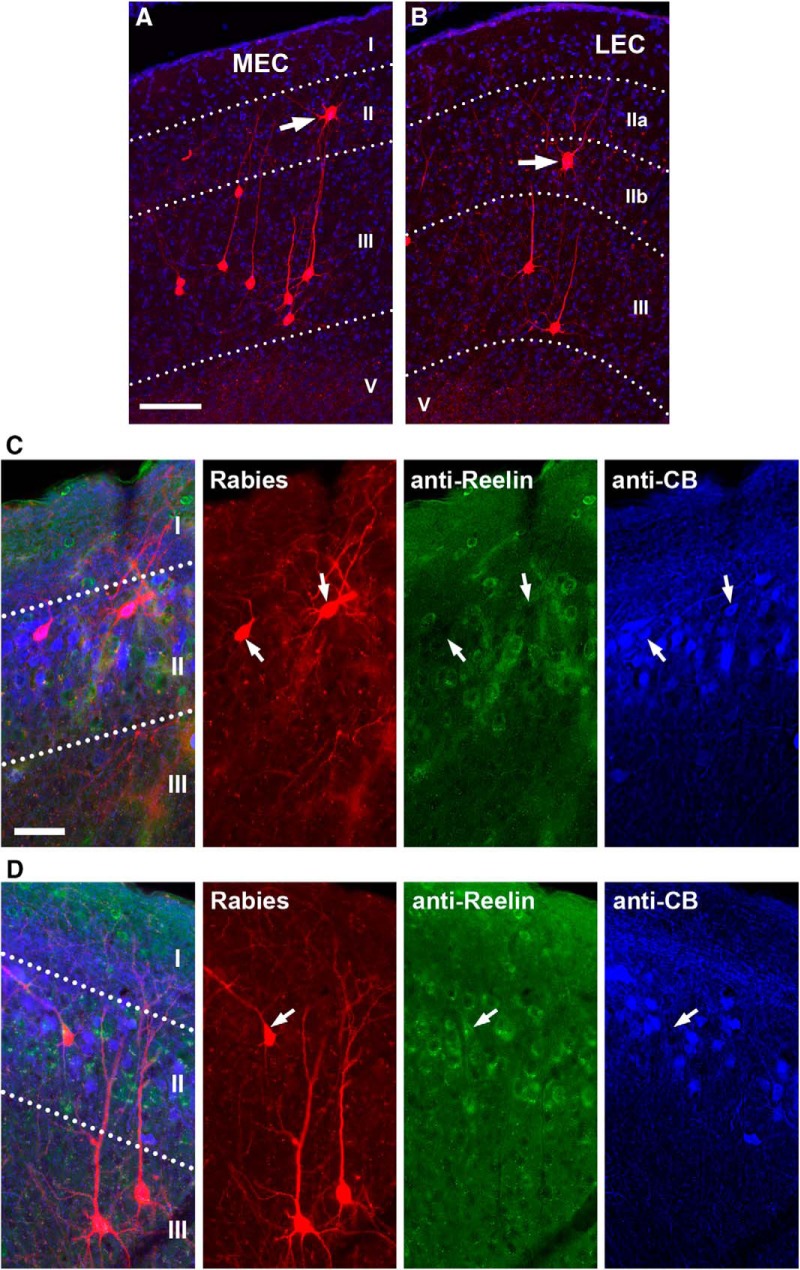
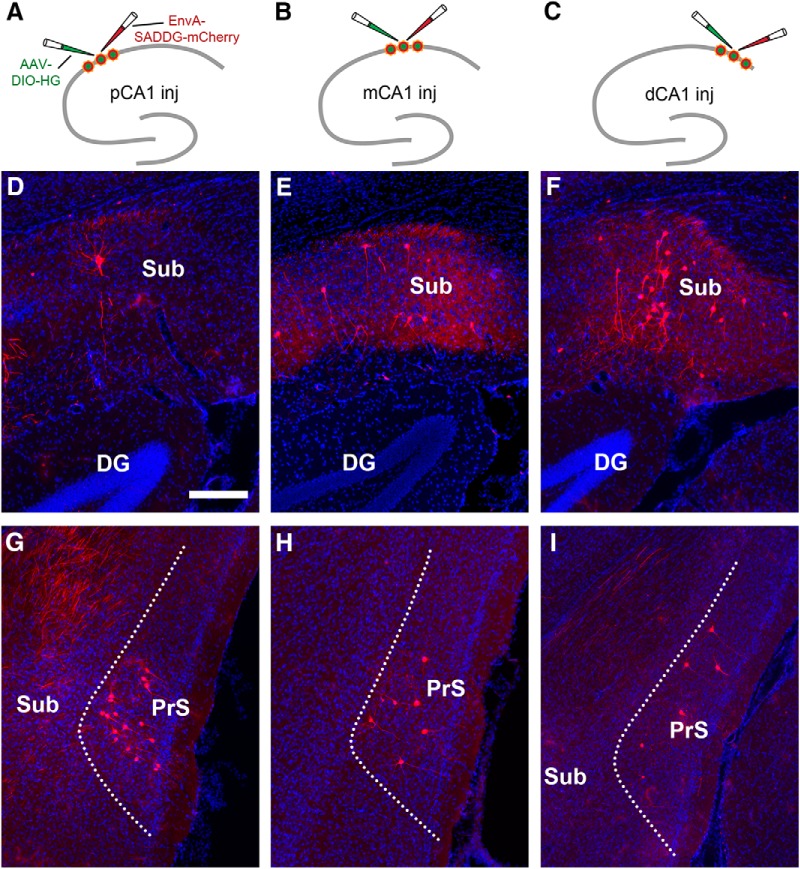
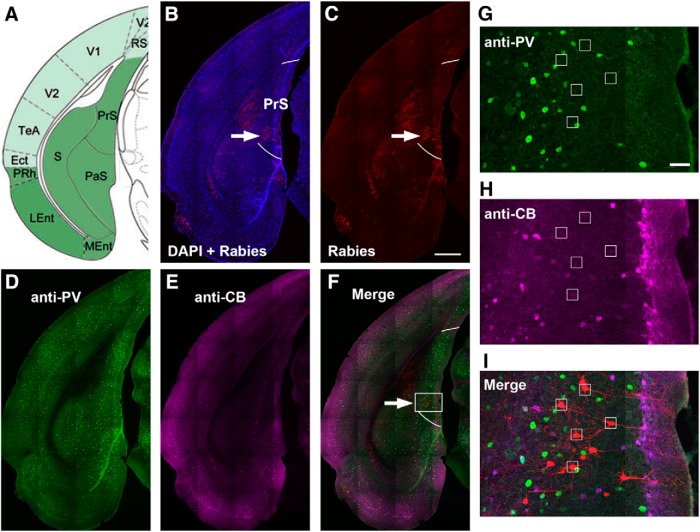
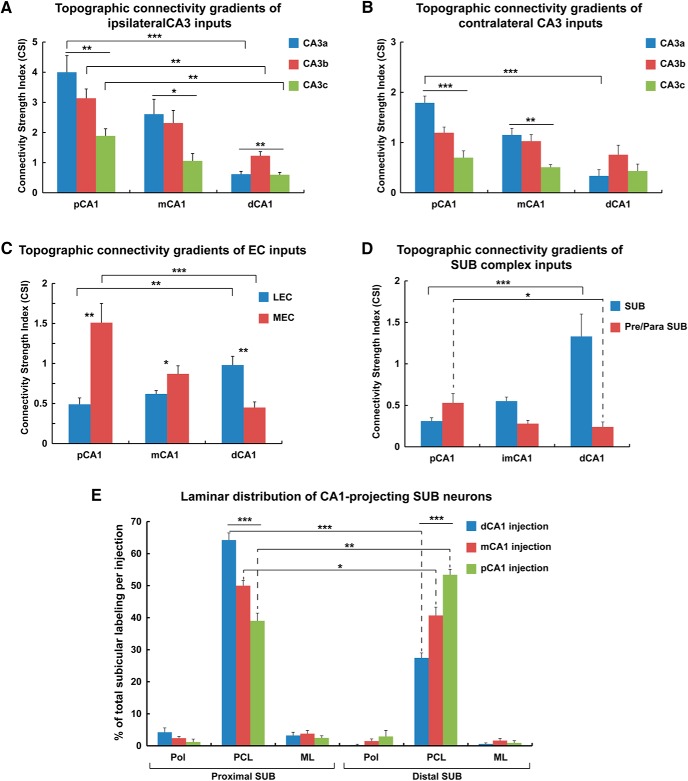
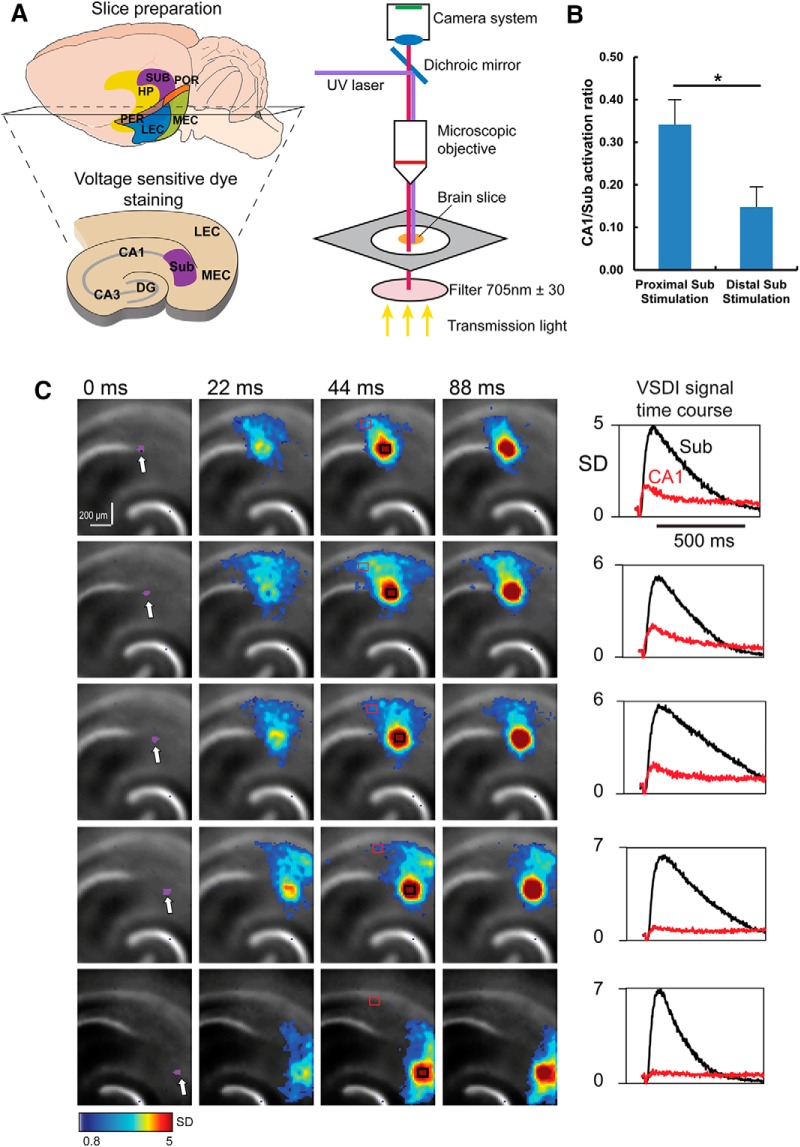
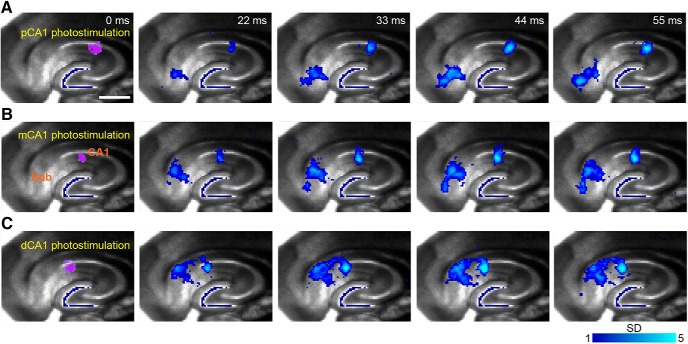
Physiological studies suggest spatial representation gradients along the CA1 proximodistal axis. To determine the underlying anatomical basis, we quantitatively mapped canonical and noncanonical inputs to excitatory neurons in dorsal hippocampal CA1 along the proximal-distal axis in mice of both sexes using monosynaptic rabies tracing. Our quantitative analyses show comparable strength of subiculum complex and entorhinal cortex (EC) inputs to CA1, significant inputs from presubiculum and parasubiculum to CA1, and a threefold stronger input to proximal versus distal CA1 from CA3. Noncanonical subicular complex inputs exhibit opposing topographic connectivity gradients whereby the subiculum-CA1 input strength systematically increases but the presubiculum-CA1 input strength decreases along the proximal-distal axis. The subiculum input strength cotracks that of the lateral EC, known to be less spatially selective than the medial EC. The functional significance of this organization is verified physiologically for subiculum-to-CA1 inputs. These results reveal a novel anatomical framework by which to determine the circuit bases for CA1 representations.

Keywords: Circuit connections; hippocampus; imaging; quantitative; viral tracing.


Figures

Figure 1.
Figure 1.
Topographic organization of CA3 to CA1 projections revealed through monosynaptic rabies tracing by specifically targeting CA1 pyramidal cells along the proximal-distal axis. A–C, The schematic illustrates targeting proximal (A), intermediate (B), and distal (C) CA1 through a Cre-dependent rabies tracing system. A Cre-dependent AAV helper virus (AAV8-EF1a-DIO-HB) carrying histone GFP (hGFP) and rabies B19 glycoprotein (B19G) is injected into different CA1 subfields of the Camk2a-Cre; TVA mice. Thus, the AAV helper virus only expresses in CA1 excitatory pyramidal neurons. Three weeks later, an EnvA pseudotyped, glycoprotein deficient rabies virus encoding mCherry fluorescent protein (EnvA-SAD-ΔG-mCherry) is delivered into the same brain region of the AAV injection. Once rabies virus has infected the same group of neurons via the TVA receptor, it undergoes transcomplementation and spreads to the presynaptic partners of the targeted neurons and labels the presynaptic neurons with mCherry (shown in CA3). Note that some mCherry labeling of excitatory neurons around the injection is due to primary rabies infection, as pyramidal neurons expressing TVA can be directly infected by local injection of EnvA-ΔG rabies. Based on laminar position, putative inhibitory cells were labeled outside the pyramidal cell layer. D–F, Examples show the injection sites (pointed by the arrows) in proximal (D), intermediate (E), and distal (F) CA1 by using iontophoretic injections. The corresponding CA3 labeling is shown in the enlarged panels on the right. Brain slices were sectioned coronally. DAPI staining is shown in blue, GFP expression of AAV helper virus is shown in green, and mCherry expression of rabies virus is shown in red. Neurons infected by both AAV and rabies, termed as starter neurons, appear in yellow. Scale bar on the left = 200 μm, right = 100 μm. G–I, Examples show the injection sites (pointed by the arrows) in proximal (G), intermediate (H), and distal (I) CA1, by using pressure injections. CA3 labeling is shown in the same section. Three white bars in G indicate the divisions of CA3a, CA3b, and CA3c (subfields of CA3). The scale bar (200 μm) in G applies to G–L. J–L, Contralateral CA3 projections to proximal (J), intermediate (K), and distal (L) CA1. Also see Fig. 1-1.
Figure 2.
Figure 2.
Topographic organization of lateral and medial entorhinal cortex inputs to different CA1 subfields. A, B, Schematic illustration of the combined coronal/horizontal sectioning approach. The rostral portion of the brain was sectioned in the coronal plane to identify the injection site in CA1 (A), while the caudal portion was sectioned in the horizontal plane to delineate lateral versus medial EC (B). C, Example injection sites in proximal CA1 (pCA1), intermediate CA1 (mCA1), and distal CA1 (dCA1), respectively. Scale bar = 200 μm. D–F, Retrogradely labeled EC neurons following rabies tracing in proximal CA1 (D), intermediate CA1 (E), and distal CA1 (F), respectively. Images from the left to right are organized from the dorsal to ventral. Rabies-labeled neurons are red. DAPI staining is blue. The arrow points to the prominent axons terminating in the deeper layers of the entorhinal cortex. These axons likely come from rabies-infected cells around the injection site in CA1. Dashed lines indicate the MEC and LEC border. The scale bar (500 μm) applies to all the other panels. G, Enlarged image of the white box region in D. H, Enlarged image of the white box region in E. I, Enlarged image of the white box region in F. The scale bar (200 μm) applies to G–I.
Figure 3.
Figure 3.
A moderate portion of layer II EC neurons project directly to hippocampal CA1. A, Rabies-labeled neurons in the medial entorhinal cortex (MEC) contain both layer III pyramidal cells and layer II cells. The white arrow points to a layer II cell. The scale bar (100 μm) applies to both A and B. B, Rabies-labeled neurons in the lateral entorhinal cortex (LEC) also contain layer III pyramidal cells and layer II cells. C, The example rabies-labeled MEC layer II cells are calbindin (CB) immunopositive, but reelin negative. D, The example rabies-labeled MEC layer II cell is reelin immunopositive, but CB negative. Scale bar in C = 100 µm, applies to both C and D.
Figure 4.
Figure 4.
The subiculum strongly projects to distal CA1 while the presubiculum strongly projects to pCA1, thus showing opposing proximal-distal connectivity gradients. A–C, Schematic illustrations rabies tracing from proximal CA1 (pCA1, A), intermediate CA1 (mCA1, B), and distal CA1 (dCA1, C), respectively. D–F, Rabies labeled CA1-projecting subicular neurons in example cases following the injection in pCA1 (D), mCA1 (E), and dCA1 (F), respectively. The scale bar (200 μm) in D applies to all other panels. G–I, Rabies-labeled CA1-projecting presubicular neurons in example cases following the injection in pCA1 (G), mCA1 (H), and dCA1 (I), respectively. Also see Fig. 4-1.
Figure 5.
Figure 5.
Rabies-labeled CA1-projecting neurons in immunochemically delineated presubiculum are mostly excitatory neurons. A, The mouse atlas image shows the anatomic location of the presubiculum (PrS). B, C, A brain section image corresponding to the atlas image. Rabies-labeled neurons appear in the presubiculum (indicated by the white arrow) after CA1 virus injection. DAPI staining is blue. Two white lines delineate the region of PrS per PV and CB immunochemical staining. The scale bar (500 μm) applies to B–F. D–F, Images of parvalbumin (PV) immunostaining (green, D), calbindin-D28k (CB) immunostaining (magenta, E), and a merged image (F). White arrow points to the region with rabies-labeled neurons, which has strong PV immunoreactivity and weak calbindin immunoreactivity. The PV and CB immunoreactivity features allow for delineation of PrS (Fujimaru and Kosaka, 1996; Fujise et al., 1995). G–I, Enlarged images of the white box region in F show PV staining (G), CB staining (H), and rabies-labeled neurons (red) in the merged image (I). Small white squares locate rabies-labeled neurons that are not positive for PV or CB staining. The scale bar (100 μm) in G applies to G–I.
Figure 6.
Figure 6.
Quantitative analyses of proximal-distal connectivity gradients of canonical CA3/EC and noncanonical subiculum complex inputs to CA1 subfields. A, A quantitative summary shows input strength differences of canonical CA3 subregion (CA3a, CA3b, and CA3c) inputs to proximal CA1, intermediate CA1, and distal CA1, respectively. The data are plotted with the values of the connectivity strength index (CSI), defined as the number of presynaptic neurons in a specific brain region divided by the number of starter neurons in the injections site. The data show complementary gradually significant decreases from strong CA3a–c connectivity to proximal CA1 to progressively weaker connectivity for CA3a–c to intermediate CA1 and distal CA1. These complementary decreases show systematically strong-to-weak connectivity along the proximal-distal axis of CA1. Group comparisons performed using one-way ANOVA with Tukey post hoc tests. The data are presented as mean ± SE; *, **, and *** indicate the statistical significance levels of p < 0.05, 0.01, and 0.001, respectively. B, A quantitative summary shows gradient-similar complementary input strength differences of contralateral CA3 (CA3a, CA3b, and CA3c) inputs to proximal CA1, intermediate CA1, and distal CA1, respectively. C, Opposing connectivity gradients seen for canonical medial entorhinal (MEC) and lateral entorhinal cortex (LEC) inputs to CA1. A quantitative summary shows input strength differences of LEC (gradually increasing along the proximal-distal axis) versus MEC (gradually decreasing along the proximal distal axis) to proximal CA1, intermediate CA1, and distal CA1, respectively. The data are presented as mean ± SE; *, **, and *** indicate the statistical significance levels of p < 0.05, 0.01, and 0.001 respectively. D, Opposing connectivity gradients seen for noncanonical subiculum (increase along the proximal-distal axis) to CA1 versus presubiculum (decrease along the proximal-distal axis) to CA1. A quantitative summary of connectivity strengths of the subiculum versus the presubiculum/parasubiculum to proximal CA1, intermediate CA1, and distal CA1 is shown. The data are presented as mean ± SE; * and *** indicate the statistical significance levels of p < 0.05 and 0.001, respectively. E, Laminar distribution of CA1-projecting subicular neurons after rabies tracing from distal CA1, intermediate CA1, and proximal CA1. The bar graph is plotted as the percentage of total labeled subicular neurons in each case. Pol, polymorphic layer; PCL, pyramidal cell layer; ML, molecular layer. The data are presented as mean ± SE; * and *** indicate the statistical significance levels of p < 0.05 and 0.001, respectively. See Table 1-1 for detailed statistical comparison results.
Figure 7.
Figure 7.
Functional circuit mapping with fast VSD imaging of neural activity validates the topographic organization of the subiculum to CA1 back-projections. A, Schematic of slice preparation for VSD imaging. B, A summary plot shows that the average ratio of CA1/subiculum mean activity decreases significantly (*, p = 0.046) when the photostimulation occurs in the more proximal subiculum versus the more distal subiculum. The VSD data physiologically validate the topographic organization of the subiculum to CA1 back-projections. C, Time series data from VSD imaging after photostimulation-evoked neural activation in different subiculum subfields. The purple dots (laser stimulation artifact) at 0 ms indicate the photostimulation site. The stimulation site in the subiculum shifts gradually away from the CA1/subiculum border from the top to the bottom of the panels. Color-coded activity is superimposed on the background slice image. The color scale codes VSD signal amplitude expressed as SD multiples above the mean baseline. The stronger activation is indicated by the warmer color. On the right, time course plots of VSD imaging (VSDI) signal from the regions of interest (subiculum and CA1) indicated by the black and red rectangles in the corresponding image frame on the left, respectively, starting from the baseline of 22 ms before the photostimulation onset.
Figure 8.
Figure 8.
Functional circuit mapping with fast VSD imaging of neural activity demonstrates a strong, discrete topographic organization of CA1 to subiculum projections. A–C, Spatially restricted photostimulation in proximal CA1 (pCA1, A), intermediate CA1 (mCA1, B), and distal CA1 (dCA1, C) evokes discrete activation in the distal, intermediate, and proximal subiculum, respectively. Each panel shows time series data of VSD imaging of photostimulation-evoked neural activation in different hippocampal CA1 subfields. The purple dots (laser stimulation artifact) at 0 ms indicate the photostimulation site. Color-coded activity is superimposed on the background slice image. The color scale codes VSD signal amplitude expressed as SD multiples above the mean baseline. The stronger activation is indicated by a brighter color. Scale bar in A = 500 μm applies to all the panels.

Similar articles

Cited by

References

    1. Acharya L, Aghajan ZM, Vuong C, Moore JJ, Mehta MR (2016) Causal influence of visual cues on hippocampal directional selectivity. Cell 164:197–207. 10.1016/j.cell.2015.12.015 - DOI - PubMed
    1. Albisetti GW, Ghanem A, Foster E, Conzelmann KK, Zeilhofer HU, Wildner H (2017) Identification of two classes of somatosensory neurons that display resistance to retrograde infection by rabies virus. J Neurosci 37:10358–10371. 10.1523/JNEUROSCI.1277-17.2017 - DOI - PMC - PubMed
    1. Amaral DG, Witter MP (1989) The three-dimensional organization of the hippocampal formation: a review of anatomical data. Neuroscience 31:571–591. 10.1016/0306-4522(89)90424-7 - DOI - PubMed
    1. Amaral DG, Dolorfo C, Alvarez-Royo P (1991) Organization of CA1 projections to the subiculum: a PHA-L analysis in the rat. Hippocampus 1:415–435. - PubMed
    1. Amaral DG (1993) Emerging principles of intrinsic hippocampal organization. Curr Opin Neurobiol 3:225–229. 10.1016/0959-4388(93)90214-J - DOI - PubMed

Publication types

MeSH terms