

Superresolution and pulse-chase imaging reveal the role of vesicle transport in polar growth of fungal cells
- PMID: 29387789
- PMCID: PMC5787382
- DOI: 10.1126/sciadv.1701798
Superresolution and pulse-chase imaging reveal the role of vesicle transport in polar growth of fungal cells
Abstract
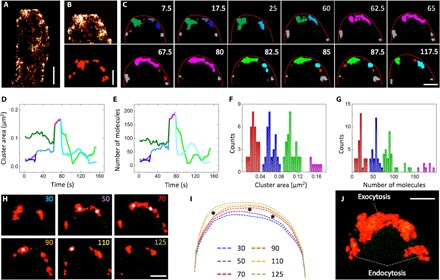
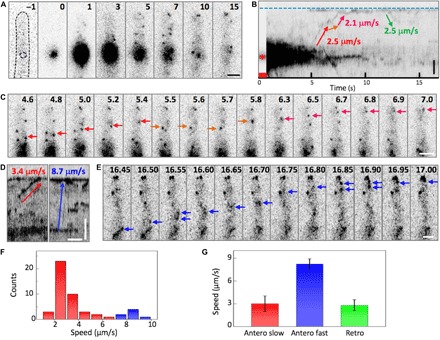
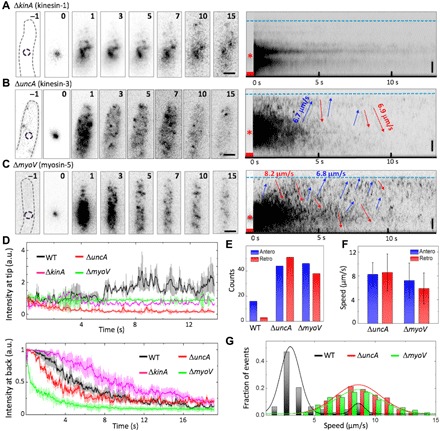
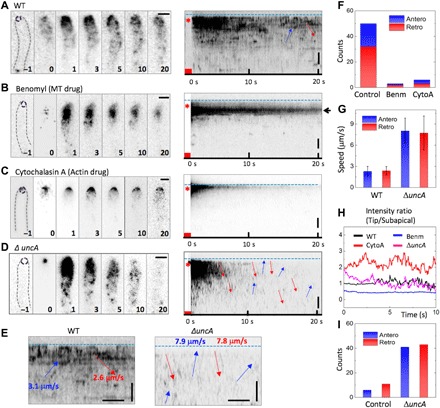
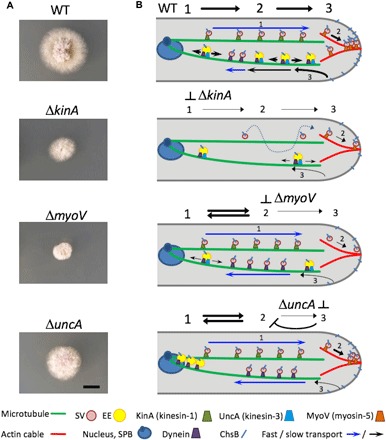
Polarized growth of filamentous fungi requires continuous transport of biomolecules to the hyphal tip. To this end, construction materials are packaged in vesicles and transported by motor proteins along microtubules and actin filaments. We have studied these processes with quantitative superresolution localization microscopy of live Aspergillus nidulans cells expressing the photoconvertible protein mEosFPthermo fused to the chitin synthase ChsB. ChsB is mainly located at the Spitzenkörper near the hyphal tip and produces chitin, a key component of the cell wall. We have visualized the pulsatory dynamics of the Spitzenkörper, reflecting vesicle accumulation before exocytosis and their subsequent fusion with the apical plasma membrane. Furthermore, high-speed pulse-chase imaging after photoconversion of mEosFPthermo in a tightly focused spot revealed that ChsB is transported with two different speeds from the cell body to the hyphal tip and vice versa. Comparative analysis using motor protein deletion mutants allowed us to assign the fast movements (7 to 10 μm s-1) to transport of secretory vesicles by kinesin-1, and the slower ones (2 to 7 μm s-1) to transport by kinesin-3 on early endosomes. Our results show how motor proteins ensure the supply of vesicles to the hyphal tip, where temporally regulated exocytosis results in stepwise tip extension.
Figures
Similar articles
-
Control of Actin and Calcium for Chitin Synthase Delivery to the Hyphal Tip of Aspergillus.Curr Top Microbiol Immunol. 2020;425:113-129. doi: 10.1007/82_2019_193. Curr Top Microbiol Immunol. 2020. PMID: 31974757 Review.
-
Transportation of Aspergillus nidulans Class III and V Chitin Synthases to the Hyphal Tips Depends on Conventional Kinesin.PLoS One. 2015 May 8;10(5):e0125937. doi: 10.1371/journal.pone.0125937. eCollection 2015. PLoS One. 2015. PMID: 25955346 Free PMC article.
-
The N-terminal disordered region of ChsB regulates its efficient transport to the hyphal apical surface in Aspergillus nidulans.Curr Genet. 2023 Jun;69(2-3):175-188. doi: 10.1007/s00294-023-01267-1. Epub 2023 Apr 18. Curr Genet. 2023. PMID: 37071151 Free PMC article.
-
Endocytic recycling via the TGN underlies the polarized hyphal mode of life.PLoS Genet. 2018 Apr 2;14(4):e1007291. doi: 10.1371/journal.pgen.1007291. eCollection 2018 Apr. PLoS Genet. 2018. PMID: 29608571 Free PMC article.
-
Polarized growth in fungi--interplay between the cytoskeleton, positional markers and membrane domains.Mol Microbiol. 2008 May;68(4):813-26. doi: 10.1111/j.1365-2958.2008.06193.x. Epub 2008 Apr 8. Mol Microbiol. 2008. PMID: 18399939 Review.
Cited by
-
Trade-off between Plasticity and Velocity in Mycelial Growth.mBio. 2021 Mar 16;12(2):e03196-20. doi: 10.1128/mBio.03196-20. mBio. 2021. PMID: 33727355 Free PMC article.
-
Hyphae of the fungus Aspergillus nidulans demonstrate chemotropism to nutrients and pH.PLoS Biol. 2024 Jul 30;22(7):e3002726. doi: 10.1371/journal.pbio.3002726. eCollection 2024 Jul. PLoS Biol. 2024. PMID: 39078817 Free PMC article.
-
Off the wall: The rhyme and reason of Neurospora crassa hyphal morphogenesis.Cell Surf. 2019 Mar 8;5:100020. doi: 10.1016/j.tcsw.2019.100020. eCollection 2019 Dec. Cell Surf. 2019. PMID: 32743136 Free PMC article. Review.
-
Raman Micro-spectroscopy and Imaging of Filamentous Fungi.Microbes Environ. 2022;37(6):ME22006. doi: 10.1264/jsme2.ME22006. Microbes Environ. 2022. PMID: 35387945 Free PMC article. Review.
-
Synchronization of oscillatory growth prepares fungal hyphae for fusion.Elife. 2023 Aug 21;12:e83310. doi: 10.7554/eLife.83310. Elife. 2023. PMID: 37602797 Free PMC article.
References
-
- Goehring N. W., Grill S. W., Cell polarity: Mechanochemical patterning. Trends Cell Biol. 23, 72–80 (2013). - PubMed
-
- Garcia-Vidal C., Viasus D., Carratalà J., Pathogenesis of invasive fungal infections. Curr. Opin. Infect. Dis. 26, 270–276 (2013). - PubMed
-
- Punt P. J., van Biezen N., Conesa A., Albers A., Mangnus J., van den Hondel C., Filamentous fungi as cell factories for heterologous protein production. Trends Biotechnol. 20, 200–206 (2002). - PubMed
-
- Rittenour W. R., Si H., Harris S. D., Hyphal morphogenesis in Aspergillus nidulans. Fungal Biol. Rev. 23, 20–29 (2009).
Publication types
MeSH terms
Substances
LinkOut - more resources
Full Text Sources
Other Literature Sources
