. 2018 Jul;75(13):2407-2429.
doi: 10.1007/s00018-017-2734-3. Epub 2018 Jan 31.

Retinoic acid signaling and neurogenic niche regulation in the developing peripheral nervous system of the cephalochordate amphioxus

Affiliations

Retinoic acid signaling and neurogenic niche regulation in the developing peripheral nervous system of the cephalochordate amphioxus

Elisabeth Zieger et al. Cell Mol Life Sci. 2018 Jul.

Abstract

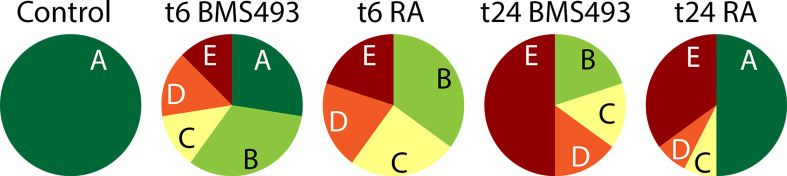
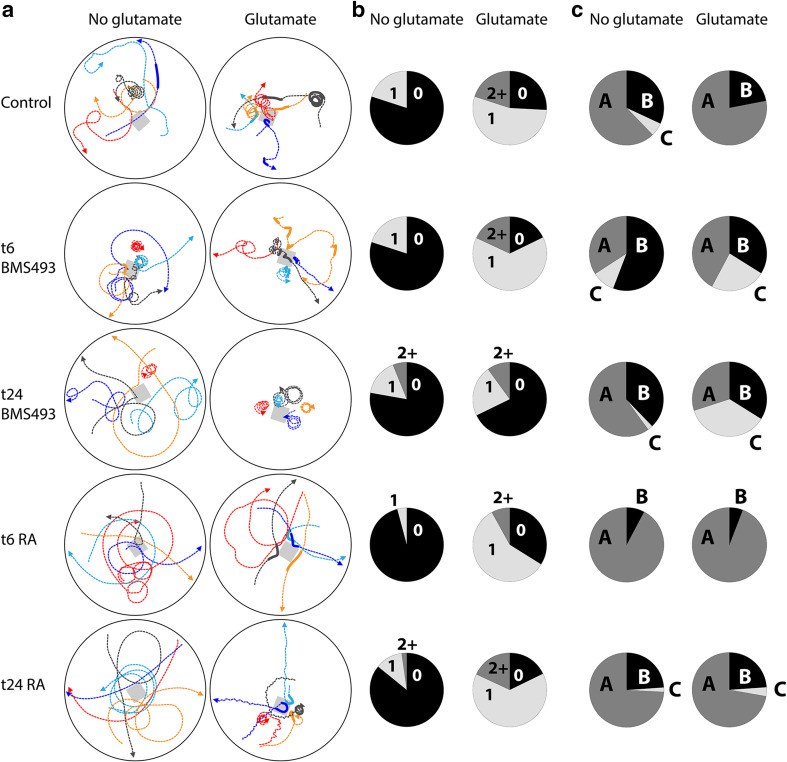
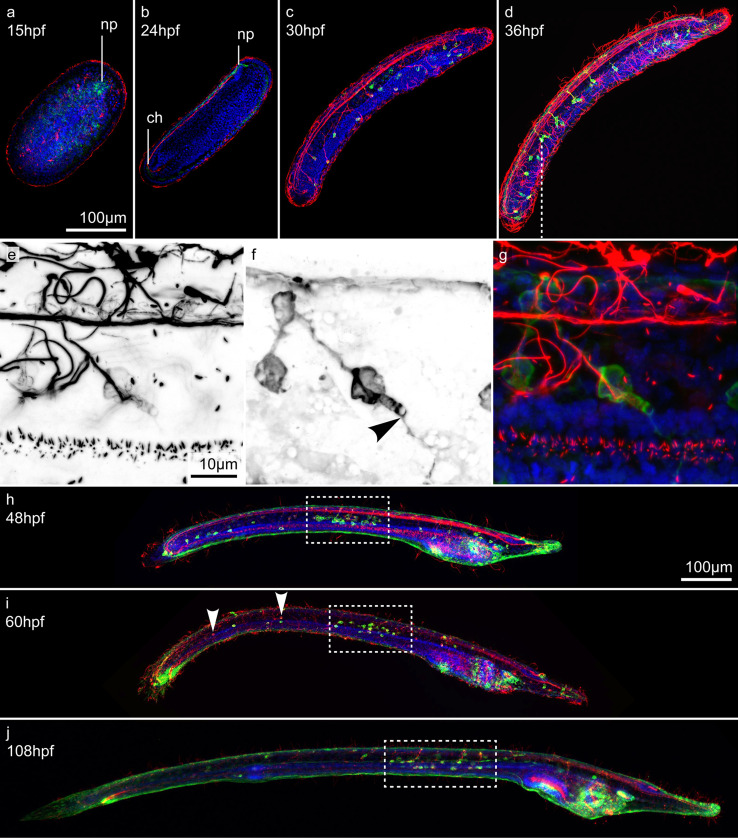
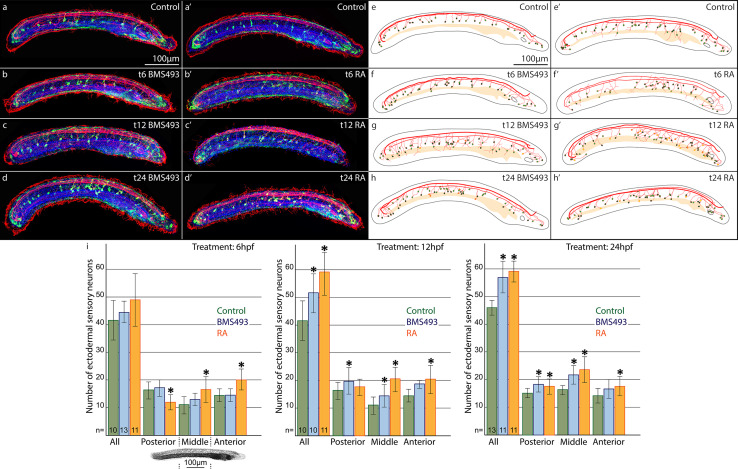
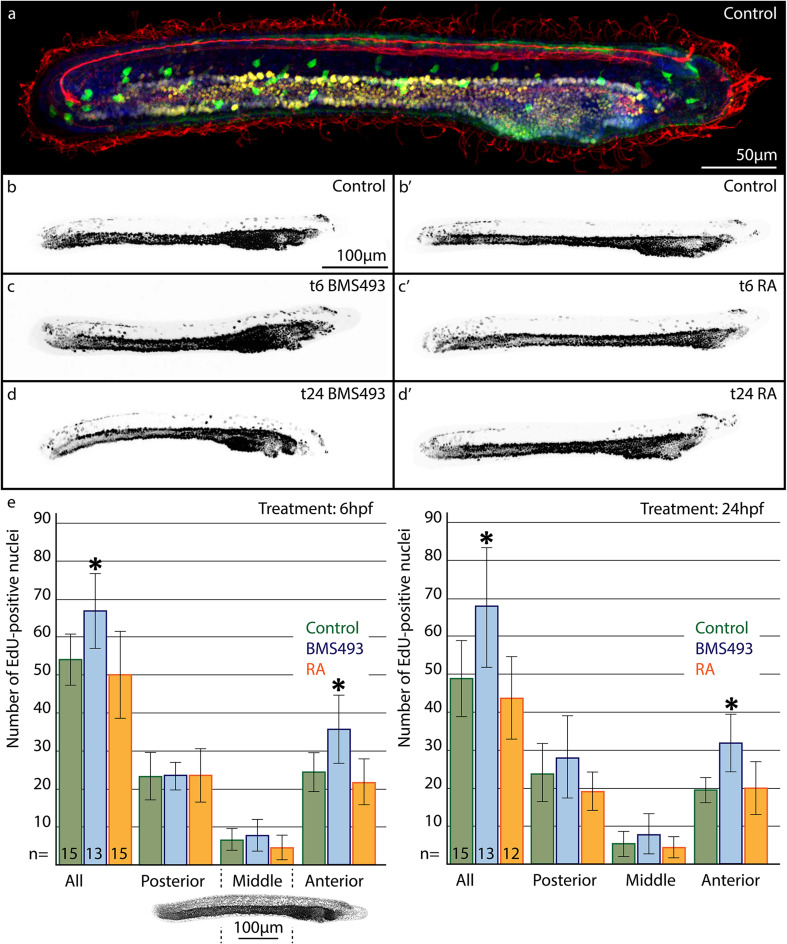
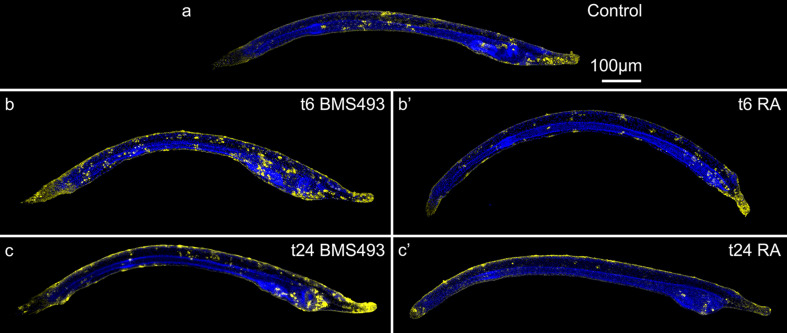
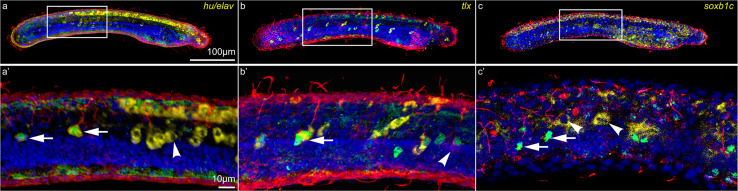
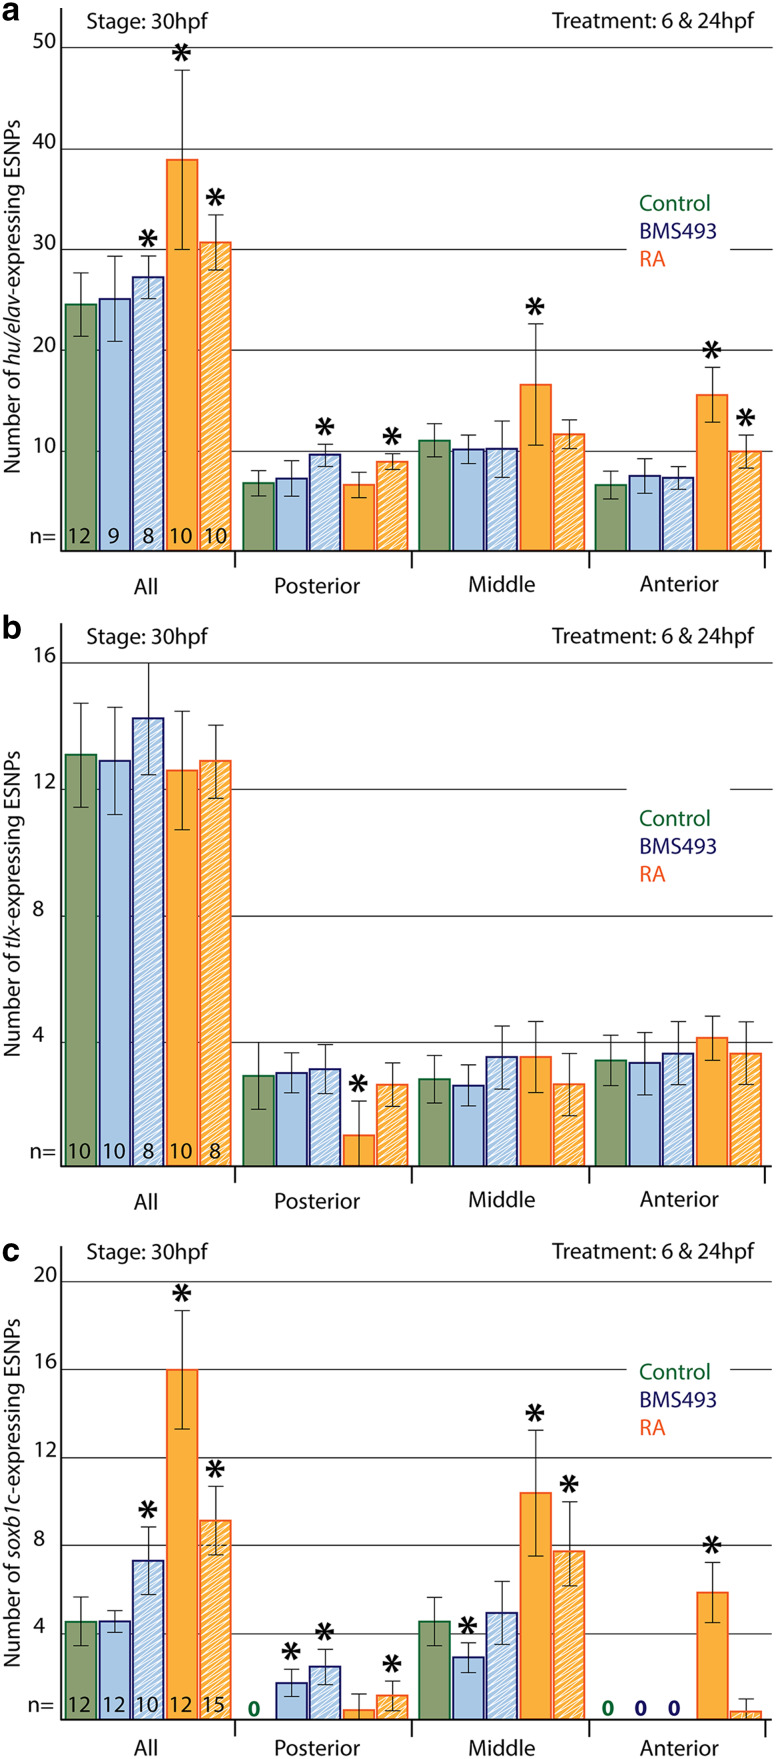
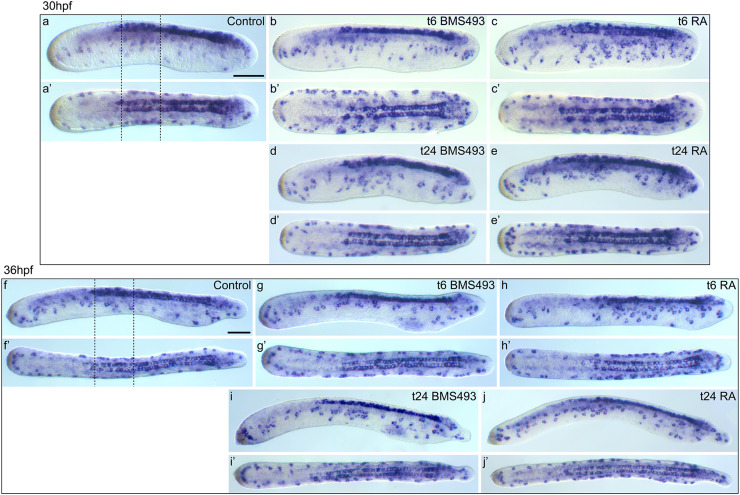
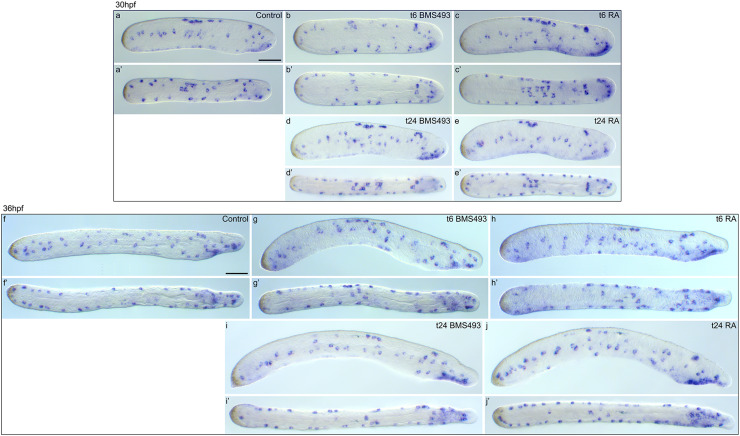
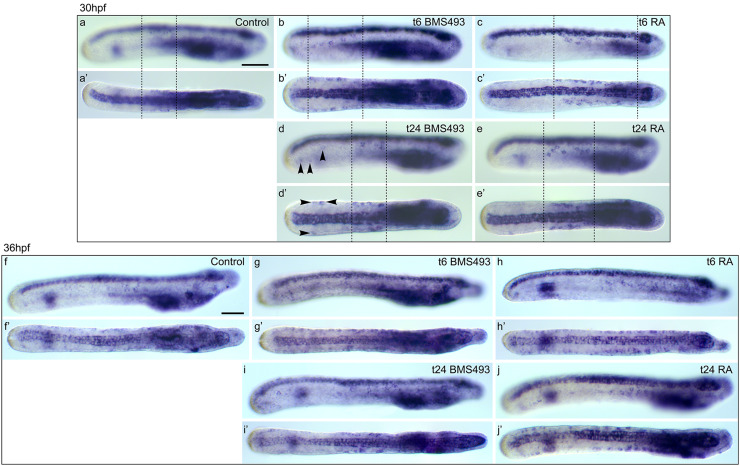
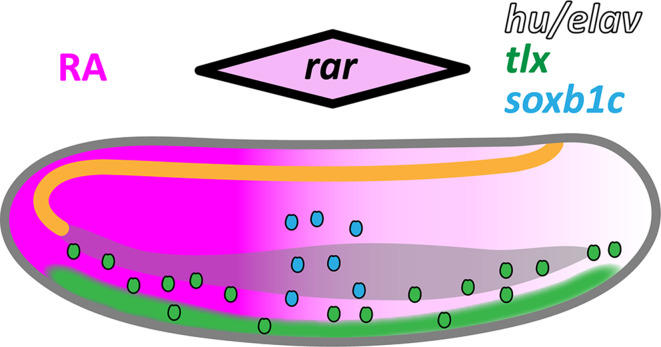
The retinoic acid (RA) signaling pathway regulates axial patterning and neurogenesis in the developing central nervous system (CNS) of chordates, but little is known about its roles during peripheral nervous system (PNS) formation and about how these roles might have evolved. This study assesses the requirement of RA signaling for establishing a functional PNS in the cephalochordate amphioxus, the best available stand-in for the ancestral chordate condition. Pharmacological manipulation of RA signaling levels during embryogenesis reduces the ability of amphioxus larvae to respond to sensory stimulation and alters the number and distribution of ectodermal sensory neurons (ESNs) in a stage- and context-dependent manner. Using gene expression assays combined with immunohistochemistry, we show that this is because RA signaling specifically acts on a small population of soxb1c-expressing ESN progenitors, which form a neurogenic niche in the trunk ectoderm, to modulate ESN production during elongation of the larval body. Our findings reveal an important role for RA signaling in regulating neurogenic niche activity in the larval amphioxus PNS. Although only few studies have addressed this issue so far, comparable RA signaling functions have been reported for neurogenic niches in the CNS and in certain neurogenic placode derivatives of vertebrates. Accordingly, the here-described mechanism is likely a conserved feature of chordate embryonic and adult neural development.

Keywords: Evolution of development; Lancelet; Neural stem cells; Retinoid pathway; Sensory functions.


Conflict of interest statement

The authors declare that they have no competing interests.

Figures

Fig. 1
Fig. 1
Effects of retinoic acid (RA) signaling alterations on mechanoreception in amphioxus larvae. Amphioxus embryos were exposed to DMSO (control), the RA receptor (RAR) antagonist BMS493 or all-trans RA, starting from the treatment time points (t): 6 or 24 hpf (hours post fertilization). For each treatment condition, the responses of n = 50 larvae at the 48 hpf stage to a mechanical stimulus were assessed and counted. The response A (dark green) corresponds to a quick muscular swimming movement away from the stimulus and was shown by all control animals, the response B (light green) to an intense wiggling and bending movement without clear directionality, the response C (yellow) to a short wiggling motion on the spot, the response D (orange) to short disconnected twitches or bends on the spot, and the response E (red) to no visible movement or reaction
Fig. 2
Fig. 2
Effects of retinoic acid (RA) signaling alterations on glutamate chemoreception in amphioxus larvae. a Experimental setup. Starting from treatment time points (t) at 6 or 24 hpf (hours post fertilization), embryos were exposed to DMSO (control), the RA receptor antagonist BMS493 or all-trans RA. Upon reaching the 48 hpf stage, larvae from each treatment condition were transferred into separate Petri dishes (black circles) containing 2.5 ml of artificial seawater. Next, a block of low-melting agarose (grey squares), which had either been dissolved in artificial seawater (no glutamate) or in artificial seawater containing 0.1 M l-glutamate, was placed into each Petri dish. Reactions of the animals were filmed for 12 min. For subsequent analyses, only larvae that passed the agarose block within a 1 cm radius and within 0.5–10 min after introduction of the agarose block were considered. Colored lines depict the trajectories of five randomly selected larvae. Dotted lines and fat lines, respectively, represent slow ciliary and fast muscular swimming. Arrowheads indicate the direction of the swimming movement. b Muscular swimming events were counted for n = 50 larvae per treatment condition. In the pie charts, the size of an individual slice corresponds to the percentage of animals that exhibited a given number of swimming events (i.e., 0 = no muscular swimming, 1 = a single event of muscular swimming, 2 + = two or more events of muscular swimming). c Swimming patterns were assessed and counted for n = 50 animals per treatment condition. Three types of swimming patterns were distinguished: A = swimming in straight lines or wide angles, B = swimming in straight lines or wide angles plus periods of circling/spiraling, and C = circling/spiraling for the entire observation period. In the pie charts, the size of an individual slice indicates the percentage of animals exhibiting a given swimming pattern
Fig. 3
Fig. 3
Development of ectodermal sensory neurons (ESNs) in amphioxus. All animals were stained with an antibody against glutamate (GLU, green), an antibody against acetylated tubulin (AT, red), and the nucleic acid dye Hoechst (blue). a Dorsal view and bj lateral views of amphioxus larvae at different developmental stages, from 15 to 108 hpf (hours post fertilization). Anterior ends are directed towards the right. eg Close-ups featuring a group of ESNs in an amphioxus larva at 36 hpf. e, f Single, color-inverted, fluorescent signal for AT-ir and GLU-ir, respectively. Arrowhead in f indicates the finger-shaped apex and fine dendrites of a type II ESN. hj Dotted boxes indicate densely clustered ESNs in the mid-trunk ectoderm of late amphioxus larvae. Arrowheads in i indicate AT-positive, but GLU-negative, ESNs. Abbreviations: ch, chordoneural hinge; np, neuropore. Scale bar in a also applies to bd, scale bar in e also applies to f, g and scale bar in h also applies to i, j
Fig. 4
Fig. 4
Effects of retinoic acid (RA) signaling alterations on the development of ectodermal sensory neurons (ESNs) in amphioxus. ad′ Larvae at 36 hpf (hours post fertilization) were stained for glutamate-immunoreactivity (GLU-ir, green), acetylated tubulin-ir (AT-ir, red), and with the nucleic acid dye Hoechst (blue). eh′ Schematic drawings of the animals shown in ad′. Outlines of the animals and their pre-oral pits are depicted in grey, the gut in bright yellow, and neural projections in red. ESNs are depicted as circles with a red outline that are filled with either green or yellow color to represent the presence or absence of GLU-ir, respectively. Animals had been treated with either DMSO (control, a, a′, e, e′), with the RA receptor (RAR) antagonist BMS493 (bd, fh), or with all-trans RA (b′–d′, f′–h′), starting from different treatment time points (t), at either 6, 12 or 24 hpf, as indicated. i Statistical analyses of the observed effects of RA signaling alterations on ESN formation. Colored bars depict the average number of ESNs in the whole ectoderm (all) or in specific ectodermal sections along the anterior–posterior axis. The image below the first diagram shows Hoechst labeling (grey) in a larva at 36 hpf, with dotted lines marking the sections of the ectoderm (posterior, middle, anterior), in which ESNs were counted. Green bars stand for control animals, blue bars for animals treated with BMS493, and red bars for animals treated with all-trans RA. For each diagram, treatment time points (t), at 6, 12 or 24 hpf, are given in the upper right corner and the number (n) of animals counted per condition is indicated at the base of the first three colored bars. Error bars depict the standard deviation (σ). An asterisk (*) above an error bar indicates that the difference between this condition and the corresponding control is statistically significant. The scale bar in a also applies to bd, a′–d′, and the scale bar in e also applies to fh, e′–h
Fig. 5
Fig. 5
Effects of retinoic acid (RA) signaling alterations on cell proliferation in the ectoderm of amphioxus larvae. ad′ Animals at 36 hpf (hours post fertilization) are shown in lateral view with their anterior ends directed towards the right. a Larva that was stained for 5-ethynyl-2′-deoxyuridine (EdU, yellow), for glutamate-immunoreactivity (GLU-ir, green), for acetylated tubulin-ir (AT-ir, red), and with the nucleic acid dye Hoechst (blue). bd′ Images showing only the color-inverted fluorescent signal for EdU (grey). ab′ Control animals treated with DMSO. c, d Animals treated with the RA receptor (RAR) antagonist BMS493. c′, d′ Animals treated with all-trans RA. The treatment time points (t), at either 6 or 24 hpf, are given in the upper right corner of each image. e Statistical analyses of the observed effects of RA signaling alterations on ectodermal cell proliferation. Colored bars depict the average number of EdU-positive nuclei present in the whole ectoderm (all) or in specific ectodermal sections along the anterior–posterior axis. The image below the first diagram shows Hoechst labeling (grey) in a larva at 36 hpf, with dotted lines marking the sections of the ectoderm (posterior, middle, anterior), in which EdU-positive nuclei were counted. Green, blue, and red bars stand, respectively, for control animals, for animals treated with BMS493, and for animals treated with all-trans RA. For each diagram, treatment time points (t), at either 6 or 24 hpf, are given in the upper right corner, and the number (n) of animals that were counted per condition is indicated at the base of the first three colored bars. Error bars depict the standard deviation (σ). Asterisks (*) above error bars indicate that the difference between this condition and the corresponding control is statistically significant. The scale bar in b also applies to c, d, b′–d
Fig. 6
Fig. 6
Effects of retinoic acid (RA) signaling alterations on apoptosis in amphioxus larvae. Animals at 60 hpf (hours post fertilization) were stained with a terminal deoxynucleotidyl transferase dUTP nick end labeling (TUNEL) kit for apoptotic cells (yellow) and with the nucleic acid dye Hoechst (blue). All larvae are shown in lateral view with their anterior ends directed towards the right. a Control animal that was treated at 6 hpf with DMSO. b, c Animals that were treated with the RA receptor (RAR) antagonist BMS493 at two different developmental stages, 6 or 24 hpf. b′, c′ Animals that were treated with all-trans RA at two different developmental stages, 6 or 24 hpf. The treatment time point (t) is given in the upper right corner of each image. Scale bar in a applies to all images
Fig. 7
Fig. 7
Co-localization of neural marker gene expression with ectodermal sensory neurons (ESNs) in amphioxus larvae. All animals are shown in lateral view with their anterior end directed towards the right. a, ahu/elav, b, btlx, and c, csoxb1c gene expression (yellow) was detected in amphioxus larvae at 36 hpf (hours post fertilization). ESNs were labeled by immunostaining against glutamate (GLU-ir, green) and acetylated tubulin (AT-ir, red). Nuclei were labeled with the nucleic acid dye Hoechst (blue). The white boxes in ac indicate the position of the respective close-ups shown in a′–c′. Close-ups were generated from confocal z-stacks that only include the lateral ectoderm on one side of the larvae. Arrows in a′ indicate differentiated ESNs expressing hu/elav and the arrowhead an undifferentiated ESN progenitor (ESNP) expressing hu/elav. The arrow in b′ highlights a differentiated ESN expressing tlx and the arrowhead a differentiated ESN that does not express tlx. Arrows in c′ mark differentiated ESNs that do not express soxb1c and the arrowheads undifferentiated ESNPs expressing soxb1c. The scale bar in a also applies to b, c, and the scale bar in a′ also applies to b′, c
Fig. 8
Fig. 8
Statistical analyses of the effects of retinoic acid (RA) signaling alterations on amphioxus ectodermal sensory neuron progenitor (ESNP) development. The number and anterior–posterior distribution of a hu/elav-, b tlx-, and c soxb1c-expressing ESNPs was assessed in larvae at 30 hpf (hours post fertilization). ESNPs were only counted in the lateral ectoderm on one side of the animals. Colored bars depict the average number of ESNPs either in the entire lateral ectoderm (all) or in a specific ectodermal section along the anterior–posterior axis (posterior, middle, anterior). Green bars stand for control animals, blue bars stand for animals treated with the RA receptor (RAR) antagonist BMS493, and red bars stand for animals treated with all-trans RA. Treatments began either at 6 (solid colored bars) or 24 hpf (striped colored bars). The number (n) of animals that were counted for each condition is indicated at the base of the first five colored bars. The error bars depict the standard deviation (σ), and an asterisk (*) above an error bar indicates that the difference between this condition and the corresponding control is statistically significant
Fig. 9
Fig. 9
Effects of retinoic acid (RA) signaling alterations on development of hu/elav-expressing cells in amphioxus. ae′ Larvae at 30 hpf (hours post fertilization) and fj′ larvae at 36 hpf are shown in lateral view (aj) and dorsal view (a–j′). a, a′, f, f′ Control animals treated with DMSO at 6 hpf. Dotted lines indicate the mid-trunk area, where a particularly high density of ectodermal sensory neuron progenitors (ESNPs) is observed (compare with Additional file 7: Figure S4). b, b′, d, d′, g, g′, i, i′ Animals treated with the RA receptor (RAR) antagonist BMS493 at two different developmental stages, 6 or 24 hpf. c, c′, e, e′, h, h′, j, j′ Animals treated with all-trans RA at two different developmental stages, 6 or 24 hpf. The treatment time point (t), 6 or 24 hpf, is indicated in the upper right corner of each image set. Scale bars are 50 µm. The scale bar in a also applies to a′, be′, and the scale bar in f also applies to f′, gj
Fig. 10
Fig. 10
Effects of retinoic acid (RA) signaling alterations on the development of tlx-expressing cells in amphioxus. ae′ Larvae at 30 hpf (hours post fertilization) and fj′ larvae at 36 hpf are shown in lateral view (aj) and dorsal view (a′–j′). a, a′, f, f′ Control animals treated, at 6 hpf, with DMSO. b, b′, d, d′, g, g′, i, i′ Animals treated with the RA receptor (RAR) antagonist BMS493 at two different developmental stages, 6 or 24 hpf. c, c′, e, e′, h, h′, j, j′ Animals treated with all-trans RA at two different developmental stages, 6 or 24 hpf. The treatment time point (t), 6 or 24 hpf, is indicated in the right upper corner of each image set. Scale bars are 50 µm. The scale bar in a also applies to a′, be′, and the scale bar in f also applies to f′, gj
Fig. 11
Fig. 11
Effects of retinoic acid (RA) signaling alterations on the development of soxb1c-expressing cells in amphioxus. ae′ Larvae at 30 hpf (hours post fertilization) and fj′ larvae at 36 hpf are shown in lateral view (aj) and dorsal view (a′–j′). All images are focused only on soxb1c-expressing cells in the ectoderm. a, a′, f, f′ Control animals treated at 6 hpf with DMSO. b, b′, d, d′, g, g′, i, i′ Animals treated with the RA receptor (RAR) antagonist BMS493 at two different developmental stages, 6 or 24 hpf. c, c′, e, e′, h, h′, j, j′ Animals treated with all-trans RA at two different developmental stages, 6 or 24 hpf. The treatment time point (t), 6 or 24 hpf, is indicated in the right upper corner of each image set. ae′ Dotted lines mark the ectodermal domain that contains soxb1c-expressing ectodermal sensory neuron progenitors (ESNPs) (compare with Additional file 9: Figure S6). d, d′ Arrowheads mark soxb1c-expressing ESNPs that are induced specifically in the tail ectoderm of early larvae, which had been treated with BMS493 at 24 hpf. Scale bars are 50 µm. The scale bar in a also applies to a′, be′, and the scale bar in f also applies to f, gj
Fig. 12
Fig. 12
Retinoic acid (RA) signaling dependence of ectodermal sensory neuron (ESN) formation in amphioxus. Schematic representation of an amphioxus larva at 30 h post fertilization (hpf) with the anterior end directed towards the right. The central nervous system (CNS) is drawn in orange, the gut is drawn in gray, and a posterior-high gradient of RA signaling is indicated in magenta. ESN progenitors (ESNPs) are depicted as small ovals. Ectodermal expression of neural marker genes is shown as a black outline for hu/elav, as green filling for tlx, and as blue filling for soxb1c. Initially, tlx is widely expressed in the ventral ectoderm, but gradually becomes restricted to individual ESNPs that migrate dorsally. During early embryogenesis, RA signaling levels mildly influence the distribution of tlx-expressing ESNPs. The hu/elav gene is likely expressed in all specified ESNPs. In contrast, soxb1c expression is only detected in a small population of late developing ESNPs, located at mid-trunk levels in the dorso-lateral ectoderm. The single amphioxus rar gene is also most strongly expressed in this ectodermal domain [29, 41], as indicated by the black-outlined rhombus shown above the larva. Our data suggest that medium levels of RA signaling in the mid-trunk ectoderm contribute to specification of the soxb1c-expressing ESNP population and regulate its neurogenic activity

Similar articles

Cited by

References

    1. Wang Y, Chen J, Du C, et al. Characterization of retinoic acid-induced neurobehavioral effects in developing zebrafish. Environ Toxicol Chem. 2014;33:431–437. doi: 10.1002/etc.2453. - DOI - PubMed
    1. Bailey JM, Oliveri AN, Karbhari N, et al. Persistent behavioral effects following early life exposure to retinoic acid or valproic acid in zebrafish. Neurotoxicology. 2016;52:23–33. doi: 10.1016/j.neuro.2015.10.001. - DOI - PMC - PubMed
    1. Carta M, Stancampiano R, Tronci E, et al. Vitamin A deficiency induces motor impairments and striatal cholinergic dysfunction in rats. Neuroscience. 2006;139:1163–1172. doi: 10.1016/j.neuroscience.2006.01.027. - DOI - PubMed
    1. Romand R, Krezel W, Beraneck M, et al. Retinoic acid deficiency impairs the vestibular function. J Neurosci. 2013;33:5856–5866. doi: 10.1523/JNEUROSCI.4618-12.2013. - DOI - PMC - PubMed
    1. Srour M, Caron V, Pearson T, et al. Gain-of-function mutations in RARB cause intellectual disability with progressive motor impairment. Hum Mutat. 2016;37:786–793. doi: 10.1002/humu.23004. - DOI - PubMed

Publication types

MeSH terms