

Different competing risks models for different questions may give similar results in arthroplasty registers in the presence of few events
- PMID: 29388452
- PMCID: PMC5901510
- DOI: 10.1080/17453674.2018.1427314
Different competing risks models for different questions may give similar results in arthroplasty registers in the presence of few events
Abstract
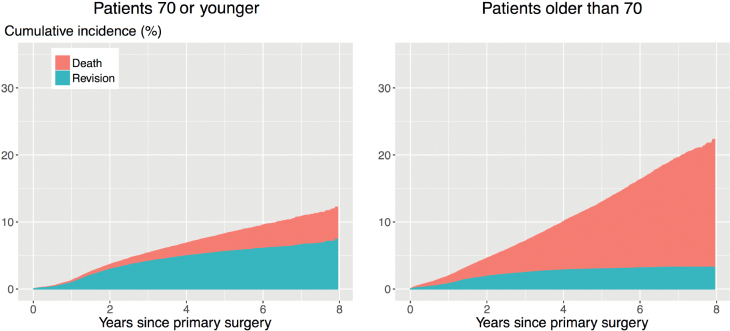
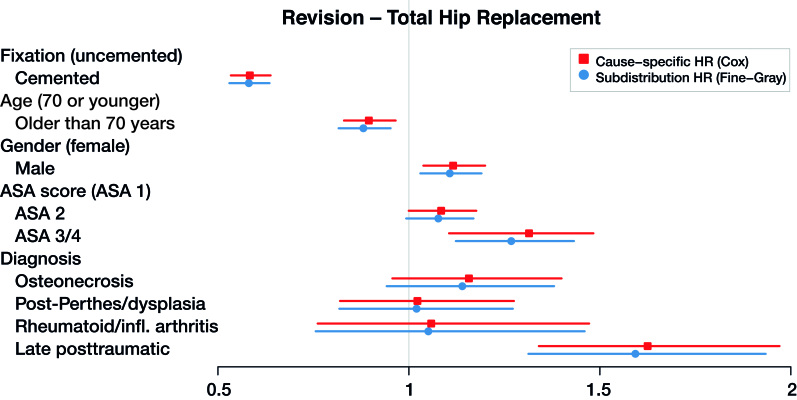
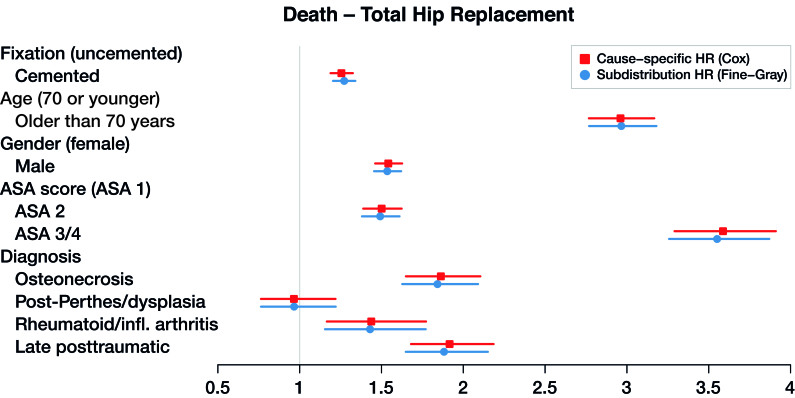
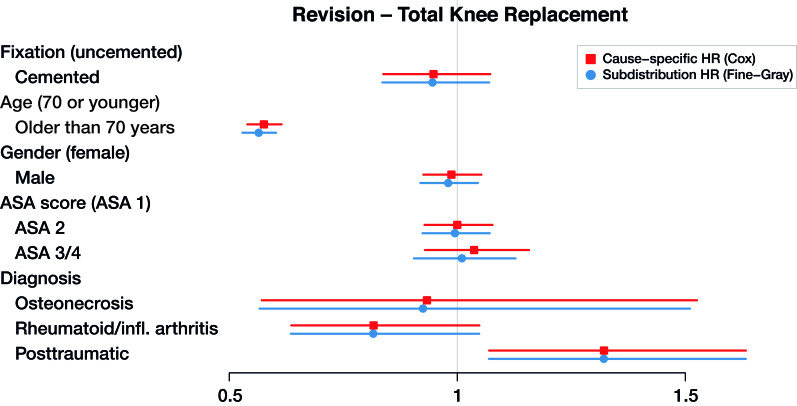
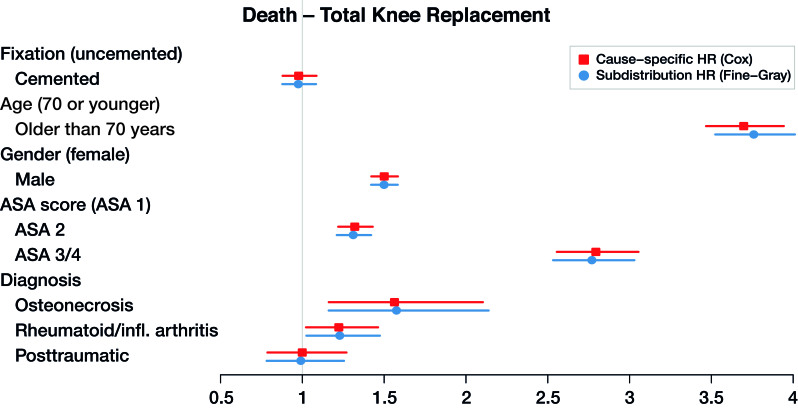
Background and purpose - In arthroplasty registry studies, the analysis of time to revision is complicated by the competing risk of death. There are no clear guidelines for the choice between the 2 main adjusted analysis methods, cause-specific Cox and Fine-Gray regression, for orthopedic data. We investigated whether there are benefits, such as insight into different aspects of progression to revision, to using either 1 or both regression methods in arthroplasty registry studies in general, and specifically when the length of follow-up is short relative to the expected survival of the implants. Patients and methods - Cause-specific Cox regression and Fine-Gray regression were performed on total hip (138,234 hips, 124,560 patients) and knee (139,070 knees, 125,213 patients) replacement data from the Dutch Arthroplasty Register (median follow-up 3.1 years, maximum 8 years), with sex, age, ASA score, diagnosis, and type of fixation as explanatory variables. The similarity of the resulting hazard ratios and confidence intervals was assessed visually and by computing the relative differences of the resulting subdistribution and cause-specific hazard ratios. Results - The outcomes of the cause-specific Cox and Fine-Gray regressions were numerically very close. The largest relative difference between the hazard ratios was 3.5%. Interpretation - The most likely explanation for the similarity is that there are relatively few events (revisions and deaths), due to the short follow-up compared with the expected failure-free survival of the hip and knee prostheses. Despite the similarity, we recommend always performing both cause-specific Cox and Fine-Gray regression. In this way, both etiology and prediction can be investigated.
Figures

References
-
- Aalen O O, Johansen S.. An empirical transition matrix for non-homogeneous Markov chains based on censored observations. Scand J Stat 1978; 5: 141–50.
-
- Ambrogi F, Biganzoli E, Boracchi P.. Estimates of clinically useful measures in competing risks survival analysis. Stat Med 2008; 27: 6407–25. - PubMed
-
- Beyersmann J, Scheike T H.. Classical regression models for competing risks In: Klein JP, van Houwelingen HC, Ibrahim JG, Scheike TH, editors. Handbook of survival analysis. Boca Raton, FL: CRC Press; 2013. pp. 157–177.
-
- Beyersmann J, Schumacher M.. Letter to the Editor: Misspecified regression model for the subdistribution hazard of a competing risk. Stat Med 2007; 26: 1649–51. - PubMed
MeSH terms
LinkOut - more resources
Full Text Sources
Other Literature Sources
Medical