. 2018 May 1;314(5):L893-L907.
doi: 10.1152/ajplung.00430.2017. Epub 2018 Feb 1.

Reactive oxygen species induced Ca2+ influx via TRPV4 and microvascular endothelial dysfunction in the SU5416/hypoxia model of pulmonary arterial hypertension

Affiliations

Reactive oxygen species induced Ca2+ influx via TRPV4 and microvascular endothelial dysfunction in the SU5416/hypoxia model of pulmonary arterial hypertension

Karthik Suresh et al. Am J Physiol Lung Cell Mol Physiol. .

Abstract

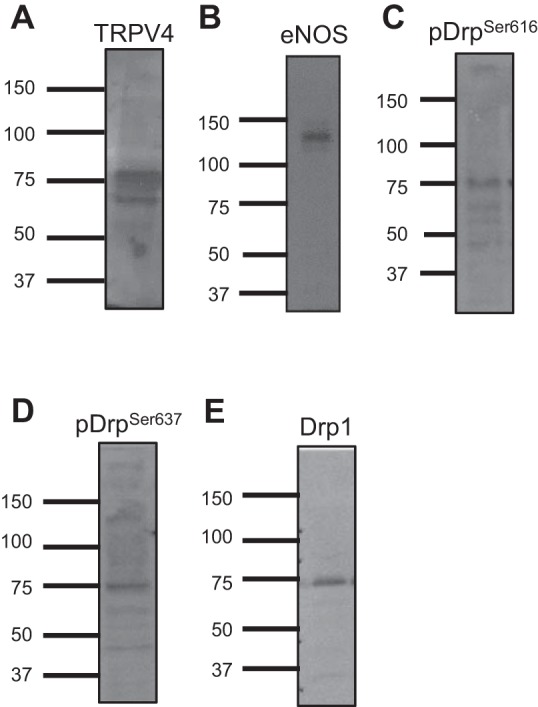
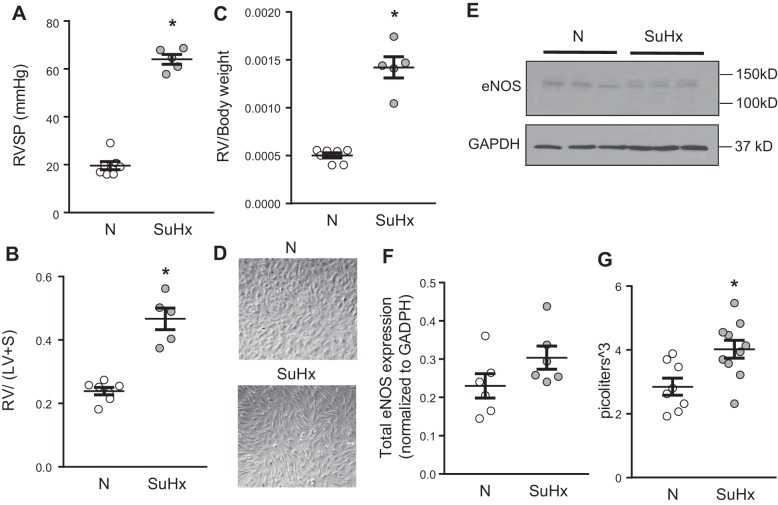
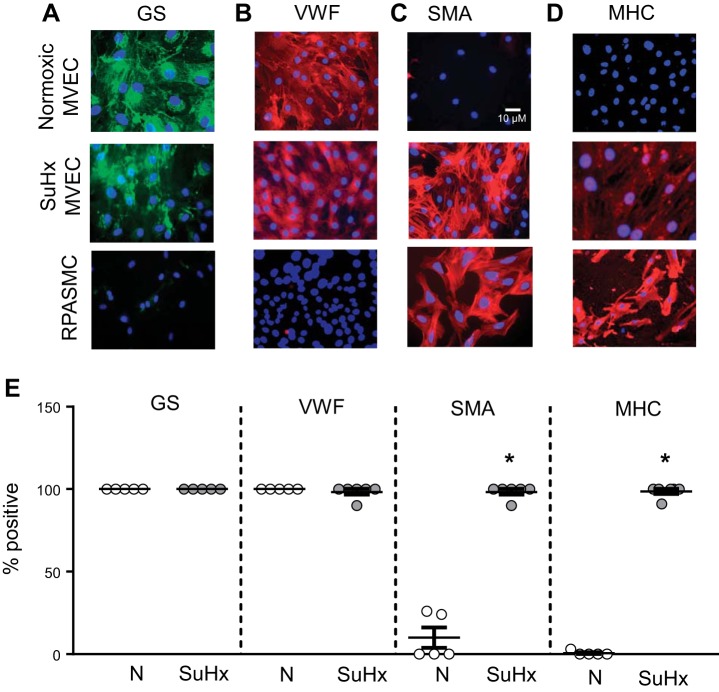
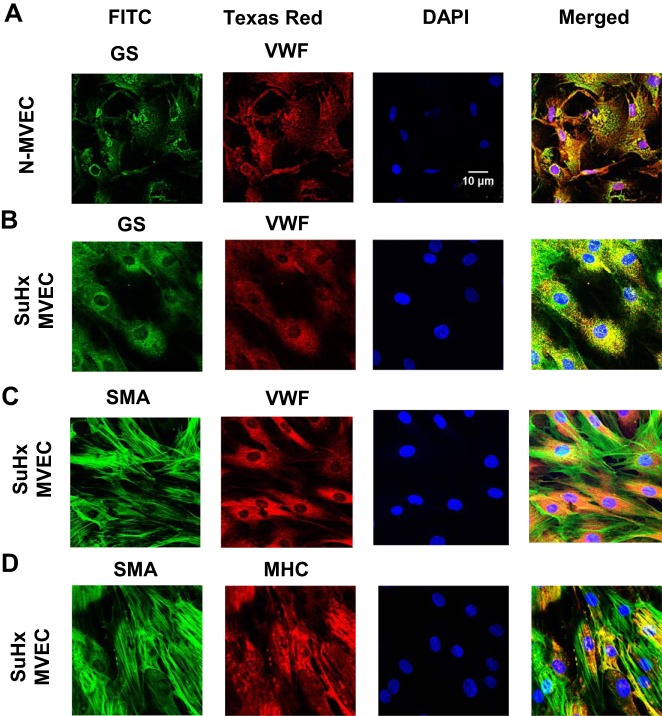
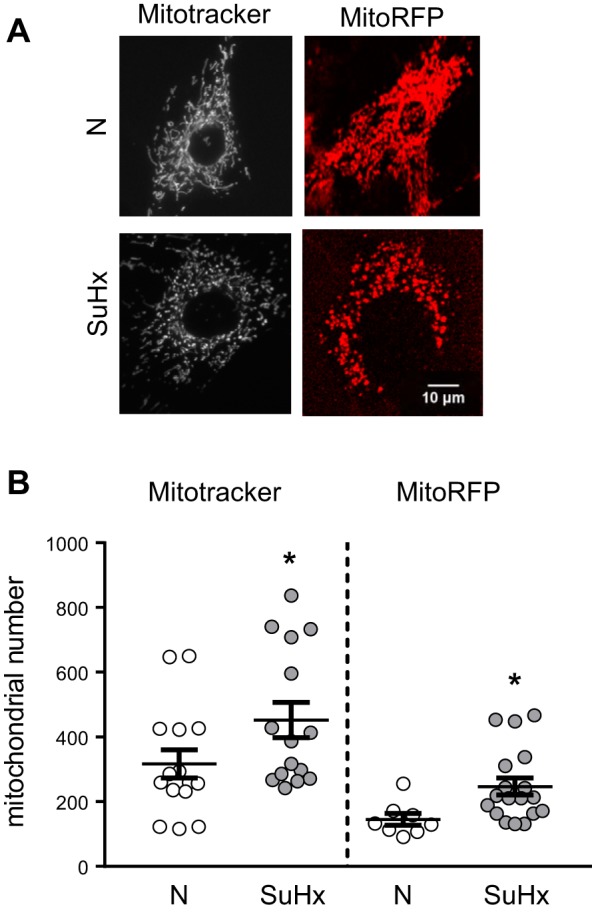
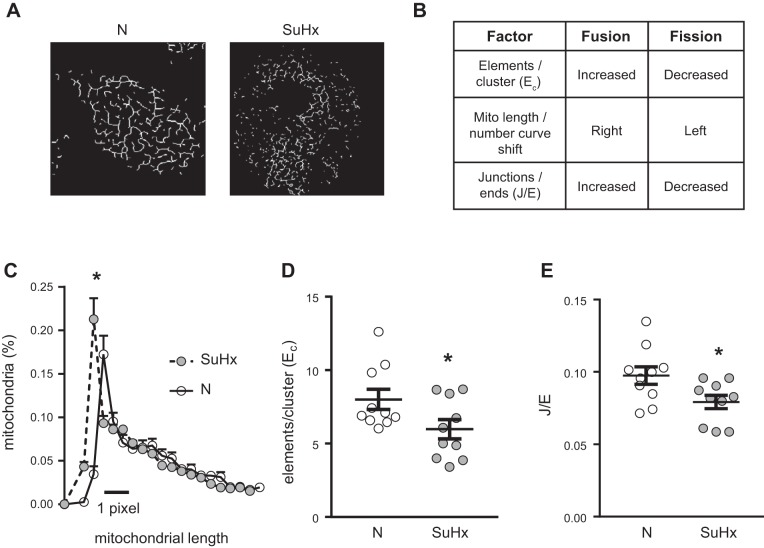
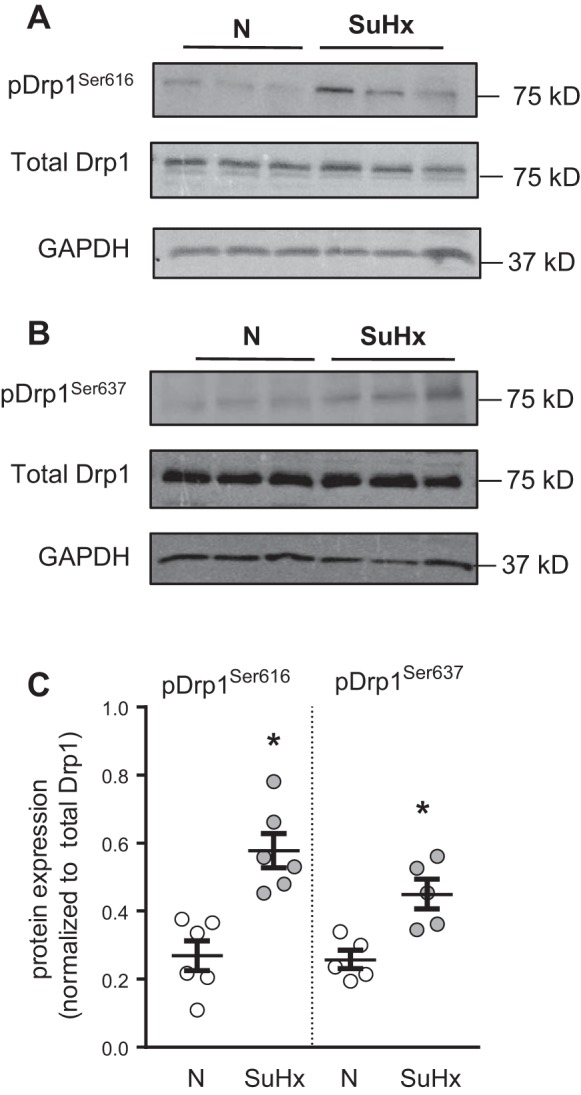
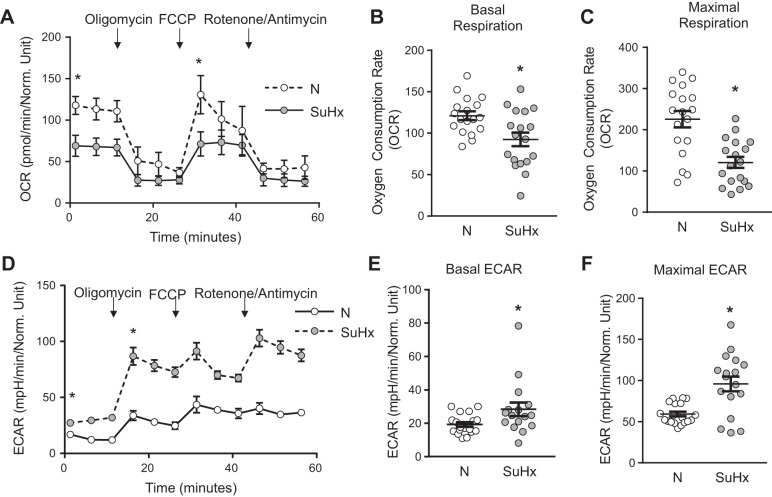
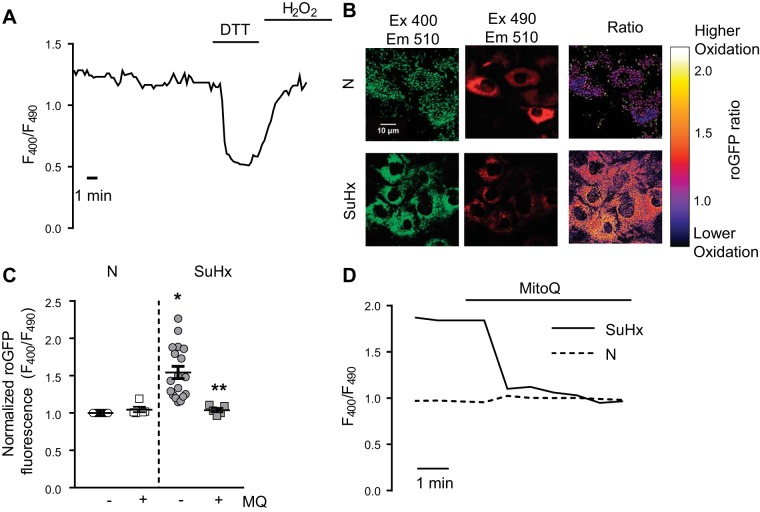
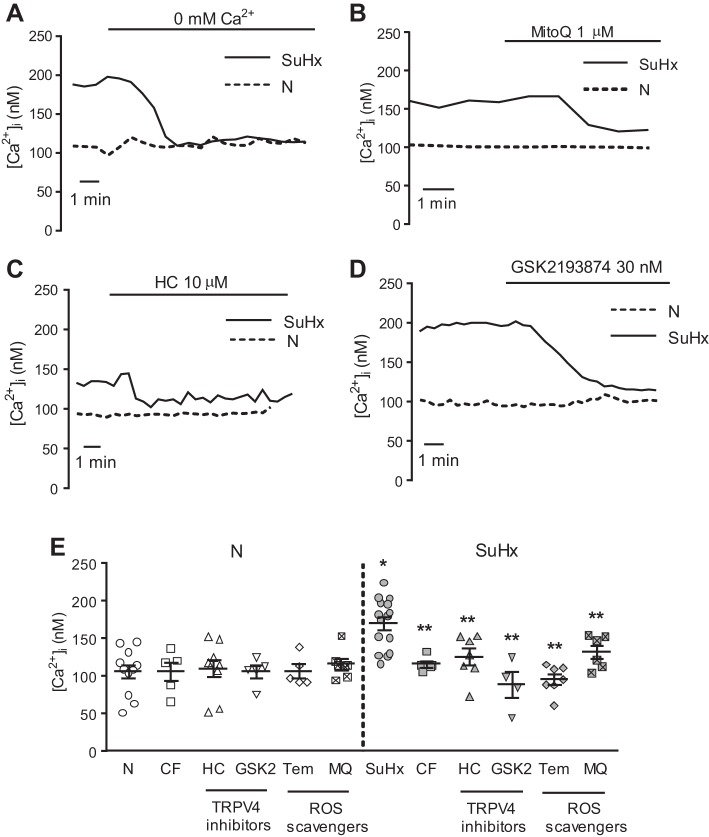
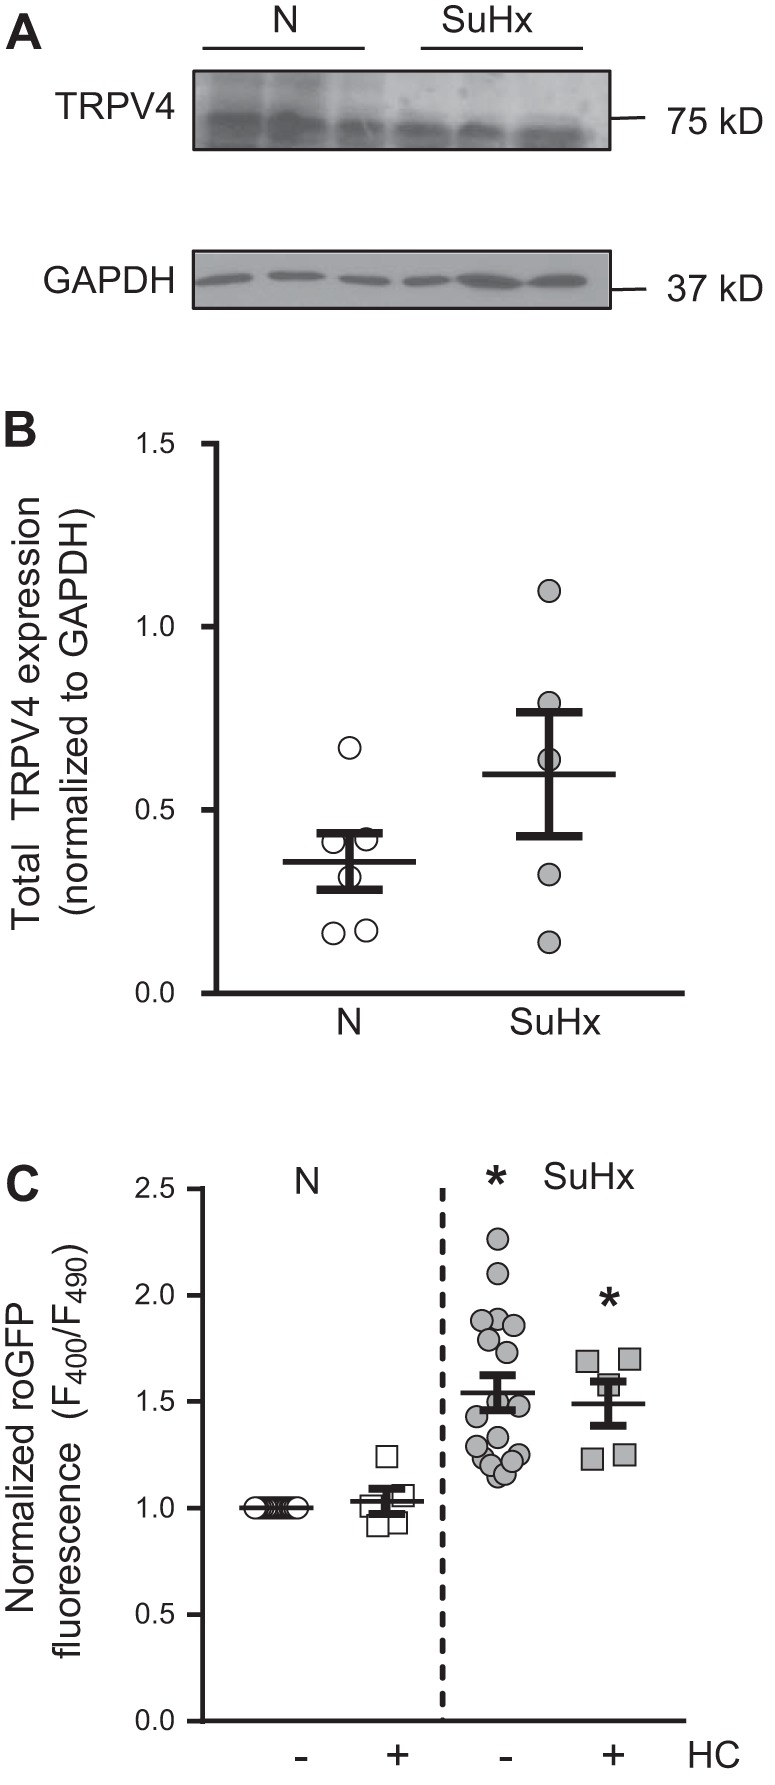
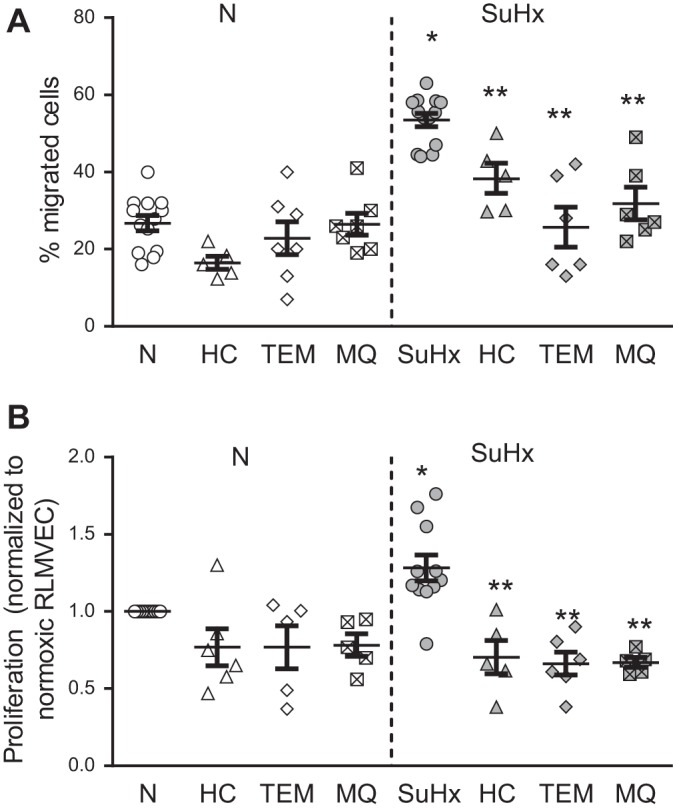
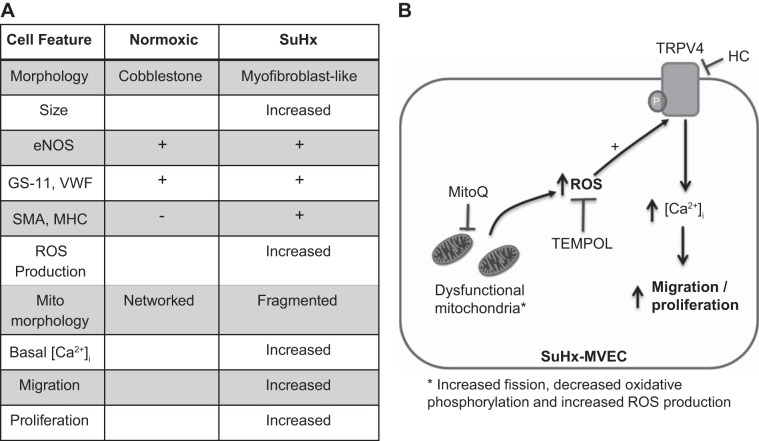
Pulmonary arterial hypertension (PAH) is a lethal disease characterized by elevations in pulmonary arterial pressure, in part due to formation of occlusive lesions in the distal arterioles of the lung. These complex lesions may comprise multiple cell types, including endothelial cells (ECs). To better understand the molecular mechanisms underlying EC dysfunction in PAH, lung microvascular endothelial cells (MVECs) were isolated from normoxic rats (N-MVECs) and rats subjected to SU5416 plus hypoxia (SuHx), an experimental model of PAH. Compared with N-MVECs, MVECs isolated from SuHx rats (SuHx-MVECs) appeared larger and more spindle shaped morphologically and expressed canonical smooth muscle cell markers smooth muscle-specific α-actin and myosin heavy chain in addition to endothelial markers such as Griffonia simplicifolia and von Willebrand factor. SuHx-MVEC mitochondria were dysfunctional, as evidenced by increased fragmentation/fission, decreased oxidative phosphorylation, and increased reactive oxygen species (ROS) production. Functionally, SuHx-MVECs exhibited increased basal levels of intracellular calcium concentration ([Ca2+]i) and enhanced migratory and proliferative capacity. Treatment with global (TEMPOL) or mitochondria-specific (MitoQ) antioxidants decreased ROS levels and basal [Ca2]i in SuHx-MVECs. TEMPOL and MitoQ also decreased migration and proliferation in SuHx-MVECs. Additionally, inhibition of ROS-induced Ca2+ entry via pharmacologic blockade of transient receptor potential vanilloid-4 (TRPV4) attenuated [Ca2]i, migration, and proliferation. These findings suggest a role for mitochondrial ROS-induced Ca2+ influx via TRPV4 in promoting abnormal migration and proliferation in MVECs in this PAH model.


Figures

Fig. 1.
Fig. 1.
Antibody validation. Representative full-length gels of rat microvascular endothelial cell lysates probed for transient receptor potential vanilloid-4 (TRPV4; 75 kDa; A), endothelial nitric oxide synthase (eNOS; 140 kDa; B), pDrp1Ser616 (C), pDrp1Ser637 (D), and total dynamin-related protein 1 (Drp1; 75 kDa; E).
Fig. 2.
Fig. 2.
Phenotyping of normoxic (N)-microvascular endothelial cells (MVECs) and SU5416 plus hypoxia (SuHx)-MVECs. AC: hemodynamics in normoxic and SuHx rats used for MVEC isolation. Scatterplots showing means ± SE values for right ventricular systolic pressure (RVSP; A), Fulton index [right ventricular to left ventricular + septal weight (RV/LV + S); B], and RV/body weight (C) in normoxic (N) and SuHx rats. *Significant difference from N rats; n = 5–7 animals/group. D: representative phase contrast photomicrographs of N-MVECs and SuHx-MVECs showing cell morphology. E and F: representative immunoblot (E) and densitometry (F) showing means ± SE endothelial nitric oxide synthase (eNOS) expression in N- and SuHx-MVECs. G: scatterplot showing means ± SE cell volume in N- and SuHx-MVECs. *Significant difference from N-MVEC control; n = 6–10 per group.
Fig. 3.
Fig. 3.
Cell surface marker expression in normoxic (N)-microvascular endothelial cells (MVECs) and SU5416 plus hypoxia (SuHx)-MVECs. AD: representative photomicrographs showing N-MVECs, SuHx-MVECs and rat pulmonary arterial smooth muscle cells (RPASMCs) stained for Griffonia simplicifolia lectin (GS; green; A), von willebrand factor (vWF; red; B), smooth muscle α-actin (SMA; red; C), myosin heavy chain (MHC; red; D), and nuclear counterstain (DAPI; blue). Scatterplot (E) showing means ± SE percent positive cells in N- and SuHx-MVECs stained for GS, vWF, SMA, and MHC. *Significant difference from GS- and vWF-stained cells; n = 5–6 images per group from experiments performed on ECs isolated from at least 5 different animals.
Fig. 4.
Fig. 4.
Confocal imaging of surface marker coexpression. Representative images showing individual channel and merged photomicrographs obtained by confocal microscopy of normoxic (N)-microvascular endothelial cells (MVECs) (A) and SU5416 plus hypoxia (SuHx)-MVECs (B) costained with EC markers Griffonia simplicifolia (GS) and von willebrand factor (vWF), SuHx-MVECs costained with EC marker vWF and smooth muscle cell (SMC) marker smooth muscle α-actin SMA (C), and SuHx-MVECs costained with SMC markers SMA and myosin heavy chain (MHC) (D).
Fig. 5.
Fig. 5.
Altered mitochondrial morphology in SU5416 plus hypoxia (SuHx)-microvascular endothelial cells (MVECs). A: representative single cell images of mitochondria in normoxic (N)-MVECs and SuHx-MVECs stained with the mitochondrial dye Mitotracker (100 nM; 30 min) or transfected with MitoRFP. B: scatterplot showing means ± SE mitochondrial number in N- and SuHx-MVECs following mitochondrial tagging with either MitoTracker or MitoRFP. *Significant difference from N-MVEC control, n = 15–20 images from at least 5 different animals per group.
Fig. 6.
Fig. 6.
Computational analysis of mitochondrial network in SU5416 plus hypoxia (SuHx)-microvascular endothelial cells (MVECs). A: represented images of normoxic (N)- and SuHx- mitochondrial networks extracted from images of N- and SuHx-MVECs transfected with MitoRFP. B: table showing expected results of computational analysis of the mitochondrial network under conditions of increased fission or fusion. C: mitochondrial length/number distribution curves for N- and SuHx-MVEC mitochondria showing left shift in SuHx-MVEC mitochondria. D: scatterplot showing means ± SE elements/cluster (Ec) for N- and SuHx-MVEC mitochondria computationally extracted from images of MitoRFP-transfected cells. E: scatterplot showing means ± SE junctions/ends ratio (J/E) for N- and SuHx-MVEC mitochondria computational extracted from images of MitoRFP-transfected cells. *Significant difference from N-MVEC control; n = 10 per group.
Fig. 7.
Fig. 7.
Dynamin-related protein 1 (Drp1) phosphorylation in SU5416 plus hypoxia (SuHx)-microvascular endothelial cells (MVECs). A and B: representative immunoblots demonstrating pDrp1Ser616 (A) and pDrp1Ser636 (B) protein levels in relation to total Drp1 and GAPDH expression in normoxic (N)- and SuHx-MVECs. C: scatterplot showing means ± SE densitometry values for pDrp1Ser616 and pDrp1Ser636, normalized to total Drp1. *Significant difference from N-MVEC control; n = 5–6 per group.
Fig. 8.
Fig. 8.
Decreased oxidative phosphorylation in SU5416 plus hypoxia (SuHx)-microvascular endothelial cells (MVECs). A: representative traces of oxygen consumption rate (OCR) at baseline and following treatment with oligomycin, FCCP, and rotenone/antimycin in Normoxic (N) (dashed lines)- and SuHx-MVECs (solid lines). B and C: scatterplots showing means ± SE OCR values for basal respiration (B) and maximal respiration (C) in N- and SuHx-MVECs. D: representative traces of extracellular acidification rate (ECAR) at baseline and with treatment with oligomycin, FCCP, and rotenone/entimycin in N (dashed lines)- and SuHx-MVECs (solid lines). E and F: scatterplots showing means ± SE ECAR values for basal ECAR (E) and maximal ECAR (F) in N- and SuHx-MVECs. *Significant difference from N-MVECs control; n = 18–20 experiments using cells isolated from 5 different animals per group.
Fig. 9.
Fig. 9.
Reactive oxygen species (ROS) levels in SU5416 plus hypoxia (SuHx)-microvascular endothelial cells (MVECs). A: representative trace of fluorescence ratio (F380/F490) in SuHx-MVECs following infection with roGFP plasmid showing baseline roGFP ratio and decrease in ratio following reduction with DTT(1 mM) followed by a rise in roGFP ratio with addition of exogenous oxidant (1 mM H2O2). B: confocal images of individual excitation/emission images (400/510 and 490/510) as well as 400/490 ratio in normoxic (N)-MVECs and SuHx-MVECs following infection with roGFP-containing plasmid. C: scatterplot showing means ± SE roGFP fluorescence ratio in N- and SuHx-MVECs with and without MitoQ treatment. D: representative traces of roGFP ratio in N-MVECs (dashed line) and SuHx-MVECs normalized to normoxic control (solid line) at baseline and following acute treatment with MitoQ (1 µM). *Significant difference from N-MVEC control; **significant difference from untreated SuHx-MVECs; n = 6–15 individual experiments using cells isolated from 5 different animals.
Fig. 10.
Fig. 10.
Abnormalities in intracellular calcium concentration ([Ca2+]i) in SU5416 plus hypoxia (SuHx)-microvascular endothelial cells (MVECs). AD: representative tracings showing [Ca2+]i in normoxic (N)-MVECs and SuHx-MVECs before and after removal of extracellular Ca2+ (A), treatment with MitoQ (B), treatment with HC-067047 (HC; C), and treatment with GSK2193874 (GSK2; D). E: scatterplot showing means ± SE [Ca2+]i in N- and SuHx-MVECs at baseline and following removal of extracellular Ca2+ via perfusion with Ca2+-free buffer (CF) or treatment with HC (10 µM), GSK2193874 (30 nM; GSK2), TEMPOL (0.5 mM; Tem), and MitoQ (1 µM; MQ). TRPV4, transient receptor potential vanilloid-4; ROS, reactive oxygen species. *Significant difference from N-MVEC control; **significant difference from untreated SuHx-MVECs; n = 5–12/group.
Fig. 11.
Fig. 11.
Transient receptor potential vanilloid-4 (TRPV4) expression and effect of TRPV4 inhibition of reactive oxygen species (ROS) levels in SU5416 plus hypoxia (SuHx)-microvascular endothelial cells (MVECs). A: representative immunoblot showing total TRPV4 expression in normoxic (N)- and SuHx-MVECs. B: scatterplot of means ± SE TRPV4 densitometry values normalized to GAPDH. C: scatterplot showing means ± SE roGFP fluorescence levels in N- and SuHx-MVECs with and without treatment with the TRPV4 inhibitor HC-067047 (10 µM; HC). *Significant difference from N-MVEC control; n = 5–15 individual experiments using cells isolated from 5 different animals.
Fig. 12.
Fig. 12.
Increased migration and proliferation in SU5416 plus hypoxia (SuHx)-microvascular endothelial cells (MVECs). Scatterplots showing migration (A) and proliferation normoxic (N)-MVECs and SuHx-MVECs (B) with and without treatment with TEMPOL (0.5 mM; Tem), HC-067047 (10 µM; HC), and MitoQ (1 µM; MQ). *Significant difference from N-MVECs control; **significant difference from untreated SuHx MVECs; n = 5–12/group.
Fig. 13.
Fig. 13.
A: table showing observed molecular, structural, and functional changes in SU5416 plus hypoxia (SuHx)-microvascular endothelial cells (MVECs). B: proposed mechanisms linking mitochondrail reactive oxygen species (ROS) in intracellular calcium concentration ([Ca2+]i), migration, and proliferation in SuHx-MVECs. Mitochondrial dysfunction (i.e., increased fission, increased ROS production, and decreased oxidative phosphorylation) leads to increased cytosolic ROS levels, which activate transient receptor potential vanilloid-4 (TRPV4), increase [Ca2+]i, and promote migration and proliferation in SuHx-MVECs; thus inhibition of this pathway could be achieved with selective TRPV4 blocker (HC-067047) quenching of cytosolic ROS with TEMPOL quenching of mitochondria-specific ROS with MitoQ. eNOS, endothelial nitric oxide synthase; GS, Griffonia simplicifolia; vWF, von willebrand factor; SMA, smooth muscle α-actin; MHC, myosin heavy chain.

References

    1. Adkison JB, Miller GT, Weber DS, Miyahara T, Ballard ST, Frost JR, Parker JC. Differential responses of pulmonary endothelial phenotypes to cyclical stretch. Microvasc Res 71: 175–184, 2006. doi: 10.1016/j.mvr.2006.02.007. - DOI - PubMed
    1. Aggarwal S, Gross CM, Sharma S, Fineman JR, Black SM. Reactive oxygen species in pulmonary vascular remodeling. Compr Physiol 3: 1011–1034, 2013. - PMC - PubMed
    1. Al-Mehdi AB, Pastukh VM, Swiger BM, Reed DJ, Patel MR, Bardwell GC, Pastukh VV, Alexeyev MF, Gillespie MN. Perinuclear mitochondrial clustering creates an oxidant-rich nuclear domain required for hypoxia-induced transcription. Sci Signal 5: ra47, 2012. doi: 10.1126/scisignal.2002712. - DOI - PMC - PubMed
    1. Austin SA, Katusic ZS. Loss of endothelial nitric oxide synthase promotes p25 generation and tau phosphorylation in a murine model of Alzheimer’s disease. Circ Res 119: 1128–1134, 2016. doi: 10.1161/CIRCRESAHA.116.309686. - DOI - PMC - PubMed
    1. Bell EL, Klimova TA, Eisenbart J, Moraes CT, Murphy MP, Budinger GR, Chandel NS. The Qo site of the mitochondrial complex III is required for the transduction of hypoxic signaling via reactive oxygen species production. J Cell Biol 177: 1029–1036, 2007. doi: 10.1083/jcb.200609074. - DOI - PMC - PubMed

Publication types

MeSH terms

LinkOut - more resources