

Disparities in plain, tap and bottled water consumption among US adults: National Health and Nutrition Examination Survey (NHANES) 2007-2014
- PMID: 29388529
- PMCID: PMC7474465
- DOI: 10.1017/S1368980017004050
Disparities in plain, tap and bottled water consumption among US adults: National Health and Nutrition Examination Survey (NHANES) 2007-2014
Abstract
Objective: Differences in bottled v. tap water intake may provide insights into health disparities, like risk of dental caries and inadequate hydration. We examined differences in plain, tap and bottled water consumption among US adults by sociodemographic characteristics.
Design: Cross-sectional analysis. We used 24 h dietary recall data to test differences in percentage consuming the water sources and mean intake between groups using Wald tests and multiple logistic and linear regression models.
Setting: National Health and Nutrition Examination Survey (NHANES), 2007-2014.
Subjects: A nationally representative sample of 20 676 adults aged ≥20 years.
Results: In 2011-2014, 81·4 (se 0·6) % of adults drank plain water (sum of tap and bottled), 55·2 (se 1·4) % drank tap water and 33·4 (se 1·4) % drank bottled water on a given day. Adjusting for covariates, non-Hispanic (NH) Black and Hispanic adults had 0·44 (95 % CI 0·37, 0·53) and 0·55 (95 % CI 0·45, 0·66) times the odds of consuming tap water, and consumed B=-330 (se 45) ml and B=-180 (se 45) ml less tap water than NH White adults, respectively. NH Black, Hispanic and adults born outside the fifty US states or Washington, DC had 2·20 (95 % CI 1·79, 2·69), 2·37 (95 % CI 1·91, 2·94) and 1·46 (95 % CI 1·19, 1·79) times the odds of consuming bottled water than their NH White and US-born counterparts. In 2007-2010, water filtration was associated with higher odds of drinking plain and tap water.
Conclusions: While most US adults consumed plain water, the source (i.e. tap or bottled) and amount differed by race/Hispanic origin, nativity status and education. Water filters may increase tap water consumption.
Keywords: Disparities; NHANES; Nutrition; Plain water intake; Water filters.
Figures
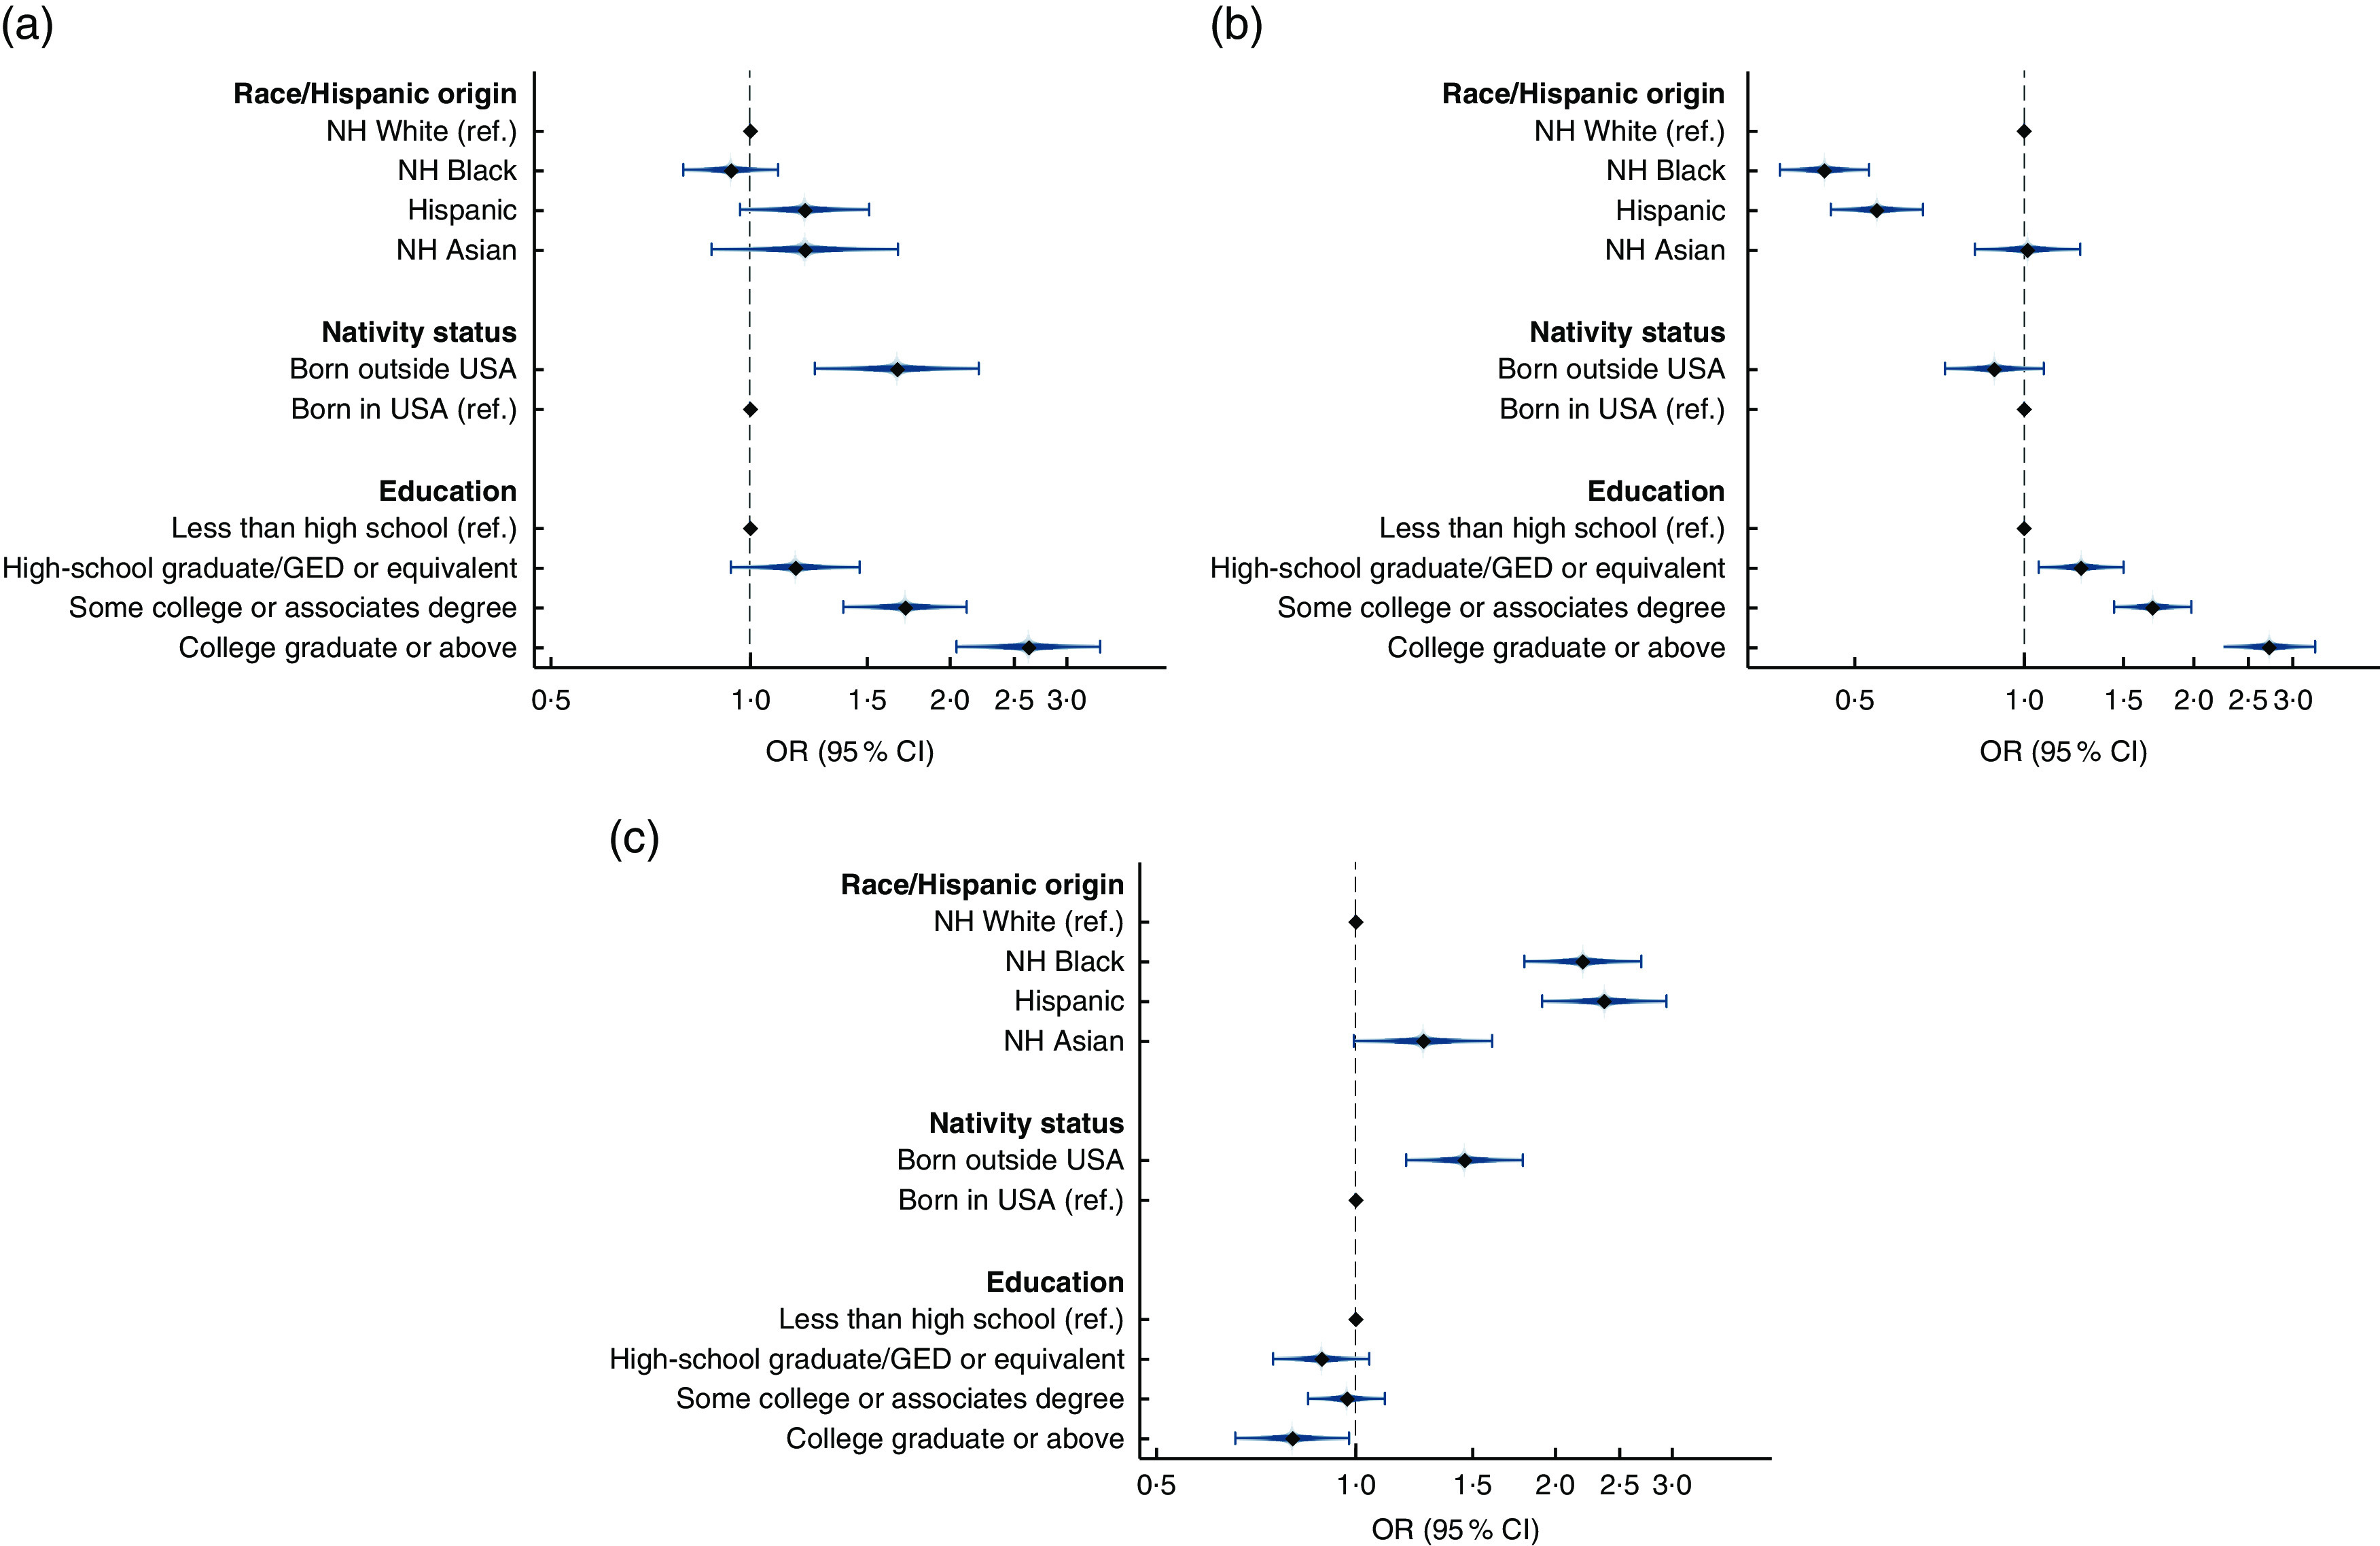
 ), with their 95 % confidence intervals represented by horizontal bars, from multiple logistic regression models in Table 2 assessing the predictors of US adults aged ≥20 years (n 9666) consuming (a) plain water, (b) tap water and (c) bottled water, National Health and Nutrition Examination Survey (NHANES) 2011–2014. Models adjusted for all variables shown as well as sex and age (NH, non-Hispanic; ref., reference category; GED, General Educational Development)
Similar articles
-
Associations between Household Water Fluoridation Status and Plain Tap or Bottled Water Consumption.JDR Clin Trans Res. 2021 Oct;6(4):440-447. doi: 10.1177/2380084420960419. Epub 2020 Sep 17. JDR Clin Trans Res. 2021. PMID: 32940115 Free PMC article.
-
Trends in tap and bottled water consumption among children and adults in the United States: analyses of NHANES 2011-16 data.Nutr J. 2020 Jan 29;19(1):10. doi: 10.1186/s12937-020-0523-6. Nutr J. 2020. PMID: 31996207 Free PMC article.
-
Water and beverage consumption among adults in the United States: cross-sectional study using data from NHANES 2005-2010.BMC Public Health. 2013 Nov 12;13:1068. doi: 10.1186/1471-2458-13-1068. BMC Public Health. 2013. PMID: 24219567 Free PMC article.
-
Using Water Intake Dietary Recall Data to Provide a Window into US Water Insecurity.J Nutr. 2022 May 5;152(5):1263-1273. doi: 10.1093/jn/nxac017. J Nutr. 2022. PMID: 35102375 Free PMC article.
-
Tap Water Consumption and Perceptions in United States Latinx Adults.Nutrients. 2021 Aug 28;13(9):2999. doi: 10.3390/nu13092999. Nutrients. 2021. PMID: 34578876 Free PMC article. Review.
Cited by
-
Drinking water nitrate and risk of pregnancy loss: a nationwide cohort study.Environ Health. 2022 Sep 16;21(1):87. doi: 10.1186/s12940-022-00897-1. Environ Health. 2022. PMID: 36114546 Free PMC article.
-
Associations between Household Water Fluoridation Status and Plain Tap or Bottled Water Consumption.JDR Clin Trans Res. 2021 Oct;6(4):440-447. doi: 10.1177/2380084420960419. Epub 2020 Sep 17. JDR Clin Trans Res. 2021. PMID: 32940115 Free PMC article.
-
Public and private tapwater: Comparative analysis of contaminant exposure and potential risk, Cape Cod, Massachusetts, USA.Environ Int. 2021 Jul;152:106487. doi: 10.1016/j.envint.2021.106487. Epub 2021 Mar 19. Environ Int. 2021. PMID: 33752165 Free PMC article.
-
Factors Related to Water Filter Use for Drinking Tap Water at Home and Its Association With Consuming Plain Water and Sugar-Sweetened Beverages Among U.S. Adults.Am J Health Promot. 2022 Jun;36(5):813-822. doi: 10.1177/08901171211073304. Epub 2022 Mar 2. Am J Health Promot. 2022. PMID: 35081754 Free PMC article.
-
Perceptions of Water Safety and Tap Water Taste and Their Associations With Beverage Intake Among U.S. Adults.Am J Health Promot. 2023 Jun;37(5):625-637. doi: 10.1177/08901171221150093. Epub 2023 Jan 6. Am J Health Promot. 2023. PMID: 36609168 Free PMC article.
References
-
- Cutler D & Miller G (2005) The role of public health improvements in health advances: the twentieth-century United States. Demography 42, 1–22. - PubMed
-
- US Environmental Protection Agency (2017) Drinking Water Requirements for States and Public Water Systems. Washington, DC: US EPA.
-
- Gleick PH (2010) Bottled and Sold: The Story Behind Our Obsession with Bottled Water. Washington, DC: Island Press.
-
- Maloney J (2017) Soda loses its US crown: Americans now drink more bottled water. The Wall Street Journal, 9 March. https://www.wsj.com/articles/soda-loses-its-u-s-crown-americans-now-drin... (accessed January 2018).
Publication types
MeSH terms
Substances
Grants and funding
LinkOut - more resources
Full Text Sources
Other Literature Sources
Medical
Miscellaneous
